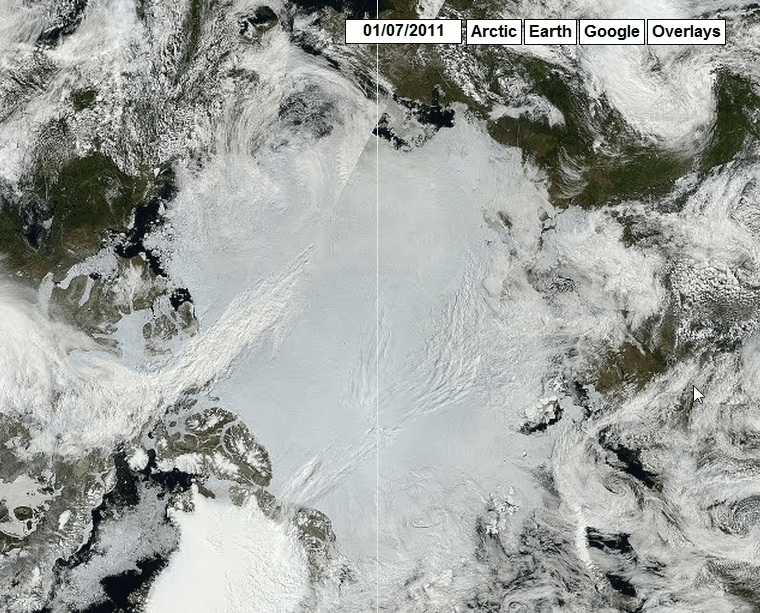
Except for 95% of the area – which has lots of ice.
Disrupting the Borg is expensive and time consuming!
Google Search
-
Recent Posts
- Gaslighting 1924
- “Why Do You Resist?”
- Climate Attribution Model
- Fact Checking NASA
- Fact Checking Grok
- Fact Checking The New York Times
- New Visitech Features
- Ice-Free Arctic By 2014
- Debt-Free US Treasury Forecast
- Analyzing Big City Crime (Part 2)
- Analyzing Big City Crime
- UK Migration Caused By Global Warming
- Climate Attribution In Greece
- “Brown: ’50 days to save world'”
- The Catastrophic Influence of Bovine Methane Emissions on Extraterrestrial Climate Patterns
- Posting On X
- Seventeen Years Of Fun
- The Importance Of Good Tools
- Temperature Shifts At Blue Hill, MA
- CO2²
- Time Of Observation Bias
- Climate Scamming For Profit
- Climate Scamming For Profit
- Back To The Future
- “records going back to 1961”
Recent Comments
- Bob G on Gaslighting 1924
- Bob G on Gaslighting 1924
- conrad ziefle on Gaslighting 1924
- Bob G on Gaslighting 1924
- Bob G on Gaslighting 1924
- arn on Gaslighting 1924
- conrad ziefle on Gaslighting 1924
- Gordon Vigurs on Gaslighting 1924
- conrad ziefle on Gaslighting 1924
- Robertvd on Gaslighting 1924


Minus stories ’bout yourself you merely masturbate, chug chug chug: TELL A STORY. Be human. Don’t be a devout introvert.
Y’lack love for yo’ fo’.
Hmmm! http://arctic.atmos.uiuc.edu/cryosphere/NEWIMAGES/arctic.seaice.color.000.png
I used to really pay attention to the high-res images provided by CT, but often it paints areas as 50-95% that just don’t make sense. IIRC, it had some of the high Arctic as being <90% concentration during Dec-Jan, which really didn't make much sense (refreezing was going on far, far south of there, and the high-Arctic wasn't completely melted in mid Sept and was resolidifying by the end of that month). The low-res images make a lot more sense, at least to me. If someone can explain the odd results portrayed by the high-res ones, I'd be interested to hear it.
-Scott
The microwave sensors often confuse surface meltwater with seawater.
Yes, that makes sense and now I remember that being discussed some last year. IIRC, that’s also why extent is preferred over area (even though area would technically be a better metric), because it helps alleviate some of those problems (with the area number being up to +/- 15% in the summer, IIRC).
Which is interesting, because the CT area numbers tend to do as good or even a better job in being predictive for the Sept minimum. I wonder if it’s because the % of meltwater is roughly consistent year-to-year and thus leads to similar systematic errors?\
-Scott
There’s no ice at all, you’re just seeing a vast field of polar bear corpses.
Stark Dickflossing:
I know that watching ice melt can be rather boring but do you not have any patience? Perhaps you live in a perpetual present? Try breaking the future down into 5 year increments and then let your wunderbar science make some basic predictions about the future.
Steve already made his. When I asked him what would happen by 2020 his wise answer was that the Arctic would either grow, shrik or stay the same. With science like that who needs talismans and Ouija boards?
I’d be happy to make a prediction: Your short-term predictions will continue to validate the skeptics. Your long-term predictions will continue to to recede, ever further into the future, eventually escaping all bound of responsibility. I don’t believe a word you say since you’ve never demonstrated any basis for believing any word you say.
As for the Arctic & Antarctic ice, I bet that you will not jet-ski to the Geographic North Pole in 2020, or any year before or after that.
Repeated for truth, especially the bold part. I like that! A clear bet with a good visual.
Agreed, that watching the day-to day changes in polar ice is like watching paint dry. On the other hand, what is the scientific basis for your suggested 5 year intervals? Consider that we have only had about six 5 year intervals since satellite observation of polar ice began. Before 1979 the polar ice coverage was terra incognito (in spite of anecdotal evidence). So why not 60 year intervals which are more in nature’s scale. For example, this is the approximate cycle time of the PDO.
How much damage is created by Icebreakers?
Depends. If icebreaker hits this peace, icebreaker sinks.
http://www.arctic.io/observations/32/2011-06-30/9-N55.121316-W55.082095/Part-of-Pertermann-Glacier-in-Atlantic