Monterey, CA is a wonderful town – one of my favorites. I took my kids there almost every weekend when they were small. It is also a hotbed of global warming alarmism – most notably predictions of an ice-free Arctic by 2013 from the Naval Research Laboratory.
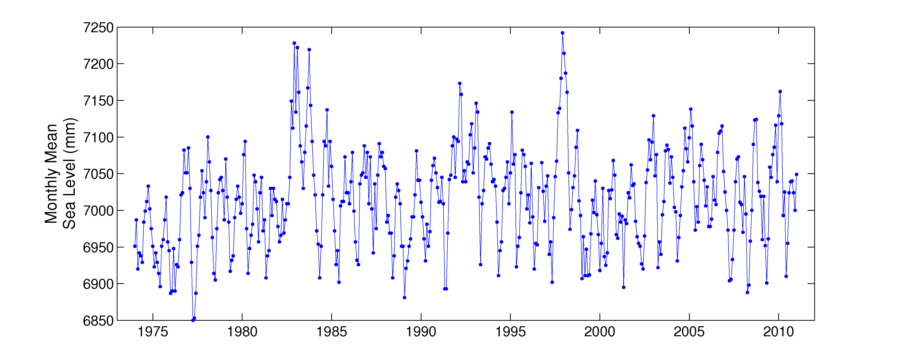
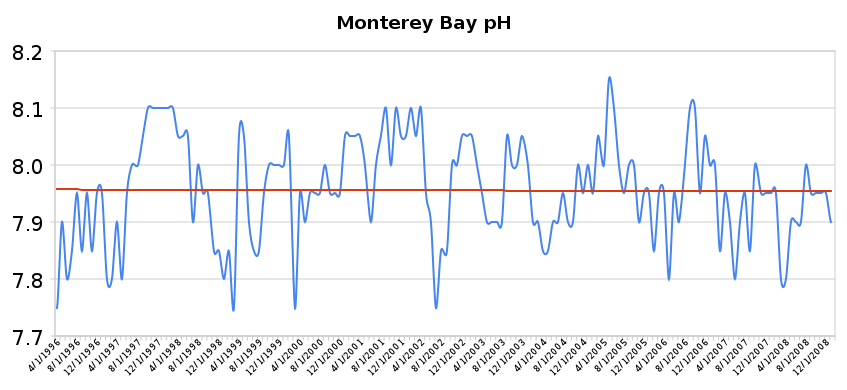
Data collected at the Monterey Bay shows that sea level is not rising and ocean pH is not falling.
Facts however are an unwanted distraction when saving the planet.
http://www.psmsl.org/data/obtaining/stations/1352.php
http://sanctuarymonitoring.org/regional_docs/monitoring_projects/100240_167.pdf


“Facts however are an unwanted distraction when saving the planet.”
Only if you insist on using them. You can always get rid of them in a computer model.
Well, compared with concentrated NaOH(aq), that bay water is dangerously acidic! Oh, what!? It doesn’t work like that? You mean I should have payed attention in High-School chemistry instead of playing Pokémon?
This could only have happened through excessive taxation.
Facts can be adjusted downwards.
I love Monterey, too.. especially her non-acidic waters.. and Santa Cruz.. nice.
That was a pretty brutal rise in Ph from 4/04 to about 8/05. How did the bay survive?
“Data collected at the Monterey Bay shows that sea level is not rising”
Who am I to believe, you or my own lying eyes? Just by eyeballing that top chart I detected a 100mm increase over 40 years, which is precisely what the instruments say is the global mean sea level rise: 2.5 mm/year. I’m sure my eyeballs are way off, but there clearly is an increase there.
Growing up one town south of Monterey, I have a long term memory consisting of 50 years of innumerable multi-seasonal regular if not daily visits to Carmel beach. There have been major changes and huge sand loss that has not been recovered during the annual cycle. What was once complete sand cover all year long morphed very slowly into rocks being exposed in the winter and slowly covered over every summer to now large sandstone formations that are no longer ever covered.
I’ve been to Carmel beach about 500 times and it looks exactly the same
This graph shows things more clearly. There is a step uparound 1980 and since then there is no change, but go ahead and believe your lying eyes if you want.
http://www.psmsl.org/data/obtaining/rlr.annual.plots/1352_high.png
If you go further down the coast to San Diego the records go back for about 100 years.
The trend is a very steady increase during that time. Nothing unusual is happening lately.
http://www.psmsl.org/data/obtaining/rlr.annual.plots/158_high.png
Indeed, this shows the same step up in the early 80s, flat since then.
Any report based on Topex/Poseidon sea level measurements is principally flawed because a most critical part outside 66º N and S is left out. In these areas the sea level sinks dramatically. Around Antarctica down to -2 metres! This massive dip is caused by strong W to E winds driving equally strong currents. Due to strong Coriolis forces near the poles, the water is then pushed equator-ward where it heaps up (Ekman spiral). Topex/Poseidon looks only at the heap and not at the trough, as do moored buoys.
Wind strength, which can change by 25% on a decadal scale and 30% in a century, has a most determining effect on sea levels everywhere. Because of the seminal work of Dr Joseph fletcher, we can no longer ignore this.
Dr Fletcher’s lecture http://www.seafriends.org.nz/issues/global/fletcher.htm
What is normal climate change?: http://www.seafriends.org.nz/issues/global/climate7.htm
Are sea levels rising?: http://www.seafriends.org.nz/issues/global/climate4.htm#Are_sea_levels_rising?