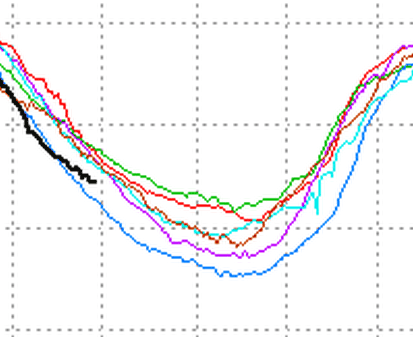
This is the latest DMI graph for July 31.
http://ocean.dmi.dk/arctic/icecover.uk.php
NSIDC’s most recent forecast hinted at a record low this summer.
July 18, 2011
Early sea ice melt onset, snow cover retreat presage rapid 2011 summer decline
Arctic sea ice extent declined at a rapid pace through the first half of July, and is now tracking below the year 2007, which saw the record minimum September extent. The rapid decline in the past few weeks is related to persistent above-average temperatures and an early start to melt.
Last week I gave a different, non-agenda based, forecast for August 1.


Steven, how many times can the NSIDC be wrong before they look inept? Ten? A hundred? A thousand?
The NSIDC has adopted the Hansen scale of ineptitude, the baseline is infinite.
NSIDC reports are usually ambiguous enough to keep their bases covered. This one probably falls under that category too. It is a scenario, not a prediction.
I forgot to ask, why do we always talk about the ice in the Northern Hemisphere? I thought most of the ice was in the Southern Hemisphere; how is that ice doing?
Or maybe southern ice is second class?
Chicken Little uses the ice in the Arctic region as a prop for the doom they are promoting and only bring up the Southern Hemisphere when it fits the agenda.
On the other hand it could be that the Southern Hemisphere is not part of the Globe used by the Chicken Little Brigade but a different planet completely. It replaced Pluto as the ninth planet. We now have Mercury, Venus, Earth North, Earth South, Mars, etc..
However research shows there is the possibility of another mysterious planet lurking near by, SIM Earth, that climatologist are actually studying with their Models.
And this is the software they use:
http://media.strategywiki.org/images/thumb/7/72/SimEarth_-_The_Living_Planet_box.jpg/250px-SimEarth_-_The_Living_Planet_box.jpg
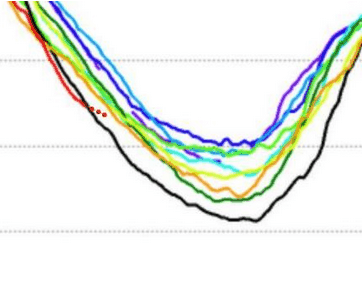
The alarmists don’t mention the Antarctic sea ice because it’s doing just fine. Right now it’s above “average” and rising.
http://nsidc.org/data/seaice_index/images/daily_images/S_timeseries.png
It is now quite apparent that Steve knows what he is talking about. Even the most fanatical global warming true believer has to acknowledge that there will be no record low this year. Hansen can manipulate temperature data, but he has no ability to manipulate the extent of Arctic sea ice.
Satellite photos are hard evidence, unlike Hansen’s imaginary Arctic temperatures.
Well, no, but they can deny the past & pretend that what’s happening now is somehow unprecedented.
So, why are you comparing your IJIS forecast of last week to the DMI data for this week? Could it be because in the IJIS data, 2011 is still only fractionally above 2011, and your forecast was wildly optimistic? When I overlay the figures myself, I’d say that going by the IJIS figure, ice loss has been around 50% faster than your predicted line. I can’t be sure though, as you were canny enough not to put an actual numerical figure on it. Again.
The JAXA August 1 graph won’t be available for two days and smoothes over several days. Trends always lag DMI by a couple of days.
Given that it’s the 31st of July currently, the DMI graph for 1st August won’t be out for another 24 hours either. In any case, the details of how the JAXA graph is generated are largely irrelevant – the point is that you made your forecast based on that graph, and should evaluate it in the same way. Why don’t you post up an overlay?
Be a big boy and say – “Looks like you were correct.”
Why? It doesn’t!
JAXA smooths and lags DMI. DMI gives you a sneak preview of April 1.
Yes, ice loss has slowed in the last couple of weeks – but not nearly as much as you predicted. Overlay the graph yourself if you don’t believe me (though why you seem to not know what you predicted is beyond me).
JAXA shows extent based on a 15% cutoff, DMI shows it based on a 30% cutoff. They are not directly comparable. You made your forecast from the JAXA data, so why are you not evaluating it on that basis?
Please send me a link to the August 1 JAXA graph. I can’t find on Al Gore’s Internet, but you obviously have.
If I link it to you when it comes out in 2 days’ time, do you promise you’ll actually make an overlay and discuss the success (or otherwise) your forecast? I’m quite happy to wait. What I’m not happy with is using a different non-comparable data source to claim spurious success.
Of course. Are you getting nervous about the hopeless bet you made? I tried to warn you.
Not particularly, since I never bet more than I’m happy to lose. I note however that you still didn’t clarify the final terms of the bet. In particular:
1) The amount – I proposed £50 UK, but I’ve yet to hear confirmation from you on that. Is that acceptable to you: yes or no?
2) I said I was betting on the absolute amount of multi-year ice, not the proportion. Do you accept the bet on that basis: yes or no?
Sure. You can still bail if you want. I’d put the odds at over 90% that you will lose.