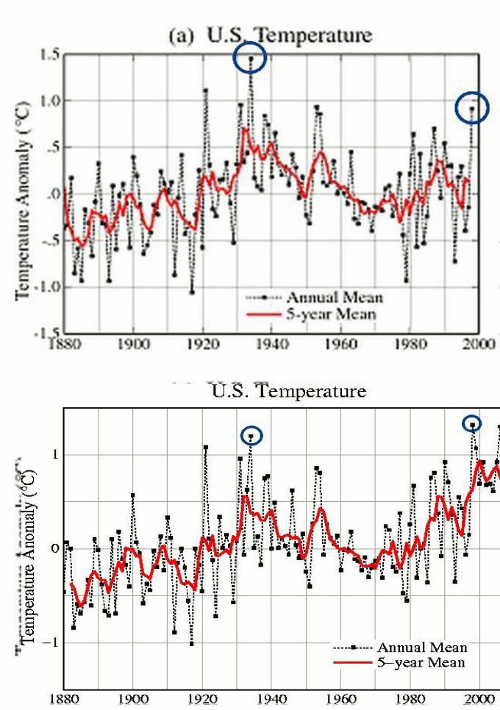
The top five 12 month periods in US history (based on USHCN raw maximum temperatures) all ended in 1934.
Rank End Month Year Temperature
 1        8    1934 67.9292
 2       11    1934 67.8979
 3        7    1934 67.7832
 4       10    1934 67.7182
 5        5    1934 67.7107
Index of /pub/data/ushcn/v2/monthly
Hansen’s graph was correct, before he corrupted it.


But Steve, we all know they went out at 3pm, in the middle of the dust storms, during the Dust Bowl instead of at midnight.
Welcome to TOBS adjustment city, may I take your temperature? No really, hand it over.
Who gave you the authority to show raw temperature data that has been neither peer reviewed or Hansenized? That is a clear crime against the planet. David Appell will not be pleased!
I am not clear on what Hansen did to adjust the data. It would be helpful if someone could explain this. The jumping graph is dazzling but doesn’t quite do it.
I’ve made dozens of posts on the USHCN adjustments. They seem to be completely arbitrary at this point.
“no wonder Hansen can’t joust with jesters, when he’s so busy adjusting his adjustments.”
– Steve McIntyre