
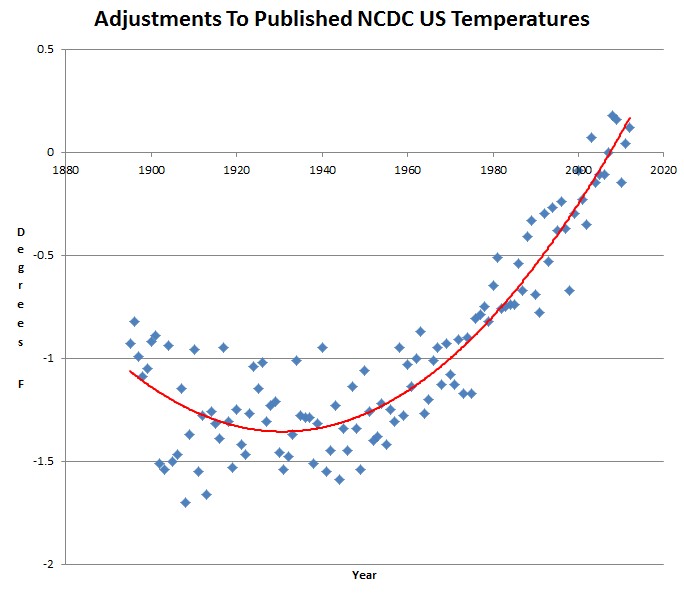
I have been comparing published NCDC US temperatures to the raw HCN temperatures which they are supposed to be derived from. The graph below plots the difference between NCDC published US temperatures and HCN temperatures for all stations which have been continuously active since at least 1920. Note that the 1930s have suffered about 1.4F tampering relative to 2012.
Paul Homewood has approached this from a different angle. He compared the original weather bureau documents of published temperatures to the current NCDC temperatures, and found the same thing.
I reported a few days ago how the original CONUS temperatures, as recorded State by State in 1934, were 1.23F higher than NCDC now show. The original figure of 55.37F has since been adjusted down to 54.14F. As a result, 2012, at 55.34F, is officially the hottest year on record for the CONUS. However, reader Daryl spotted that I had overstated the size of Maine. The result is that I had underestimated the original 1934 temperature by 0.16F, thus making NOAA’s adjustment even greater, at 1.38F.
Tampering With 1934 Temperatures Was Even Worse Than I Thought! | NOT A LOT OF PEOPLE KNOW THAT
This tampering is almost 3X larger than the USHCN documented tampering, and is clearly fraudulent.

The problem with this observation – and I am on the “tampering” side on this – is that this is an exemplar of the “sniff test” variety. A recent paper on WUWT from the warmist side disputed UHIE effects not being properly accounted for with the same reasoning that the graphed trend has been dismissed: taking all the reasons one by one, seeing that each is considered reasonable, you are led, mathematically to the end result.
Mathematically, everything is good. So the pure rationalist is convinced.
I’m in a technical field in which we identify projects based on limited data of variable certainty (oil and gas exploration and development). We project what we think we can find, produce and sell, and determine its economic desirablilty and risk profile. We do this in the same way that temperature changes have been made: a linear, progressive process.
If you go to do something, you have to believe overall in what you are doing. So at each step of the process you tend to give the benefit of the doubt to what you proposed. If X could go up or down, you let it go up if that serves your purpose – even if you admit to uncertainty by giving it only a 5% rise. And you do that at each stage.
In the oil and gas business, a 10% benefit is not considered terribly optimistic. But you do that seven times, and there you are, expecting twice what you actually get.
This is why the sniff test is so important. Despite the rationalizations you use for each step of the process, you have to look at the final result as a whole. Identifying which aspects will work against your ideas is virtually impossible; what you have to do is hammer the expected result with a post facto (??) general disbelief.
The GISS temperature adjustments have not had this done. Each step has been rationalized within the framework of rising temperatures as a result of CO2 increases. Each step is, by itself, reasonable. It is the combination that is not.
Uncertainty taints everything. Hard data is rarely hard if you look close enough. In order to be useful, to provide something that helps you do something you wish to do, you have to make personal, subjective decisions within general, objective ones. Do we round up, or round down is the most simple question of this type. Or, when temperatures were read, did the observers give the benefit of doubt to hotter when hot, colder when cold? The Russian example of temperature fiddling to provide additional fuel supplies is something that you could expect when the benefit of doubt serves better one way than the other.
The graphical display you have done here should be the warning sign: it is both unidirectional and progressive in time of a ratcheting of government and academic commitment to CO2 control.
When I was with a major oil company in 1981, the economic analysis said we would have $200/bbl oil by year 2000. This was Very Good for the long-term health of the Company. It also said that it was better money management to leave oil in the ground for production later, as price growth was faster than inflation or the discount factor! And it was absolutely, perfectly justifiable by commonly accepted mathematical algorithms. Fortunately the lads at the top recognized it for what it was, told us to produce today as yesterday, and not to invest madly for our projected, blindingly brilliant future.
Too bad GISS doesn’t have such realistic – not cynical – thinkers at the top. Instead they have a ranting prophet of doom, for whom such adjustments make sense because he has already bought into the concept the analysis was supposed to prove (or not).