
Cardinals Tamino and Appell warn again that lay people may not see this graph. It might confuse them into believing that CO2 is not the center of the universe.
COI | Centre for Ocean and Ice | Danmarks Meteorologiske Institut
Cardinals Tamino and Appell warn again that lay people may not see this graph. It might confuse them into believing that CO2 is not the center of the universe.
COI | Centre for Ocean and Ice | Danmarks Meteorologiske Institut

Its worse than T & A thought 😉
It’s the ‘new’ normal.
Reblogged this on Climate Ponderings.
The problem is that they claim that this ice is not ‘good’ ice. Instead it is ‘rotten’ ice. Strange that I’ve never seen the ice in my freezer rot.
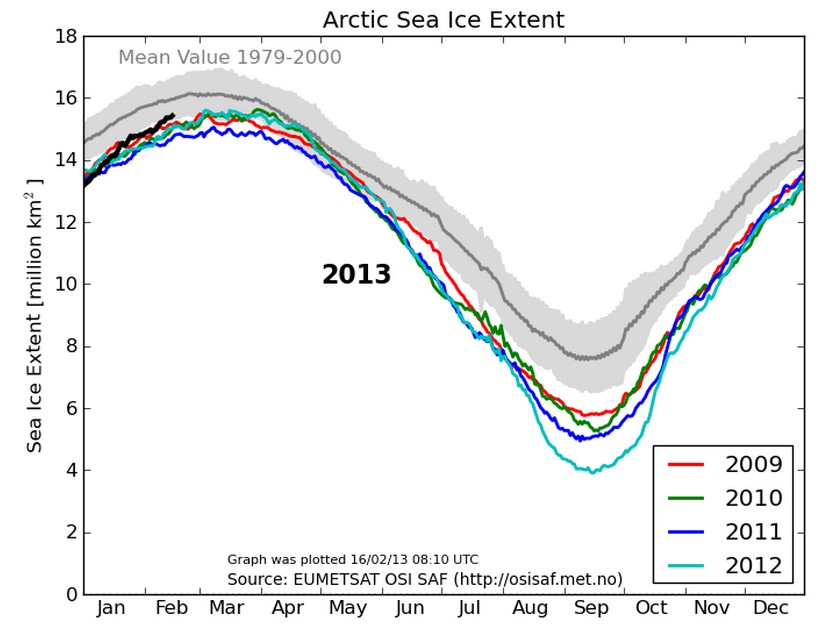
Looks like 2009, 10, 11 and 12 AND 13 are all well below the mean in every month of the year. So what are you trying to show us with this graph? That the Arctic ice is shrinking?
BTW, if you really want to see how much ice we have lost, check out a graph on the last 30 years of Arctic Ice VOLUME.
Using the magical ice volume measuring machine
Goddard: ” Using the magical ice volume measuring machine”
Yes, there is that and Santa sometimes sends out the elves with tape measures. During the Christmas rush, however, he may ask for radar altimetry from the Cryosat-2 and GRACE satellites or for sonar readings from the US Navy — you know, as a back up.
Steve, You may find this interesting — observations that confirm computer. modeling:http://www.jpl.nasa.gov/news/news.php?release=2013-057
New research using combined records of ice measurements from NASA’s Ice, Cloud and Land Elevation Satellite (ICESat), the European Space Agency’s CryoSat-2 satellite, airborne surveys and ocean-based sensors shows Arctic sea ice volume declined 36 percent in the autumn and nine percent in the winter over the last decade.
The work builds on previous studies using submarine and NASA satellite data, confirms computer model estimates that showed ice volume decreases over the last decade, and builds a foundation for a multi-decadal record of sea ice volume changes.
Problem is that Arctic sea ice loss and warming in the NS is the only part of the modelling that has turned out about right. SH, Antarctica, mid latitudes, tropics, middle troposphere… all the modelling there has been wrong. So getting one thing right and everything else wrongs sounds like an accidental score doesn’t it?
Drewski said (February 18, 2013 at 3:49 am)
“…New research using combined records of ice measurements from NASA’s Ice, Cloud and Land Elevation Satellite (ICESat), the European Space Agency’s CryoSat-2 satellite, airborne surveys and ocean-based sensors shows Arctic sea ice volume declined 36 percent in the autumn and nine percent in the winter over the last decade…”
Simply amazing how the use of this data over the last decade is sufficient, but when we use the last 10 years to show little to no warming trend, we’re told that 30-years is the norm.
The earth continues to warm — as models predicted. All the hottest years in the global instrumental record have been since 1998 (the year of the last El Nino event). If we continue to break records without a significant El Nino, it makes you wonder what the temperature record will be when we get another one.
Satellite measurements for ice thickness has only been around since 2002, so you go with what you have. Even if all the other predictions are way off, if this Arctic melt trend holds, then the extra solar absorption into the new open water will have a major impact on global warming.
Positive feedbacks, here we come.
“The multimodel average tropospheric temperature trends are outside the 5–95 percentile range of RSS results at most latitudes.”
http://www.pnas.org/content/early/2012/11/28/1210514109.full.pdf
Or in other words, the models have failed nearly everywhere.
Will,
This NON peer reviewed article was interesting. Did you notice this outtake from the summary?
“After removing all global mean signals, model ?ngerprints remain identi?able in 70% of the tests involving tropospheric temperature changes. Despite such agreement in the large-scale features of model and observed geographical patterns of atmospheric temperature change, most models do not replicate the size of the observed changes. On average, the models analyzed underestimate the observed cooling of the lower stratosphere and overestimate the warming of the troposphere”.
Identifiable in 70% of the tests — very interesting.
Thanx Will, Let me know when you can find a peer-reviewed paper on the subject. in the meantime, did you know that every January, or February or whatever month has been warmer for the past 28 years than that month’s 20th century average? And no significant El Nino for half of that time. What are the odds of that? a billion to one? A gazillion to one?
And coolwhip is on the pal review consensus bullshit yet again! 😆
So what do you suggest to replace it ‘me’?
I know, what if we get non-qualified laymen to make up their own facts and graphs; have other non-qualified people ruminate on these fabrications (and Obama when the whim takes you); blast the real experts for not listening to our opinions; and spend a lot of our time talking about politics.
Above all, we will avoid anything peer reviewed by people who have PhDs. Nothing too “sciency”, but we could still call it “Real Science” if we don’t chuckle too loudly.
What do you think?
Yeah, you said it. Err is it you have that selective reading thing? What was it yet again the IPCC used? ya know one of your bibles ya like to use! :lol;
😆
‘Me’: “Err is it you have that selective reading thing?”
You wouldn’t happen to be an ex-boxer who dabbled in experimental drugs, would you?
😆 WOW I thought you people didn’t believe in conspiracy theories, but I see you just project them! Me guesses it’s the Leu fer you! LMAO!
Conspiracy theories? I truly never know what you are talking about.
Yeah. apparently you think you do! 😆
Err is ya believe ya do? 😆
Drewski you’re a moron. This paper was co authored by twenty+ scientists and published by the national Academy of Sciences. You really are a dickhead aren’t you?
gator is probably right, someone else thinks for him. 😆
Will, you are right — it is peer-reviewed — I followed your link to an opinion page and my comment was in reference to that page.
And, as I said before, it IS interesting. I have just read the whole paper and it clearly shows — regardless of the current underestimation or overestimation errors — that the human fingerprint on climate is becoming more and more certain. I came across statement after statement in that study that reinforces global warming theory. Take for example these two:
“Our ?ngerprint results are interpretable in terms of basic physical mechanisms. The global-scale lower stratospheric cooling is primarily a direct radiative response to human caused depletion of stratospheric ozone (29, 39, 58). TROPOSPHERIC WARMING IS MAINLY DRIVEN BY HUMAN-CAUSED INCREASES IN WELL-MIXED GREENHOUSE GASES (16, 29). The multidecadal cooling of the stratosphere and warming of the troposphere, which is evident in all satellite datasets and simulations of forced climate change examined here, CANNOT BE EXPLAINED BY SOLAR OR VOLCANIC FORCING, OR BY ANY KNOWN MODE OF INTERNAL VARIABLILTY (3, 11).”.
“In the lower troposphere (Fig. 4), the O3+V models reproduce both the large-scale observed warming pattern from 1979 to 2011 and its hemispheric asymmetry. This asymmetry is characterized by maximum warming over the Arctic and minimum warming at high latitudes in the Southern Hemisphere. In the observations, hemispherically asymmetric warming of the lower troposphere is physically consistent with ice/albedo feedbacks arising from the large decrease in Arctic sea ice extent and the smaller increase in Antarctic sea ice coverage (50, 51).
This paper is actually a good example of what peer-review is all about. It talks openly about errors, over estimation, underestimation and the issues these problems raise and possible improvements. Models are never static in any scientific or business discipline and are constantly improving based on the addition of more data — climate models will continue to improve just as climate skeptics will deny that the earth is warming.
Where exactly is
When people promoting an agenda are likewise profiting from it and same people, instead of using raw data, are strongly warm biasing trend of same data without adequate explanation, it does not remotely pass any reasonable smell test.
When same people claim science is settled and likewise exclude “deniers” from the process, peer review is little more than mutual masturbaton.
In the Leu! 😆
This has always been a mystery to me.
Precisely how does a marine biologist from Norway or a glaciologist from Peru or an atmospheric physicist from Australia or a planetary geologist from NASA profit from adjusted data?
What do you mean skeptics are denied from the scientific process? That is malarky. You just have to look at Monckton and Rawls as IPCC reviewers. Heck anyone can be an IPCC reviewer and it certainly helps IF YOU HAVE SOME QUALIFICATIONS. Would you listen to a sewer worker regarding retina myopathy? Should garbage men be allowed to perform bypass surgery?
Adequate explanation?!? Do you know how to use Google? This link took me less than 2 minutes to find and scan — it appears to be very thorough and provides tons of links if you want to get into all the minutia that anyone could wish for. http://www.ncdc.noaa.gov/cmb-faq/temperature-monitoring.html
i couldn’t disagree with you more regarding peer-review — it is a vital cornerstone of the scientific method. You know that system that has propelled us out of the dark ages and given us space travel, personal computers and modern medicine?
😆
RE: It is a vital cornerstone of the scientific method.
And yet in my field, mathematics, peer review fails to impress.
http://publishing.mathforge.org/discussion/80/astonishing-failures-of-peer-review/
I am impressed by the single inspired soul solving intractable problems, ie Grigori Perelman
http://www.google.com/search?q=Grigori+Perelman
Will,
Was this paper one “of the hundreds” of peer-reviewed papers that you weren’t able to find before? It was a good one — really proved your point.
Can you find any more?.
How about the 1990 IPCC report?
http://stevengoddard.wordpress.com/2013/02/18/nsidc-pretending-that-the-satellite-era-began-in-1979/
What about it?
From Wikipedia: “The electrically scanning microwave radiometer (ESMR) was an instrument carried by the Nimbus-5 satellite, precursor to the scanning multichannel microwave radiometer (SMMR) and special sensor microwave/imager (SSM/I) instruments.
The ESMR instrument only senses horizontally polarized radiation at a frequency of 19 GHz, and can be used to calculate sea ice concentration. However, results are difficult to intercompare to SMMR / SSMI. The ESMR scanned along the satellite track, leading to a wide range of incident angles; SMMR scanned with a constant angle of 50 degrees, allowing both horizontally and vertically polarised data to be received; SMMR also had 5 instead of one channels, leading to improved sea ice retrievals.[1]”
Looks like the old ESMR couldn’t properly integrate with the newer SMMR so they didn’t try to put the metaphorical square peg into the round hole.
Are you suggesting that there is something more to the story? Perhaps something nefarious was afoot even as far back as 1979? Maybe the work of the SSSSS (Super Secret Society of Subverted Scientists)? But, I thought they only formed after Al Gore became vice president in 1992.
My God Steve! This would be huge if it is true. Do you think we should alert the NRA and break out the tin-foil?
Polar amplification is out of control. Antarctic sea ice has been above normal for 400 days in a row!
Isn’t this point addressed in the paper so kindly provided by Will?
“In the lower troposphere (Fig. 4), the O3+V models reproduce both the large-scale observed warming pattern from 1979 to 2011 and its hemispheric asymmetry. This asymmetry is characterized by maximum warming over the Arctic and minimum warming at high latitudes in the Southern Hemisphere. In the observations, hemispherically asymmetric warming of the lower troposphere is physically consistent with ice/albedo feedbacks arising from the large decrease in Arctic sea ice extent and the smaller increase in Antarctic sea ice coverage (50, 51).”
BTW, can you provide actual numbers and percentage both for extent and volume, for both the Arctic and Antarctic? I don’t have the exact figures, but, I believe the Arctic has shrunk by close to 80%, volume wise, in the past 30 years and I know the Antarctic has also lost some ice also but I don’t know how much. And I the Arctic extent has shrunk over that time, but again, I don’t know by how much and I think the Antarctic extent has grown by about 1%.
Are those figures correct?
Drewski manages to pull, out of context, a block of text he thinks agrees with his beliefs. Pathetic.
Drewski says:
February 18, 2013 at 10:25 am
So what do you suggest to replace it ‘me’?
—————————————————-
I suggest a real study of the literature. There is zero evidence thaty the ice loss in the NH is mostly caused by CAGW. There is no evidence that it is a disaster. There is no increase in hurricanes droughts floods etc. Your “Looks like the old ESMR couldn’t properly integrate with the newer SMMR so they didn’t try to put the metaphorical square peg into the round hole.” was a real hoot, as if wacko warmist never intergrate one method of measuring an observation with another. Hell, they do this and at the same time wipe out decades of research without so much as hello nod to that research. The title of this post was about CO2 not being the center of the universe. All the real research indicates that it is not. Steves graphs and posts are a short version of what the real research shows. Most people, including you warmist wack jobs refuse to actually study it
Steve, please allow my repost of this with a different ending for our friend Drewski.
Support for the influence of wind and Atmospheric Oscillations and Ocean currents vs CO2:
In this October, 1 2007 NASA article;
http://www.nasa.gov/vision/earth/lookingatearth/quikscat-20071001.html
Son V. Nghiem of NASA’s Jet Propulsion Laboratory, said that “the rapid decline in winter perennial ice the past two years was caused by unusual winds. “Unusual atmospheric conditions set up wind patterns that compressed the sea ice, loaded it into the Transpolar Drift Stream and then sped its flow out of the Arctic,” he said. When that sea ice reached lower latitudes, it rapidly melted in the warmer waters.
“The winds causing this trend in ice reduction were set up by an unusual pattern of atmospheric pressure that began at the beginning of this century,” Nghiem said.”
This 2010 Guardian article states that;
“Much of the record breaking loss of ice in the Arctic ocean in recent years is down to the region’s swirling winds and is not a direct result of global warming, a new study reveals.”:
http://www.guardian.co.uk/environment/2010/mar/22/wind-sea-ice-loss-arctic
This 2011 paper submitted to The Cryosphere by L. H. Smedsrud, et al. “used “geostrophic winds derived from reanalysis data to calculate the Fram Strait ice area export back to 1957, finding that the sea ice area export recently is about 25% larger than during the 1960’s.”
http://www.the-cryosphere-discuss.net/5/1311/2011/tcd-5-1311-2011-print.pdf
This 2007 paper “Rapid reduction of Arctic perennial sea ice” by Nghiem, Rigor, Perovich, Clemente-Colo, Weatherly and Neumann states that;
“Perennial-ice extent loss in March within the DM domain was noticeable after the 1960s, and the loss became more rapid in the 2000s when QSCAT observations were available to verify the model results. QSCAT data also revealed mechanisms contributing to the perennial-ice extent loss: ice compression toward the western Arctic, ice loading into the Transpolar Drift (TD) together with an acceleration of the TD carrying excessive ice out of Fram Strait, and ice export to Baffin Bay.”
http://seaice.apl.washington.edu/Papers/NghiemEtal2007_MYreduction.pdf
This 2004 paper “Variations in the Age of Arctic Sea-ice and Summer Sea-ice Extent” by Ignatius G. Rigor & John M. Wallace, states that;
“The winter AO-index explains as much as 64% of the variance in summer sea-ice extent in the Eurasian sector, but the winter and summer AO-indices combined explain less than 20% of the variance along the Alaskan coast, where the age of sea-ice explains over 50% of the year-to year variability. If this interpretation is correct, low summer sea-ice extents are likely to persist for at least a few years. However, it is conceivable that, given an extended interval of low-index AO conditions, ice thickness and summertime sea-ice extent could gradually return to the levels characteristic of the 1980?s.”
http://seaice.apl.washington.edu/
2004 Science Daily article,” Extreme changes in the Arctic Oscillation in the early 1990s — and not warmer temperatures of recent years — are largely responsible for declines in how much sea ice covers the Arctic Ocean, with near record lows having been observed during the last three years, University of Washington researchers say.”
“It may have happened more than a decade ago, but the sea ice appears to still “remember” those Arctic Oscillation conditions, according to Ignatius Rigor, a mathematician with the UW’s Applied Physics Laboratory.”
http://www.sciencedaily.com/releases/2004/12/041220010410.htm
This 2010 paper, “Influence of winter and summer surface wind anomalies on summer Arctic sea ice extent” by Masayo Ogi, Koji Yamazaki and John M. Wallace, published in Geophysical Research Letters states that;
“We have shown results indicating that wind?induced, year?to?year differences in the rate of flow of ice toward and through Fram Strait play an important role in modulating September SIE on a year?to?year basis and that a trend toward an increased wind?induced rate of flow has contributed to the decline in the areal coverage of Arctic summer sea ice.”
http://www.jamstec.go.jp/frcgc/research/d2/masayo.ogi/2009GL042356.pdf
This 2001 paper, Fram Strait Ice Fluxes and Atmospheric Circulation: 1950–2000
by Torgny Vinje found that:
“Observations reveal a strong correlation between the ice fluxes through the Fram Strait and the cross-strait air pressure difference.”
“Although the 1950s and 1990s stand out as the two decades with maximum flux variability, significant variations seem more to be the rule than the exception over the whole period considered.”
“A noticeable fall in the winter air pressure of 7 hPa is observed in the Fram Strait and the Barents Sea during the last five decades.”
“The corresponding decadal maximum change in the Arctic Ocean ice thickness is of the order of 0.8 m. These temporal wind-induced variations may help explain observed changes in portions of the Arctic Ocean ice cover over the last decades. Due to an increasing rate in the ice drainage through the Fram Strait during the 1990s, this decade is characterized by a state of decreasing ice thickness in the Arctic Ocean.”
http://journals.ametsoc.org/doi/abs/10.1175/1520-0442%282001%29014%3C3508%3AFSIFAA%3E2.0.CO%3B2
“The decreases in recent decades, which are also partially due to circulation-driven ice export through the Fram Strait between Greenland and Svalbard (Vinje, 2001), have coincided with a positive trend in the NAO, with unusually high index values in the late 1980s and 1990s. During this period, the variability of ice motion and ice export through the Fram Strait was correlated strongly with the NAO; r? 0.86 for the ice area flux (Kwok and Rothrock, 1999) and r? 0.7 for the ice volume flux (Hilmer and Jung, 2000), although the relationship was insignificant (r? 0.1) before the mid 1970s (Hilmer and Jung, 2000). Deser et al. (2000) analysed a 40-yr gridded data set (1958–97) to determine the association between arctic sea ice, SAT and SLP, concluding that the multidecadal trends in the NAO/AO in the past three decades have been ‘imprinted upon the distribution of Arctic sea ice’, with the first principal component of sea-ice concentration significantly correlated (r??0.63) with the NAO index, recently cause-and-effect modelled by Hu et al. (2002). None the less, our calculations and those of Deser et al. (2000) indicate that, even in recent decades, only about one third of the variability in arctic total ice extent and MY ice area (Johannessen et al., 1999) is explained by the NAO index ”
” The decadal-scale mode associated with the Arctic Oscillation (AO) and a low-frequency oscillation (LFO) with an approximate time scale of 60-80 years, dominate. Both modes were positive in the 1990s, signifying a prolonged phase of anomalously low atmospheric sea level pressure and above normal surface air temperature in the central Arctic. Consistent with an enhanced cyclonic component, the arctic anticyclone was weakened and vorticity of winds became positive. The rapid reduction of arctic ice thickness in the 1990s may be one manifestation of the intense atmosphere and ice cyclonic circulation regime due to the synchronous actions of the AO and LFO. Our results suggest that the decadal AO and multidecadal LFO drive large amplitude natural variability in the Arctic making detection of possible long-term trends induced by greenhouse gas warming most difficult.”
Igor V. Polyakov and Mark A. Johnson, 2000
http://ruby.fgcu.edu/courses/twimberley/EnviroPhilo/Decadal.pdf
“Hilmer and Jung (2000) note a secular change in the relationship between the Fram Strait ice flux and the NAO; the high correlation noted by Kwok and Rothrock (1999) from 1978 to 1996 was not found in data prior to 1978. We expect our overall results to be more robust given the strong relationship between the AO and SIM over the Arctic, as compared to the weaker relationship between the north–south flow through Fram Strait and the AO. Even if one ignored the effect of the AO on the flux of ice through Fram Strait, the divergence of ice in the eastern Arctic would be still be ;50% greater under high-index conditions than under low-index conditions, and the heat flux would be ;25% greater.”
” We have shown that sea ice provides memory for the Arctic climate system so that changes in SIM driven by the AO during winter can be felt during the ensuing seasons; that is, the AO drives dynamic thinning of the sea ice in the eastern Arctic during winter, allowing more heat to be released from the ocean through the thinner ice during spring, and resulting in lower SIC during summer and the liberation of more heat by the freezing of the ice in autumn. The correlations between the wintertime AO and SIC and SAT during the subsequent seasons offers the hope of some predictability, which may be useful for navigation along the Northern Sea route.”
http://www.drroyspencer.com/wp-content/uploads/Response-of-Sea-Ice-to-the-Arctic-Oscillation-2002-J-Climate.pdf
August 14, 2012 at 11:02 am
http://bprc.osu.edu/geo/publications/mckay_etal_CJES_08.pdf
This paper shows that there is more ice now than the average of the past 9000 years.
It is widely known that the current ice conditions are nothing special…
“Arctic Ice Loss Has Been Much Worse Historically”
“The meltdown underway in the Arctic is remarkable, but an international team of beachcombers has uncovered evidence it’s been much worse before.”
“Based on the paleoclimate record from ice and ocean cores, the last warm period in the Arctic peaked about 8,000 years ago, during the so-called Holocene Thermal Maximum. Some studies suggest that as recent as 5,500 years ago, the Arctic had less summertime sea ice than today. However, it is not clear that the Arctic was completely free of summertime sea ice during this time.”
So you wacko CAGW warmist nut jobs who think a cherry picked thirty five year arctic history falsely attributed to CO2 is the true story, the short version of the above is that the major reasons for the recent NH decline are mainly caused by wind and ocean current changes, and have happened many times in the past, and there is NONE, as in ZERO evidence that CAGW is a major factor in any of this, or that SL rise is accelerating. SHOW ME THE C IN CAGW!!! Drewski can not. DENY THE HUNDREDS OF PAPERS SHOWING THE BENFIT OF CO2 Drewski can not.
Drewski, furthermore you seam unable to understand the political aspect of scientist going where the money is, as if human nature stops functioning when the goverment is involved and only conservatives are influenced by the dark side of human nature. You act as if the idea that group think, confirmation bias, desire for money and power, are incapable of affecting some noble statist goverment controlled research. You ignore that the number one murderer in the past 100 years is “democide” death by Goverment, I really think you should read “Blue Planet in Greeen Shackels to get a clue as to how and why this so called research is being driven. Because for now your complaints about this site only reveal that the only thing exceeding your ignorance is your arrogance.
Hi David,
http://www.guardian.co.uk/environment/2010/mar/22/wind-sea-ice-loss-arctic
This article doesn’t actually link to any study, so I will not comment. However, it does repeat the exact phrases found in your other links that were published years earlier even though the article claims it is recent research?!? (Must have been a slow news week for climate skeptics at the Guardian.)
http://www.nasa.gov/vision/earth/lookingatearth/quikscat-20071001.html
This article references the study found in another of your links. It acknowledges human induced warming and is more than 5 years old (Oct. 1 2007) and it also says that – at most – 1/3 of the melting is due to wind.
http://www.the-cryosphere-discuss.net/5/1311/2011/tcd-5-1311-2011-print.pdf
This 2011 paper pretty much corroborates the 2007 paper as it states that perhaps 1/3 of the ice loss through the Fram Straight BEFORE 2009 was from wind.
Abstract: ´ APART FROM MELTING, the southward drift through Fram Strait is the main loss.”
Conclusions: “The sea ice area export in 2009 and 2010 was lower than for the previous years, 2005, 2006, 2007 and 2008, perhaps indicating that the sea ice export may return to more moderate levels again soon.”
http://seaice.apl.washington.edu/Papers/NghiemEtal2007_MYreduction.pdf
This is just the actual S. V. Nghiem study summarized in the NASA link above.
Introduction: “Dynamic and THERMODYNAMIC EFFECTS appear to be combining to expedite the loss of perennial sea ice.
Regarding the older links, I didn’t bother to read them – I doubt that they offer much current relevance as the Arctic has changed so radically since 2004 and we have new and better instrumentation for an improved analysis.
Bottom line: the papers I read offer an explanation for perhaps 1/3 of the ice loss since the year 2000 up to 2010. They do not explain the accelerating ice volume loss of 2011 or 2012 and they also DO NOT refute man-made global warming is the largest cause of Arctic ice cover.
Now that I have answered everyone’s questions AGAIN, when will someone explain to me how international scientists stand to profit from adjusting raw temperature data?
By adjusting data in favour of creating an apparent problem, which you then require further funding to study, you get to keep your job. Are you a dickhead? I’m not suggesting that is happening. There could be other explanations. But the way you’ve posed the question shows you’re a dick.
http://wattsupwiththat.com/2011/10/03/hansen-rakes-it-in/
LOL,
I see Drewski is back with his always stupid moving the goalpost bullshit.He is given science papers but poopoohs them when they don’t meet his belief system.He was shown a few papers that covered earlier times in the interglacial period and he always fights the main position of the papers because they do not fit with his belief system.
This is a narrowminded bigot who will fight against the tide of legitimate science research that he can’t accept because he a determined CAGW believer and will do so as long as he lives.
Sunsettommey, I poopooh papers? Not since I was really young.
Actually, the paper that Will provided us listing those dozens of scientists and the National Academy of Sciences was very educational.
As far as moving the goal posts, do you have an example? Goddard is brilliant at moving the goal posts. Have you noticed that the article began with a mocking of recent Arctic sea ice extent that morphed into some sort of point regarding satellites (???) in 1979 then morphed again into ice extent in the Antarctic? Soon we will be talking about how Obama is subverting Homeland Security.
I don’t have time right now, sunsettommey, to rebut each and every point on David’s list, so could you do me a favor and show David how I shot you down when when you were raising the same points with me a few weeks ago? Thanx — I owe you.
Hasta lumbago,
He is very good as ignoring the main conclusions of a paper and then citing some other minor paragraph that he thinks supports his position. (Shakes head.)
Brewski says, “Are those figures correct?
No.
Drewski with his words exposes what a closeminded jerk he is:
“I don’t have time right now, sunsettommey, to rebut each and every point on David’s list, so could you do me a favor and show David how I shot you down when when you were raising the same points with me a few weeks ago? Thanx — I owe you.”
You made clear here that you already decided that what Dave posted that you have not read yet as being wrong.
That is why your camp is being creamed in debates these days because you have to follow your CAGW religion and therefore will say anything to avoid the reality that many published science papers are showing evidence of past lower level of Arctic ice cover than now.
You still ignored what Dr. Meier said about at the WUWT guest post he made where he himself stated that it has been lower than now in the past.
“First, we know the Arctic can potentially lose all its sea ice during summer because it has done so in the past. Examination of several proxy records (e.g., sediment cores) of sea ice indicate ice-free or near ice-free summer conditions for at least some time during the period of 15,000 to 5,000 years ago (Polyak et al., 2010) when Arctic temperatures were not much warmer than today.”
http://wattsupwiththat.com/2010/07/14/nsidcs-dr-walt-meier-part-2/
I already have covered these points on ancient Arctic ice cover with you sunsettomey (remember the dumping of the freshwater lake and the amplified solar radiation and the western Arctic acting in an opposite direction to the eastern side?). I can’t be responsible if you don’t like the explanations — take it up with the scientists, but don’t say I have avoided your questions.
Now, when are you going to give me an example of how I have moved the goal posts?
Fair is fair.
sunsettommey, apparently you missed this quote from your esteemed Dr Meier: http://wattsupwiththat.com/2012/06/20/sea-ice-news-nsidcs-dr-walt-meier-on-this-arctic-ice-season/
“However, since then the AO has been in a mostly neutral or negative mode and yet older ice has continued to be lost. For those interested, a nice animation of changes in ice age can be seen at the NOAA Climate Watch website.
Thus, the long-term thinning trend is PRIMARILY A REFLECTION OF ADDITIONAL ENERGY FROM GLOBALLY WARMING TEMPERATURES. Thick ice still moves out of the Arctic (or melts within the Arctic), but the additional energy in the Arctic prevents the replenishment of thicker ice at the same pace. The system is out of equilibrium and older, thicker ice continues to decline (though with some year-to-year variability).”
First Goddard posts a graph that shows the last 5 years of Arctic extent is below normal, then Will provides a very well-referenced study reinforcing global warming theory and now you cite Dr Meier who tells us that “globally warming temperatures” is the reason for a thinning Arctic.
This is confusing — aren’t you guys supposed to disagree with AGW? I told you it was a bad idea to reference PhDs and peer-review literature. Stick to what you are good at — Obama bashing and global conspiracies.
Hi Guys,
Nobody answered my questions regarding polar ice loss, so I had to find things out for myself. and Steve was right (as the headline above exclains) you may want to “Avert Your Eyes” because this ain’t pretty.
First this shocker — Arctic ice volume (the most important measure) has plummeted by more than 80% in 33 years: https://14adebb0-a-62cb3a1a-s-sites.googlegroups.com/site/arctischepinguin/home/piomas/grf/piomas-trnd6.png?attachauth=ANoY7conVofVhIZuLiL2E1wKtPYj0KG4wgukYH24VYTBZmmXUW-VqT5H9qSjXDhiDqaqW6KQPUNv4aR3yEtGn3DC4CSwSzPn2VwnmjS4qgD9UBmdd1xsd4CrYG_Q2JWjalAwQkcdvJwfx8BHhja5lv-4gMLMY_PWqV2cPgeduoLhci3dIvPDz9F1ulFsuC3xRxxBi_n3S3J9d5q5AhhsY65f6qn1XgK63OhhCDKi__9IT6Lyx5K1helDFOHpx0jJnQGgWncTcIcE&attredirects=0
Arctic ice extent has dropped more than 12% over that period: http://www.carbonbrief.org/blog/2013/02/new-satellite-data-confirms-major-arctic-ice-loss
Antarctic sea ice extent has increased a little over 3% since 1979: http://earthobservatory.nasa.gov/Features/WorldOfChange/sea_ice_south.php
Antarctic ice volume information is difficult to find. This link for a 5 year period beginning in 2003 and it shows virtually no change in ice volume: http://onlinelibrary.wiley.com/doi/10.1029/2012JC008141/abstract
Bottom line: The Arctic is disappearing very rapidly and will lead to more open ocean and thus more solar radiation absorbed. The small increase in Antarctic ice extent will not be an effective counter to the extra energy added to the Earth system.
Another inconvenient truth.
You aren’t paying attention
http://stevengoddard.wordpress.com/2013/02/18/what-happened-to-the-thick-ice-in-the-arctic/
OMG! Not ANOTHER reference to yourself! In what universe does citing yourself help to support your own argument?
I didn’t realize that I created the NSIDC animation. Thanks for clearing that up.
Using your logic, anything Drewski says – is invalid as an argument because Drewski said it.
Steve,
Why does your home page show the time-lapse graphic stopping at 1996, but the source graphic goes to 2007? If I didn’t know you better, I would say you were doctoring your graphic to fit a pre-determined bias.
And, why stop at 2007 anyway? Wouldn’t it be even more dramatic to go up to 2012 when the ice volume had dropped at least another 20%?
For future reference, post the source material.Simple ay?
Oh, and BTW, have a read through this blog — did I say anything that wasn’t supported by a reference?
Stop being an idiot Drewski. I am discussing the time interval from 1988-1996 when most of the older ice was lost. Nothing was doctored. I am showing the data for the time interval being discussed. I provided a link to the full dataset.
What is wrong with you?
Drewski lost me when he brushed aside a National Academies of Sciences research paper with 20+ coauthored scientists on it, which I linked to, because its conclusions didn’t agree with what he already believed. Besides being a nitwit, he is a nitwit with an agenda. He goes into the mock basket now.
Goddard: Look at the still shot of 2007 from your edited graphic and then try and tell me that with a straight face.
From the Piomas chart and using precise cross points (I hope it copies over);
1988 – minimum Arctic ice volume is 15,000 cubic Ks
1996 – volume is 12,000 Ks – a drop of 3,000
2007 – volume is 9,000 Ks – a drop of another 3,000
2012 – volume is at 4,000 Ks – a drop of another 5,000
Goddard: “1988-1996 when most of the older ice was lost.” (actual loss of 3,000 cubic Ks)
Reality: From in 1996 to 2012 8,000 cubic Ks were lost. (more than 260% more ice loss ocurred in this period than in Goddard’s time frame).
If the graph doesn’t copy — here is the link: https://14adebb0-a-62cb3a1a-s-sites.googlegroups.com/site/arctischepinguin/home/piomas/grf/piomas-trnd6.png?attachauth=ANoY7cprsTNxOjrUg-LYPy66f0QPIOwhwr0j5r6p0Wwv1xsUtEP_LPfWuDUmVFvi-Ggv3w7T9Vk1z6GA55olOu27xIFuTxqm2L6vmDOpROsF60M2_36W8x4k4NVGVvtIL5TrL6y0hMMsdPmrT3zFmkPEis-oY7R1sOlpwXmgBvoRwhyuT0C3PDJrvjcX76Ta0rgtssFpl7aPaw-ytBKBV1VuqJez59UpdL-Wy1HYkSH6Jqn96GWZgGZFrvyHKfAaWf5bMsLbBX4m&attredirects=0
You are a paranoid loon, and are comparing legitimate NSIDC measured data of ice flows to PIOMAS junk.modeling.
Will,
Who said I brushed it aside — I have embraced it. I had mistakenly discounted an opinion page on the paper (hoping to get a quick synopsis), but the actual paper is terrific. It talks openly about the limitations, the error margins, where they could improve and yet, through it all, some really solid evidence for AGW.
There are models in there that predicted not only the steep ice loss in the Arctic but the see ice growth in the Antarctic and they mention that the human fingerprint can be found in 70% of the climate observations.. There are so many choice statements in this treasure trove that I will be mining it for months to come.
That really-well referenced study you have so kindly provided is GOLD.
Thanks again Will. And I should also be thanking sunsettommey for forcing me to read Dr Meier — more gold.
Can you find me another one?
Let me get this straight.
NSIDC good.
Piomas bad.
Right?
But, why then does NSDIC, themselves, reference PIOMAS? http://nsidc.org/arcticseaicenews/2011/08/arctic-sea-ice-at-the-crossroads/
“Combining ice thickness with sea ice area gives the total sea ice volume. At present, researchers cannot measure volume directly, so they estimate the volume with computer models. The University of Washington’s Pan-Arctic Ice Ocean Modeling and Assimilation System (PIOMAS) model combines data on sea ice concentration with models of ocean and atmospheric conditions to estimate total ice volume. Sea ice volume normally changes with the seasons, but monthly estimates through July 2011 show that the volume for each month has tracked well below the 1979 to 2010 average, and below the volume for 2007, which saw the record low ice extent. PIOMAS projects that this year’s minimum volume in September will very likely finish below 2007 and could even reach a record low volume.
Steve, my friend, when you find yourself in a hole, the first thing you should do is stop digging.
I’m not wasting any more time talking to you. You are only here to make noise.
I am sorry Steve. I promise not to point out your logical failings or your lack of qualifications anymore. Can we still be friends?
Brewski, you did not answer the questions, as I did not ask you any. You claim my links show only
one 3rd loss due to wind. So you ignored changes in ocean currents, both temperature and speed. Notice, not a question, but a statement, one that is factually correct. None of the papers I linked showed 2/3rd sea ice loss due to due to C02 emissions. None, as in zero. You have wind, ocean current changes, yes even insolation changes, and T changes. Only the T changes not related to wind, PLUS warmer water currents , or faster water currents, and not related to insolation, could possibly potentially be the result of AGW, however the evidence of that is very weak.
Now Brewski, notice I said “AGW”. Why? Pay attention. Because even if the actions of mankind somehow partially caused a summer loss of sea ice, there is no disaster, and the benefits of CO2 are known, observed in hundreds of studies and thousands of experiments, whereas the disasters predicted by the models are, like Hansen’s predictions, grossly missing in observations.
BTW your 3% increase in the SH is only based on the entire year, and is a bit dated. It is considerably more, and in addition reaches a lower laditude, having a much greater impact on insolation then the far north ice, or lack therof for two months in the NH summer. Also the insolation in the SH is about 7% stronger in their summer, to to earth’s orbital mechanics.
Cocerning the loss this past year, well, Steve’s link is just fine. What should I think? Did that video show a massive storm moving all that Ice out rapidly, or was there a sudden influx of CO2 that Steve’s video misssed?
David,
I suggest you read the papers again. There is no mention of ocean currents being responsible for ice loss in the Arctic but plenty of mentions of warming and melting. For example, these two quotes came from your own links: “APART FROM MELTING, the southward drift through Fram Strait is the main loss.” and “Dynamic and THERMODYNAMIC EFFECTS appear to be combining to expedite the loss of perennial sea ice.
We can also quote sunsettommey’s favorite scientist, Dr Meier: “Thus, the long-term thinning trend is PRIMARILY A REFLECTION OF ADDITIONAL ENERGY FROM GLOBALLY WARMING TEMPERATURES.”
Or how about this one from Will Nitshke’s link?: “TROPOSPHERIC WARMING IS MAINLY DRIVEN BY HUMAN-CAUSED INCREASES IN WELL-MIXED GREENHOUSE GASES (16, 29). The multidecadal cooling of the stratosphere and warming of the troposphere, which is evident in all satellite datasets and simulations of forced climate change examined here, CANNOT BE EXPLAINED BY SOLAR OR VOLCANIC FORCING, OR BY ANY KNOWN MODE OF INTERNAL VARIABLILTY (3, 11).”.
And Goddard, himself, provided a graph showing that the Arctic over the past 5 years is dramatically smaller.
All these quotes and evidence comes directly from links YOU GUYS PROVIDED. And you are calling me a stooge because I pay attention and you don’t?!? Bizarre to say the least.
But to be extremely clear about what REAL scientists are saying, “Scientific American” summarizes what is known about the shrinking Arctic titled ARCTIC SEA ICE: WHAT WHY AND WHAT NEXT
Here is but a tiny sampling: “Looking over the data from 1979 to 2011 (before this year’s record low), a team of scientists led by Julienne Stroeve at the NSIDC found that random variations accounted for 40% of the change in ice cover to date, and that HUMAN ACTIVITY ACCOUNTED FOR AROUND 60% of the change. Other research points to an EVEN GREATER HUMAN COMPONENT. In 2011, a team led by chilean scientist Chistophe Kinnard published a paper in “Nature”that used data from 69 sites around the Arctic to reconstruct the extent over the last 1450 years — all the way back to the 6th century AD. what they found was that late summer ice coverage over that entire gfourteen and a half century period stayed between 9 million and 11 million square kilometres, alittle higher than it was before satellite observation started in 1979, or roughly THREE TIMES THE MINIMUM we hit this September”
OK we give up. Drewski is right guys.
I am just flabbergasted that with all this Arctic warming, the system not only recovered, but the RATE of recovery is the highest ever.
So what are we to conclude. In a warming world, ice freezes faster.
Right. Got it…
So, is the current -35 degree Arctic temperature above or below normal?
Ben,
its Winter, ice freezes. In Summer, the first-year (thinner) ice will melt. That is why multi-year ice (volume) is the metric that really matters. The Arctic has lost more than 4/5ths of its volume in the past 33 years and 50% of that happened since year 2000 — comprende?
That’s funny, because alarmists were fully hysterical about extent last year after a storm broke up the ice.
That is not correct Steve. Scientists were getting excited before that occurred and this twice-decadel summer storm only did as much damage this time was BECAUSE the Arctic was in such a weakened state.
However, I will tell you what is really funny — all those “hysterical’ blogs from you last March about how the “alarmists” were in panic mode over the ice extent briefly reaching the average mean for that time of year even though all the “alarmist experts” were cautioning that the extent was only first-year ice and that the September minimum was almost certainly going to be below the average.
And who turned out to be right?
RE: Who turned out to be right?
The storm in early August turned out to be right. Go back and carefully review the video of the entire season.
If that doesn’t convince you, I’ll send you a link you can’t dispute.
Ben,
Why don’t you take a good look at Goddard’s graph at the top of the page — for the month of July (and before the storm), can you tell me which year was tracking as the lowest on record?
Perhaps you could also explain why these occasional summer storms (average every 4 years) did not decimate the Arctic ice on the other occasions.
In the meantime, will somebody PLEASE tell me how international climate scientists stand to profit from adjusted temperature data? I have only been asking, like, forever.
You repeated question about how scientists stand to profit was answered.
Drewski,
RE: Its winter, ice freezes
Duh, since you ignored the question, I will restate.
How in an Arctic world that is arguably 6 degrees C warmer than just a few years ago can ice recovery rate break all records.
Not ice recovery, ice recovery RATE.
Since it is warmer, ice should freeze slower, not faster sir.
Brewski, to be a bit more specific your 1/3rd claim comes from here…
“None the less, our calculations and those of Deser et al. (2000) indicate that, even in recent decades, only about one third of the variability in arctic total ice extent and MY ice area (Johannessen et al., 1999) is explained by the NAO index ”
Notice this refers just to the NAO index, ignoring the AO nad LFO.
” The decadal-scale mode associated with the Arctic Oscillation (AO) and a low-frequency oscillation (LFO) with an approximate time scale of 60-80 years, dominate. Both modes were positive in the 1990s, signifying a prolonged phase of anomalously low atmospheric sea level pressure and above normal surface air temperature in the central Arctic. Consistent with an enhanced cyclonic component, the arctic anticyclone was weakened and vorticity of winds became positive. The rapid reduction of arctic ice thickness in the 1990s may be one manifestation of the intense atmosphere and ice cyclonic circulation regime due to the synchronous actions of the AO and LFO. Our results suggest that the decadal AO and multidecadal LFO drive large amplitude natural variability in the Arctic making detection of possible long-term trends induced by greenhouse gas warming most difficult.”
Also Brewski, your explanation of past changes does not begin to cover the number of occurences or the severity of histroic NH sea ice flux.
Brewski, your claims on SH sea ice come from the IPCC AR4. They are flawed. They state…
Antarctic sea ice extent continues to show interannual variability and localised changes but no statistically significant average trends, consistent with the lack of warming reflected in atmospheric temperatures averaged across the region. {3.2, 4.4}”
“Continues to show…no statistically significant average trends”? Continues?
This is what the IPCC Third Assessment Report (TAR), released in 2001, had to say about Antarctic sea ice trends (Chapter 3, p. 125):
“Over the period 1979 to 1996, the Antarctic (Cavalieri et al., 1997; Parkinson et al., 1999) shows a weak increase of 1.3 ± 0.2%/decade.” (BTW, almost a decade later and the trend has only increased)
By anyone’s reckoning, that is a statistically significant increase.
In the IPCC TAR Chapter 3 Executive Summary is this bullet point:
…Satellite data indicate that after a possible initial decrease in the mid-1970s, Antarctic sea-ice extent has stayed almost stable or even increased since 1978.
So, the IPCC AR4’s contention that sea ice trends in Antarctica “continues” to show “no statistically significant average trends” contrasts with what it had concluded in the TAR
Interestingly, the AR4 did not include references to any previous study that showed that Antarctic sea ice trends were increasing in a statistically significant way. The AR4 did not include the TAR references of either Cavalieri et al., 1997, or Parkinson et al., 1999. Nor did the IPCC AR4 include a reference to Zwally et al., 2002,
So just what did the IPCC AR4 authors cite in support of their “assessment” that Antarctic sea ice extent was not increasing in a statistically significant manner? The answer is “an updated version of the analysis done by Comiso (2003).” And just what is “Comiso (2003)”? A book chapter! (Yes Brewski, your idols regularly use books and articles from warmist.
Comiso, J.C., 2003: Large scale characteristics and variability of the global sea ice cover. In: Sea Ice – An Introduction to its Physics, Biology, Chemistry, and Geology [Thomas, D. and G.S. Dieckmann (eds.)]. Blackwell Science, Oxford, UK, pp. 112–142.
And the IPCC didn’t actually even use what was in the book chapter, but instead “an updated version” of the “analysis” that was in the book chapter.
And the IPCC didn’t actually even use what was in the book chapter, but instead “an updated version” of the “analysis” that was in the book chapter.
And from this “updated” analysis, the IPCC reported that the increase in Antarctic sea ice extent was an insignificant 5.6 ± 9.2 × 10³ km2 yr–1 (0.47 ± 0.8% per decade)—a value that was only about one-half of the increase reported in the peer-reviewed literature.
The increase in sea ice in the Antarctic was downplayed in preference to highlighting the observed decline in sea ice in the Arctic.
It is little wonder why, considering that the AR4 found that “Sea ice is projected to shrink in both the Arctic and Antarctic under all SRES scenarios.” Bruski, can you say wrong, Wrong, WRONG?
1999 and 2000 papers? Why not go with something more recent? After all, fully half of the shrinking in the Arctic happened AFTER those two papers were written and before we had volumetric satellites.
David: “Brewski, your claims on SH sea ice come from the IPCC AR4 ”
Absolutely incorrect.
Not a single one of my citations has come from there. All of my references were provided by YOU, WILL or SUNSETTOMEY or were from recent studies.
Tell me again what that word is you want me to say.
Brewski says, “David,
I suggest you read the papers again. There is no mention of ocean currents being responsible for ice loss in the Arctic”
Brewski, Brewski, Brewski, what to do with you my Lad. Think man, think. I told you that considering one atmospheric index as responible for 1/3rd of the ice loss, ( what no error bars in another climate paper determination) was a mistake and not relective of the literature. Because the ONE you considered had to do with wind patterns do you really think it has nothing to do with ocean currents and T? Does the change in ocean T and currents near the equator have anything to do with La Nina / El Nino? I will give you the curtesey of a yes in that department. I will further honor you with the deductive capacity to realize that the combination of several different atmospheric and ocean indexs can combine to affect ice via solar insolation, wind affecting ice movement, wind afffecting ocean currents affecting ice both via faster currents, and warmer currents, wind patterns moving out more ice, etc. An in depth reading of the papers I linked will show you aspects of all of the above. A cursory reading of my post would have prevented your making such an inane comment as the one I quoted to start this post.
Following is one small example from my post which you failed to read, (Caps for manifested poor reading) …” We have shown that sea ice provides memory for the Arctic climate system so that changes in SIM driven by the AO during winter can be felt during the ensuing seasons; that is, THE AO drives dynamic thinning of the sea ice in the eastern Arctic during WINTER, allowing more HEAT to be released FROM THE OCEAN through the thinner ice during spring, and resulting in lower SIC during summer and the liberation of more heat by the freezing of the ice in autumn.”…
Now further, due to the political process which I mentioned, you failed to understand that most all published papers in certain journals must bow to the CAGW god’s, and make a statement or three to support the involvement of CO2. You love to ignore the bulk of such papers and cheery pick these genuflections. However they mentioned at least four primary causes of artic ice loss beyond CAGW induced T.
Please copy for me the simple enginering portion of your paper that shows the energy involved in all these factors to determine that 60% of the Ice loss is due to CAGW.
When you get to the part of warmer air T please subtract the portion of warmer air T that is a result of atmospheric flux not related to CAGW. Further subtract the additional portion of increased air T that is a portion of the natural warming from the little ice age. Please put error bars on all your estimates, with of course a final error bar on your conclusion. When done do not go outside. Your arms will be waving at humingbird speed and you may fly away.
Brewski concernig your sily % quotes on the reduction of NH ice extent, verses the increase in SH ice extent please do an experiment for me. Take a small number like ten and remove twenty percent. Now take a larger number like 50 and increase it by 4 percent. Was the four percent increase five times smaller then the twenty percent decline.
Now put on your deductive thinking cap please.
David,
I am only going by the links you provided me — if you think i am cherry picking the data, then provide other links (at least ones after 2005, but the more recent, the better). In your links, there is no mention of ocean currents contributing to Arctic ice loss, but there are numerous mentions of warming.
Regarding percentages — you are aware that Antarctica cannot melt completely, right? A 3% increase in the FRINGE of sea ice surrounding a CONTINENT is substantially smaller than the entire Arctic which is comprised completely of sea ice and has shrunk by 12% . You have not differentiated between land and sea ice, so your figures above are gibberish.
And that 12% Arctic shrinkage was only in area — its volume has shrunk by 80% and appears to be accelerating (50% of that loss occurred in the past 12 years). Thinner ice means quicker melting which means more time for more solar radiation to be absorbed as heat.
The implications are very scary.
Drewski says:
February 20, 2013 at 4:17 am
David,
I am only going by the links you provided me — if you think i am cherry picking the data, then provide other links (at least ones after 2005, but the more recent, the better). In your links, there is no mention of ocean currents contributing to Arctic ice loss, but there are numerous mentions of warming.”
—————————————————————————-
yes there are, and I even copied one section, read again.
==============================================
Brewski…
“Regarding percentages — you are aware that Antarctica cannot melt completely, right? A 3% increase in the FRINGE of sea ice surrounding a CONTINENT is substantially smaller than the entire Arctic which is comprised completely of sea ice and has shrunk by 12% . You have not differentiated between land and sea ice, so your figures above are gibberish.
====================================================
Dolt, the figures were meant as a concept, The major decrease percentage in the NH is from a much smaller area then the increase in the SH. Yes the sq K decrease is greater then the sq K increase, yet per sqk vs per sq K it is much closer then the percentages indicate. It is beyond lame for you to misunderstand this point. Also it is not a 4% increase in the fringe, it is a 4% increase in the entire sum of the maximum, a much higher number then the main decrease in the NH, a decrease agains a much smaller number. I, as well as this entire thread, has nothing to do with land ice. I never mentioned it, so why did you bring it up.. Since you are so easily confused by percentages do you think 97 % of greenland’s land ice melted?
BTW, still waiting for your engineering quantification of the NH ice loss with error bars assigned to all factors.
So now we are resorting to name calling? You must be a graduate of the Steve Goddard School of Debate.
So David, what are the overall figures for NH and SH snow and ice cover? We should get accurate numbers, don’t you think?
and while we are on the subject of “concepts”, are you aware that oceans absorb more radiation than land and that an open ocean at the top of the world will absorb radiation for 20 hours or more a day during the summer whereas a mountain top or high mesa at the middle latitudes will absorb substantially less?
BTW, you did not provide a link for your AO quote. But if you refer to sunsettommey’s links regarding Dr Meier, you will find him saying the AO has been a negative phase these past few years, and therefore cannot be responsible for accelerating ice distruction.
In regards to the “engineering” (???) data from Dr Julienne Strove, you can try this link: Stroeve, J. C., M. C. Serreze, M. M. Holland, J. E. Kay, J. Maslanik, and A. P. Barrett. 2012. The Arctic’s rapidly shrinking sea ice cover: a research synthesis. Climatic Change 110(3-4): 1,005-1,027, doi:10.1007/s10584-011-0101-1.
There are more Stroeve links if you want (I don’t know which exact study SCIENTIFIC AMERICAN referenced). Keep in mind that you can believe everything Stroeve says because she works for NSIDC and Steve Goddard thinks the NSIDC are the “bees knees”.
Brewski, the SH increase is consistently approaching 400 to 500,000 sq K. This happens against a more direct (lower latitude) sun.
IBrewski says, “n the meantime, will somebody PLEASE tell me how international climate scientists stand to profit from adjusted temperature data? I have only been asking, like, forever.”
Brewski ignored David’s response. “Drewski, furthermore you seam unable to understand the political aspect of scientist going where the money is, as if human nature stops functioning when goverments are involved and only small govt conservatives are influenced by the dark side of human nature. You act as if the idea that group think, confirmation bias, desire for money and power, are incapable of affecting some noble statist goverment controlled research. You ignore that the number one murderer in the past 100 years is “democide” death by Goverment, I really think you should read “Blue Planet in Greeen Shackels to get a clue as to how and why this so called research is being driven. Because for now your complaints about this site only reveal that the only thing exceeding your ignorance is your arrogance.
David: “Scientists go to where the money is”
So where does a Chinese person go or a Kiwi to get their money? And why would their countries fund studies if there was no intrinsic value in them?
No David, what you say makes no sense at all. WHO would pay for people to create a warming narrative rather than a non-warming narrative? And WHY would they pay them? HOW much do they pay them? And HOW do these hundreds of scientists, in all sorts of fields, speaking different languages and living under different forms of government, co-ordinate such an incredible web of deceit?
Until you can answer those questions, all you have a truly crazy conspiracy theory.
Oh, and one last question — HOW did they get the Arctic to melt so fast?
Bye David, et all. Its been educational as always (for you that is).
Back in the 70’s millions of completely unnecessary tonsolectomy procedures were performed, fully approved by the major medical associations. They no longer do these procedure routinely. No conspiracy was involved or required. At the time, it just about the money. You are quite the dickhead Deweksi.
Drewski says:
February 20, 2013 at 5:52 am
David: “Scientists go to where the money is”
=============================================
Brewski resorts to making up quotes. However yes, they do, just like, and in just as high a percentage as most human groups. brewski says group think and confirmation bias, and greed do not exist with govt paid scientis, but only with scientist like the plus 30,000 in the OISM petition.
Brewski, the only reason the Chinese, or the Russians for that matter have supported CAGW (basicallly as far as internal energy policy they have completely ignored it) is for finacial gain.
Basically Brewsjki, only govt scientist support the C in CAGW, and very few of those are atmospheric scientist. Brewski comes here and makes numerous condecending comments to any who disagree with him, and then cries like a baby and runs away when a mirror is held up to him.
BTW, calling you Brewski is a compliment, not an insult. Only an intoxicated beer drunk would make the inane leaps of illogic you have exhibited, otherwise you have no excuse. But please, come back more because your posts only reflect the illogical fervor of a fanatic, and, to a reasonable person, move then to a healthy skepticism of CAGW nuts.
Drewski says:
February 20, 2013 at 5:55 am
Oh, and one last question — HOW did they get the Arctic to melt so fast?
——————————————————————————————————-
Ouch, oh my, what a zinger. lets us see, numerous papers showing exactly the many factors involved, as well as how little we really know and how difficult it is to quantify, and you end with that? How about this ? How, in a dramatically warming world, is it refeezing so fast? (There, by your level of debate I have trumped you) How about this. If, in a world that has not warmed for 15 years, the NH arctic is still getting so much warmer each year, is the rest of the world getting colder?
Link to non warming world causing ever increasing ice loss.
http://wattsupwiththat.com/2013/02/17/global-warming-consensus-looking-more-like-a-myth/
Brewski, currently the negative extent anamoly in the NH is almost exactly canceld by the surplus anomaly in the SH. IOWords global sea ice is at about your 30 year average. On average however the NH negative has recently been about 1.1 million sq K, the recent SH surplus about 550,000 sq K.. Nowhere near your percentage numbers. ? Which hemisphere has a greater affect on the earths energy baslance, the NH very high laditude negative in the NH summer, or the SH surplus at much lower laditudes? How about the respective maximim, virtually unchanged in the NH winter, verses an increase of ice in the SH, even in the SH summer when the sun is 7% closer to the earth, and the ice is at a lower laditude vs the NH summer ice.