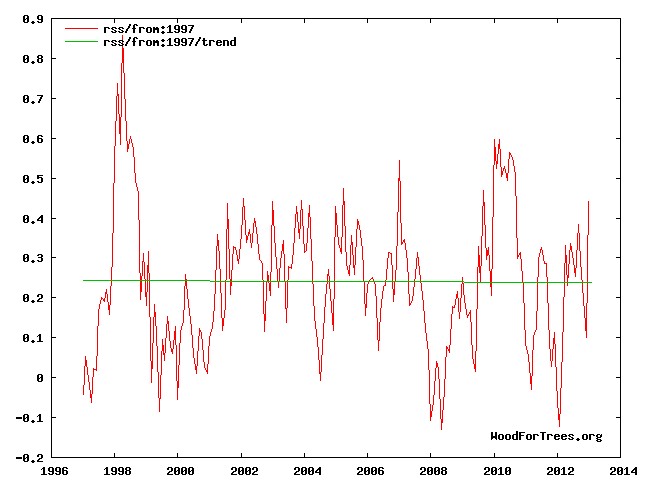
Wood for Trees: Interactive Graphs
A value (slightly) under 2 [degrees Celsius] is certainly looking a whole lot more plausible than anything above 4.5 [degrees].’ Most interestingly, Revkin quotes two of the noisier, anti-sceptic bloggers – Gavin Schmidt and William Connolley – agreeing with this assessment.
These people get billions of dollars a year – to do a terrible job of what a high school intern could do for minimum wage.


That shows Revkin’s brilliance, Quoting the Gav and WC ( Water Closet) Connolley!
If only sceptics were able to figure this out!
You know… I think if you were to put a kink into the end of that green line angling up a bit, you could very easily make the trend show 4.5degC increase. No problem… can I get my grant money now?
You’re not paid for adjusting the trend line but for thinking up all the reasons to hide your data and methods from freedom of information requests. That’s where the real work begins.
Hmm… this is a good point, Mr. Nitschke. I know realize I need much more experience in the art of manipulating data… perhaps I could get a grant for that?
I can’t pretend to have a tiny fraction of Steven’s highly developed skill at picking cherries to support his propositions, but even so a few minutes on the same website produced a graph which looks as alarming as Steven’s appears reassuring
http://www.woodfortrees.org/plot/best/from:1997/to:2010/plot/best/from:1997/to:2010/trend
Best only covers 30% of the planet. I used 100% of the planet, I’m sorry you are an idiot.
If you really want to learn about picking cherries you should visit the NOAA or NASA/GISS websites.
Name a meaningful thing GISS has contributed since Hansen took control of it.
– Besides Hansen’s fuzzy climate dice to hang from his SUV rear view mirror of course. That has to rank as the greatest scientific contribution since Newton’s derivation of the law of gravitation.
You mean other than the lies? 🙂
No Andrew you did just fine in picking cherries. Why did you put the stop point where you did? Oh, and the data set is going on 3 years out of date, anyway. Any reason you didn’t use GISS? slope = 0.00875386 per year Well, heck, that’s not very scary either, is it? No, I’d have to say you’ve exceeded Steve in the cherry picking contest.
That’s high praise, suyts: You’ve made my day
I deny that a 2.2 degree departure from a supposed 14 degree C “equilibrium” actually exists. I think it is actually a departure from previous data set misinterpretations.
So I guess that’s why I’m a “denier.”