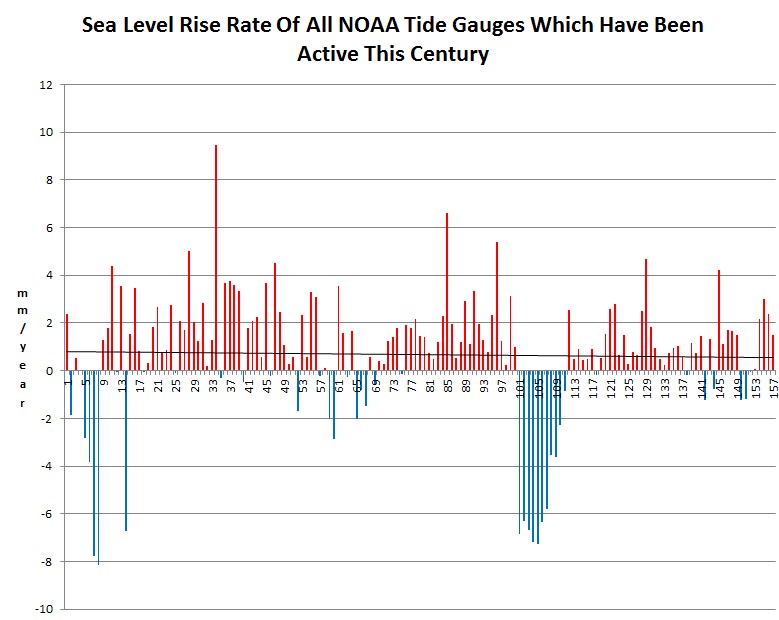
NOAA has 157 tide gauges around the world which have been active this century. The average rise rate has been 0.7 mm/year – which is less than one fourth of what the experts claim.
tidesandcurrents.noaa.gov/sltrends/MSL_global_trendtable.html
However, it is in perfect agreement with the 1990 IPCC report – before they started cheating around the year 2000.


Odd that isn’t it? Of course, no-one at the Colorado University Sea Level Research Group who values his/her salary will bother to investigate why. They are way too busy dreaming up ways of making the rise look bigger (GIA corrrection anyone?).
The tide gauges average around 1.7mm/yr since 1807.
Billy Liar wrote, “The tide gauges average around 1.7mm/yr since 1807.”
No, they don’t. Only after you add model-derived GIA adjustments to the actual measurements can you get to such a big number. The late John Daly explained it:
I got that tide gauge figure from the CU website -my bad!
What’s the trend for the entire set of gauges?
The problem is that if sea level rise rates are cyclical, you run the risk of getting distortions in your trends subject to when the gauges came on line so to speak.
Didn’t they just make another “adjustment” last month?
We’re from the gubment and you have to shows us your guns…..
The only “mistake” is they got caught.
One of the major gun-control efforts in Olympia this session calls for the sheriff to inspect the homes of assault-weapon owners.
http://seattletimes.com/html/localnews/2020373291_westneat17xml.html
It depends on how you average them. I examined 159 NOAA-selected long-term tide gauge, and found that a simple average of the 159 rates or SLR was about 0.6 mm/year, a median was about 1.1 mm/year, and a geographically-weighted average was also about 1.1 mm/year.
http://tinyurl.com/MSLavg2
Right, well data on the NOAA site has already been ‘adjusted’ …. ask them for the original Tide Gage data before they manipulated it UP …
Ok, this is the article I was thinking about that Mr. Watts posted over at WUWT a couple of weeks ago. There was an additional “adjustment” made in January:
http://wattsupwiththat.com/2013/01/24/sea-level-rate-of-rise-shown-to-be-partially-a-product-of-adjustments/
As a casual observer would pick up, the difference between these and the satellite readings are around 500%. Apart from the climate, where else would glaciers disappearing by 2035, no, make that 2035, or losing 40 billion tons of ice a year until someone actually checked and they hadn’t lost any?
If nothing else this proves beyond any doubt there is no decent way to measure the entire vital signs of the planet, and as a result any claims made on such dubious measurements are equally dubious. But sometimes a reading can be so clear even the average Joe Public can grasp it simply, and I believe this is one of those examples. Surely a simple article in the press showing the two lines together, and possibly adding a basic paragraph such as:
“For sea level to rise you require a rise in temperature, to both expand the oceans and melt the land ice in equal measures. In the 21st century there has barely been such a rise, so naturally a corresponding rise in sea level ought not to be possible. Bearing this in mind which of the two readings is likely to be correct?”
Sometimes it can really be so clear only the hard of thinking can miss it. This one needs to get out there in the public arena as well as tucked away here and only read by a handful of those already in the know. Most of us here simply don’t have the resources to spread this material in more than the most basic ways online, which can never reach nearly enough people to make any difference at all. One piece on The News in any country could fix this.
Where’s the edit button? Make that 2350 in the first glacier instance…