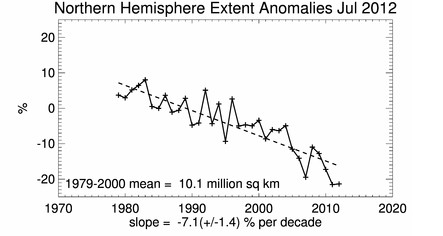
NSIDC wants us to believe that satellite measurements began in 1979.
But satellite records go back much further, and showed ice gain in the 12 years prior to 1979. Paul Homewood found this quote from the CRU Director HH Lamb
Kukla & Kukla (1974) report that the area of snow and ice, integrated over the year across the Northern Hemisphere, was 12% more in 1973 than in 1967, when the first satellite surveys were made.
HH Lamb–“Climate: Present, Past & Future–Vol 2”–In Review–Part II « NOT A LOT OF PEOPLE KNOW THAT
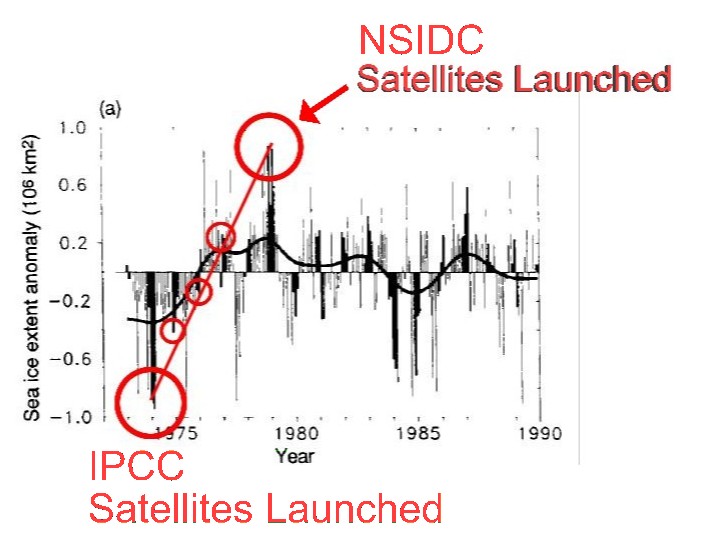
From 1974 to 1979, the IPCC showed another large gain, based on satellite data which NSIDC ignores.

www.ipcc.ch/ipccreports/far/wg_I/ipcc_far_wg_I_full_report.pdf
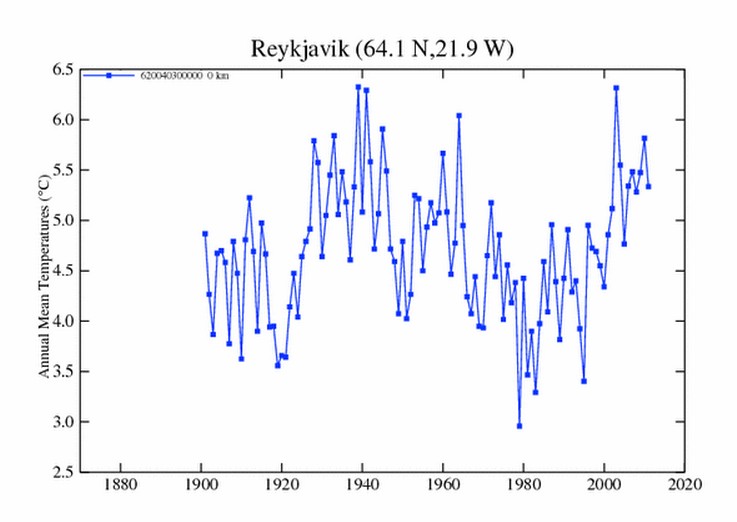
If NSIDC showed the complete satellite data set, people would know that Arctic behavior was cyclical, as we can see in the original GISS temperature graph from Iceland
Data.GISS: GISS Surface Temperature Analysis
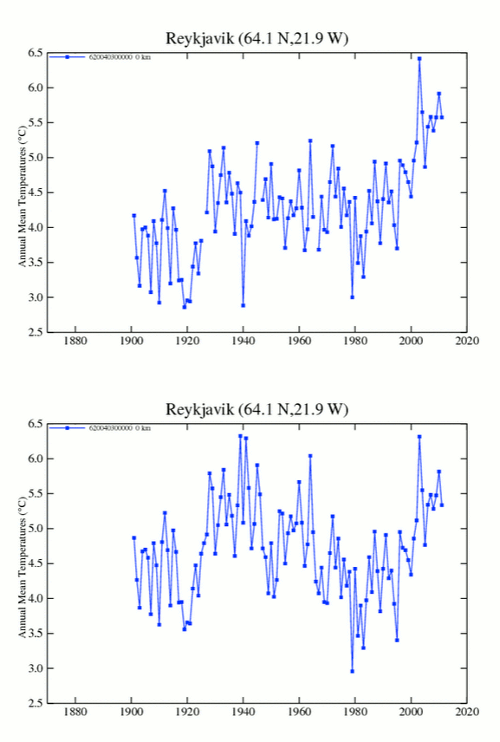
Hansen of course didn’t want us to know about this cyclical behavior, so he got rid of it.
Original version Altered version
You can do that when you are an activist, who also controls the data.


The Piltdown hoax is perhaps the most famous paleoanthropological hoax ever to have been perpetrated. It is prominent for two reasons: the attention paid to the issue of human evolution, and the length of time (more than 40 years) that elapsed from its discovery to its full exposure as a forgery. From Wikipedia, the free encyclopedia
The people that put their faith in a lie choose to believe the lie because they wanted it to be true.
My guess is that a large portion of the people who believe in climate change also believe in evolution and not a creator.
But truth is truth and it will come out in the end. It can also set you free
February 18, 2013 DSC says:
My guess is that a large portion of the people who believe in climate change also believe in evolution and not a creator.
Expand your idea.
My opinion is that both god and anthropogenic warming are creations of an elite for a better control of the majority.
where did all the trolls go?
Your links to Original Vs Tampered 🙂
— Please Note —
Due to technical problems with the GISS webserver, no interactive content, such as creating scientific plots using web forms or searching the publications database, is currently enabled
Thank you James Hansen.
I hope that every one else is as pissed off as me over these guys manipulating data to manipulate us. Sea level, ice cover, snow cover, rainfall, hurricanes, land temperature, ocean temperature. It just goes on and on while the B-Ark folk just buy in and then use leftist argument and propaganda to drive their agenda forward.
Damn them to hell!
Where is Drewski and Dikran…..?
Snicker.
Reblogged this on Climate Ponderings.
Oddly enough, the ESMR data from Nimbus satelites (1972-1976) is still available from the NSIDC website here:
http://nsidc.org/data/nsidc-0009.html
I suspect the reason it isn’t included in the main NSIDC dataset is because there isn’t an overlap period between the ESMR instrument data and that from the SMMI instruments carried on later satelites, so there is no way of cross-calibrating the two datasets. Cavalieri et al (2003) (http://onlinelibrary.wiley.com/doi/10.1029/2003GL018031/abstract) produce a 30 year satelite dataset by using non-satelite data to cross-calibrate and bridge the gap. The results shown in Figure 1(a) of that paper suggest that the variability between 1975 and 1980 was in no way unusual. I suspect the reason the NSIDC don’t include the Nimbus 5 data is simply so that they have a contiguous satelite record with rigorous cross-calibration between instruments based on a period of overlap.
Your suspicions are good enough for me. Thanks for setting the record straight.
Further research puts your suspicion in doubt.
NIMBUS-5 data was collected through 1987, according to http://www.wmo.int/pages/prog/gcos/Publications/gcos-32.pdf
No, the data from NIMBUS-5 ends in 1976, see my response to your comment further down the discussion.
Ha ha ha…..,
It is obvious that you didn’t read the IPCC PDF.
You should rationalizing the inconvenient data.
The IPCC report is actually a bit vague about the exact origins of the data, it says:
“Sea-ice conditions are now reported regularly in marine synoptic observations, as well as by special reconnaissance flights, and coastal radar. Especially importantly, satellite
observations have been used to map sea-ice extent routinely since the early 1970s. The American Navy Joint Ice Center has produced weekly charts which have been digitised by NOAA. These data are summarized in Figure 7.20 which is based on analyses carried out on a 1° latitude x 2.5° longitude grid.”
Which is completely consistent with it being a composite of satelite and marine observations etc. Either way, the nimbus 5 data is freely available for anyone to download if they want to. If you know where there is some satelite data that bridges the gap and allows proper cross-calibration, please do let the NSIDC know about it.
I suspect that the reason is because it wrecks their nice linear graph.
As I said, check out the Cavalierli et al (2003) paper, it clearly does nothing of the sort, the relatively small increase between 1975 and 1979 is in no way unusual in the context of the 30 year record they document.
Dikran,
What gap needs bridging? NIMBUS-5 data was collected through 1987. The only full year missing was 1977. Since the data overlap, direct comparison should suffice to calibrate the data sets.
http://www.wmo.int/pages/prog/gcos/Publications/gcos-32.pdf
Both NIMBUS-5 and SSMI supported 25km spatial resolution. SSMI had a superior time resolution of 1 day vs 3 days for NIMBUS.
I also recommend the NIMBUS-5 User Guide, which is readily available online.
From the report:
“The fractional coverage (or total concentration) of sea ice is less accurately known. Passive microwave data have been used to derive 3-day concentrations of first- and multi-year ice from the Nimbus 5 single channel Electrically Scanning Microwave Radiometer (ESMR) for 1973-76 and for 1978-87 from the Scanning Multifrequency Microwave Radiometer (SMMR).”
ESMR was on Nimbus 5, SMMR was on Nimbus 7. Note the report clearly indicates there was a gap from 1976 to 1978.
Can you give me a page reference to SMMR or SMMI in the nimbus-5 user guide (ESMR is described in section 4, starting on page 59)?
By the way, according to NASA, Nimbus 5 was apparently deactivated on March 29, 1983, so one wonders how it was still collecting data in 1987.
http://science.nasa.gov/missions/nimbus/
Ben wrote “What gap needs bridging? NIMBUS-5 data was collected through 1987. The only full year missing was 1977.”
The gap in 1977 is the gap that needs bridging?
Marsupials must have both eyes on one side of their head, as they do not question any data found on their left side. Obviously a government controlled animal.
Maybe I’m reading it wrong, but it seems the IPCC data chart focuses on a relatively small anomaly over a five year period, but the changes we’ve since then are an order of magnitude greater than that. Said another way, the author focuses on a 2% gain from 1974 to 1979, then says to ignore the 20% decline that has occurred since then.
Perhaps you have no idea what you are talking about.
Given the defensive tone and lack of substance in your reply, it seems I made a valid point.
Reblogged this on Climatism.