
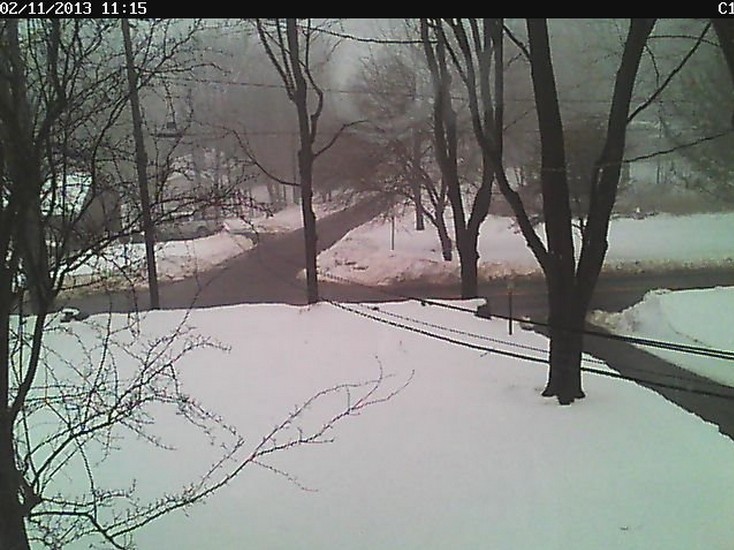
We keep hearing about record snow in Connecticut, but I was there two years ago and the snow was much deeper then. The image below is between Danbury and Newtown, along my bicycle commute. It looks like 18-24 inches of snow. During February 2011, there was closer to 30-36 inches.

Reblogged this on Gds44's Blog.
Well, because snow is caused by global warming and January was a very warm month (©Drewski), it must be a record. QED
/sarc (in case anyone takes the above literally)
That amount is not even a “snow day” in upstate New York.
(snow day = school closed)
When I grew up in the 50’s and 60’s we had snow drifts grow up to the roof 10′-12′ high.
We called that FUN ! We carved out chambers inside the drifts and had a blast on a day off.
Today, to amplify man’s catastrophic on the climate, this inconvenient amount of snow is now declared a disaster.
That’s CAGW religion being played to the max.
Moronic zombie wimps.
In the limit… as we get more snow due to “global warming” the ice will build up and we’ll have an ice age. So they were all right all along. And they were so much smarter than us. And it was all down to rich-white-man-made CO2.
A short list of storms on NESIS going back to only the mid 1950’s.
Keep in mind this list is population weighted so
stormsnor’easters affecting Maine and other low population areas are likely not included, nor are any of the storms going back past the mid 1950’s.40 1956-03-18 1956-03-19 1.87 1 Notable view
11 1958-02-14 1958-02-17 6.25 4 Crippling view
31 1958-03-18 1958-03-21 3.51 2 Significant view
3 1960-03-02 1960-03-05 8.77 4 Crippling view
23 1960-12-11 1960-12-13 4.53 3 Major view
28 1961-01-18 1961-01-21 4.04 3 Major view
5 1961-02-02 1961-02-05 7.06 4 Crippling view
6 1964-01-11 1964-01-14 6.91 4 Crippling view
12 1966-01-29 1966-01-31 5.93 3 Major view
30 1966-12-23 1966-12-25 3.81 2 Significant view
33 1967-02-05 1967-02-08 3.50 2 Significant view
32 1969-02-08 1969-02-10 3.51 2 Significant view
25 1969-02-22 1969-02-28 4.29 3 Major view
9 1969-12-25 1969-12-28 6.29 4 Crippling view
21 1972-02-18 1972-02-20 4.77 3 Major view
8 1978-01-19 1978-01-21 6.53 4 Crippling view
13 1978-02-05 1978-02-07 5.78 3 Major view
22 1979-02-17 1979-02-19 4.77 3 Major view
34 1982-04-06 1982-04-07 3.35 2 Significant view
10 1983-02-10 1983-02-12 6.25 4 Crippling view
16 1987-01-21 1987-01-23 5.40 3 Major view
45 1987-01-25 1987-01-26 1.19 1 Notable view
43 1987-02-22 1987-02-23 1.46 1 Notable view
1 1993-03-12 1993-03-14 13.20 5 Extreme view
17 1994-02-08 1994-02-12 5.39 3 Major view
44 1995-02-02 1995-02-04 1.43 1 Notable view
2 1996-01-06 1996-01-08 11.78 5 Extreme view
38 1997-03-31 1997-04-01 2.29 1 Notable view
36 2000-01-24 2000-01-26 2.52 2 Significant view
37 2000-12-30 2000-12-31 2.37 1 Notable view
4 2003-02-15 2003-02-18 7.50 4 Crippling view
7 2005-01-21 2005-01-24 6.80 4 Crippling view
27 2006-02-12 2006-02-13 4.10 3 Major view
14 2007-02-12 2007-02-15 5.63 3 Major view
35 2007-03-15 2007-03-18 2.54 2 Significant view
42 2009-03-01 2009-03-03 1.59 1 Notable view
29 2009-12-18 2009-12-21 3.99 2 Significant view
24 2010-02-04 2010-02-07 4.38 3 Major view
26 2010-02-09 2010-02-11 4.10 3 Major view
15 2010-02-23 2010-02-28 5.46 3 Major view
20* 2010-12-24 2010-12-28 4.92 3 Major view
18* 2011-01-09 2011-01-13 5.31 3 Major view
39* 2011-01-26 2011-01-27 2.17 1 Notable view
19* 2011-02-01 2011-02-03 5.30 3 Major view
41* 2011-10-29 2011-10-30 1.75 1 Notable view
http://www.ncdc.noaa.gov/snow-and-ice/rsi/nesis
An addendum.
Should the latest nor’easter crack the top ten (which it should come close to due to how well it compares to the January 2005 blizzard) it will be the first top ten storm in 8 years. Right about on schedule…