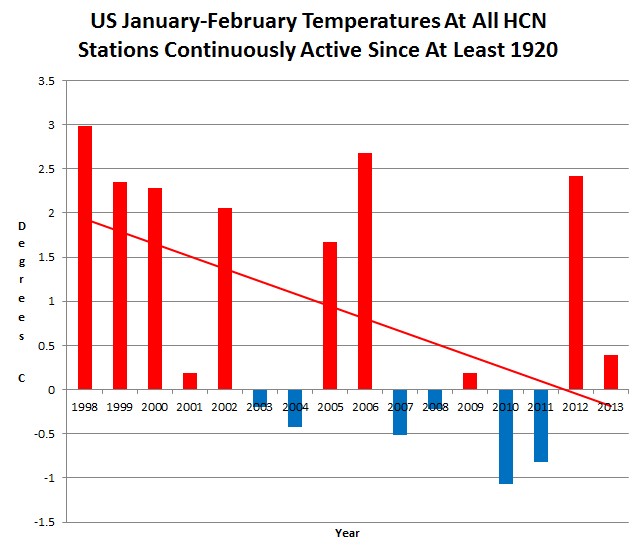
Huffington Post calls this sharp cooling trend a warming trend
Disrupting the Borg is expensive and time consuming!
Google Search
-
Recent Posts
- Gaslighting 1924
- “Why Do You Resist?”
- Climate Attribution Model
- Fact Checking NASA
- Fact Checking Grok
- Fact Checking The New York Times
- New Visitech Features
- Ice-Free Arctic By 2014
- Debt-Free US Treasury Forecast
- Analyzing Big City Crime (Part 2)
- Analyzing Big City Crime
- UK Migration Caused By Global Warming
- Climate Attribution In Greece
- “Brown: ’50 days to save world'”
- The Catastrophic Influence of Bovine Methane Emissions on Extraterrestrial Climate Patterns
- Posting On X
- Seventeen Years Of Fun
- The Importance Of Good Tools
- Temperature Shifts At Blue Hill, MA
- CO2²
- Time Of Observation Bias
- Climate Scamming For Profit
- Climate Scamming For Profit
- Back To The Future
- “records going back to 1961”
Recent Comments
- Bob G on Gaslighting 1924
- Bob G on Gaslighting 1924
- arn on Gaslighting 1924
- conrad ziefle on Gaslighting 1924
- Gordon Vigurs on Gaslighting 1924
- conrad ziefle on Gaslighting 1924
- Robertvd on Gaslighting 1924
- conrad ziefle on Gaslighting 1924
- arn on Gaslighting 1924
- Gordon Vigurs on Gaslighting 1924


Beautiful! Turn the chart upside down and you’ll be made an honorary member of the climate fraudsters club.
Huff Post’s beginning point in their “warming trend,” is 1970. Yes, it warmed (during the winters, also) from the 1970’s until the mid-late 1990’s. However, then we’ve cooled.
Using Pachuari’s agreed to 17 yrs now of no additional global warming, as the guide, pull the plot and trend line at NOAA’s (new revised web site, BTW), from 1995-2012 for the winter months (Dec-Feb) and we have a cooling trend.
http://www.ncdc.noaa.gov/cag/time-series
For the past 17 years, NOAA’s current data shows a cooling trend for the lower 48.
What a bogus post at Huffpo (well, no big surprise there).
Actually, it’s been declining since 1990, so nearly 23 years. I guess Huff Poo should be congratulated on actually providing data; a shame they missed out the fact that more than the last half of the period winter temps in the 48 have been in decline.
Jct: And I made a bet with Green Party of Canada candidate Adriana Magnutto that the hockey stick blade of exponential growth had broken off in 1998 and she bet it’s still rising even as we now keep reading that it stopped rising in 1998, 15 years ago. Looks pretty good for my bet.
Next time you see her, ask her what trend she was hoping to see since the post-1970’s freeze? Flat? Cooling further?
Or just do what I like to do, ask her if we should still be the same as the 1960’s-1970’s.
For some reason they always duck that direct question, like Mosher does.
Don’t do this. I’m as big of a skeptic as anyone. But that regression line is completely bogus. Almost “hockey stick” bogus. Please don’t become as silly as the alarmists.
I think that is Steve’s point. Alarmists are silly.
Mathematically however it looks valid.
But he’s making the point in a way that is silly. We don’t need to be silly to win the global warming argument. It’s probably not as bad as the hockey stick argument, but I don’t want my side to use bogus science at all. Guess I’m selfish like that.
And assuming that you are into math or science, you should quickly be able to see that there is no trend in that chart at all. At least not a linear one. Correlation <.5. That's about the same as no correlation.
to the guy above me .5 correlation is HUGE
It may be sign that slowly but surely the Solar Lower Flux and SSN is beginning to induce those slightly cooler temps during winters. I wonder what the situation is in Europe and Russia Asia etc?
I have the impressionthat winter in Russi/Siberia seem to be slightly warmer from the COLA pages anyway,