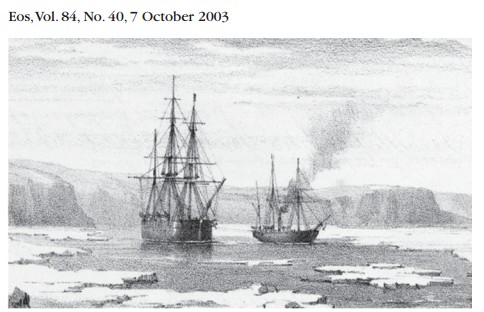
The extent of summer sea ice during the 19th century, insofar as it is shown in patterns of navigability inferred from ship tracks, the direct observations of explorers, and a number of native accounts, is remarkably similar to present ice climatology. A chart of northern Canada (Figure 2) shows the routes followed by discovery expeditions and their wintering locations between 1818 and 1859, and also displays the frequency that sea ice has occurred during the recent 30-year reference period 1971–2000. It is perhaps surprising that most of the Northwest Passage was navigated during the 19th century, with expedition ships coming within 150 km of completing the passage on a number of occasions. Most significant is that even in years that were recognized as unfavorable at the time, ships were still able to reach locations that would be consistent with the worst ice conditions that have occurred during the modern reference period. Of 33 expedition or supply ships bound for the western part of Lancaster Sound between 1819 and 1859, only two failed due to unfavorable ice conditions.
Disrupting the Borg is expensive and time consuming!
Google Search
-
Recent Posts
- Gaslighting 1924
- “Why Do You Resist?”
- Climate Attribution Model
- Fact Checking NASA
- Fact Checking Grok
- Fact Checking The New York Times
- New Visitech Features
- Ice-Free Arctic By 2014
- Debt-Free US Treasury Forecast
- Analyzing Big City Crime (Part 2)
- Analyzing Big City Crime
- UK Migration Caused By Global Warming
- Climate Attribution In Greece
- “Brown: ’50 days to save world'”
- The Catastrophic Influence of Bovine Methane Emissions on Extraterrestrial Climate Patterns
- Posting On X
- Seventeen Years Of Fun
- The Importance Of Good Tools
- Temperature Shifts At Blue Hill, MA
- CO2²
- Time Of Observation Bias
- Climate Scamming For Profit
- Climate Scamming For Profit
- Back To The Future
- “records going back to 1961”
Recent Comments
- Bob G on Gaslighting 1924
- Bob G on Gaslighting 1924
- conrad ziefle on Gaslighting 1924
- Bob G on Gaslighting 1924
- Bob G on Gaslighting 1924
- arn on Gaslighting 1924
- conrad ziefle on Gaslighting 1924
- Gordon Vigurs on Gaslighting 1924
- conrad ziefle on Gaslighting 1924
- Robertvd on Gaslighting 1924


You would also think that modern ships are much better constructed and have much more power.
Modern Navigation! Today, the captain of a ship knows exactly where he is and where every iceburg is via satillite navigation. That is the BIG difference.
Excellent find! So why haven’t we heard more about this 2003 article?? Another nail in the (C)AGW coffin.
The coffin is shut already, now we need to bury it fast!:-)
Sweetheart the science is settled. The only folks that don’t believe in global warming are the KOCH-SUCKERS” like you. The people that support the Koch brothers and the fossil fuel industry. You need a good BITCH-SLAP, for your kids sake. Here it is, no charge. http://www.youtube.com/watch?v=1EyM7jpE8Pw.
Global warming is an excuse for hate filled assholes like you to pretend that you don’t need psychiatric help.
This is the sort of argument that makes you think the person writing it is a nut job.
No Will it doesn’t make me think that, but you maybe right. Me thinking is, and it is just a possibility, that this is some elderly person that was feed the bs and got their hands on the new tech.
Yep! It’s confrimed, it is an old jackoff! 😆
It’s a perfect storm of stupidity, though. First we got the focus on ‘belief’ (not evidence), a conspiracy theory (Koch Brothers + fossil fuel industry) and then he notes that if you don’t believe what he believes you must be evil. All in 3 sentences.
😆
Here’s a map from 1906.
http://explorenorth.com/library/maps/franzjosefland1906.htm
That 1906 map is rather neat that they have depth soundings so far North. Avg ice edges are defined with the faint squiggly lines.
1971 map
http://media.maps.com/magellan/Images/NGC_Oct_1971a_c.jpg
http://www.maps.com/map.aspx?cid=1529,1537&pid=15903
Found this 1983 map of the Arctic. Shows the avg min extent as it was known then. It was smaller than the avg min extent used today.
http://www.maps.com/map.aspx?cid=636&pid=15610
Steve, doesn’t the extent shown in the 1971 map resemble the lower extents you have shown with that old IPCC graph?
Seems to me ice extents back before 1979 resembled those of the last decade or so. 1971 looks real close to 2005 and other similar years. And to show a 1983 map with avg min extents a little lower than today means the ice wasn’t always as robust as one thinks in recent history.
It’s not “global warming” anymore, it’s “climate change.” Cheesh.. don’t you guys know anything?!?
Oh, that’s just because the evidence was piling up against them… follow the money…
Any updates on this article, or hasn’t anything changed since 2003? You might perhaps want to contact author James E. Overland, who recently was in the news with his latest paper A sea ice free summer Arctic within 30 years?. Good luck, Steve. 🙂
Gawd you people are pathetic.
No answer, as usual. 😀
“Experts” have been predicting an ice-free Arctic for over 100 years. Their ability to predict the future is as valid as Homer Simpson’s
So they believe that the start of the next ice age is within 30 years?
Hey Neven, would you send me zero dollars, and by that of course I mean 1 million dollars?
The awful papers continue. Ice Free = 1 million km^2.
If you want an ice-free Arctic talk to NSIDC about what happened multiple times between 4,000-10,000 years ago.
Oh no, what happened before might happen again!
The prediction always extends out to 10-30 years, as soon as the previous prediction fails. That’s the *point* dummy. 🙂