
PIOMAS (a key metric for climate alarmists) says that the average Arctic sea ice thickness is about 1.5 metres.
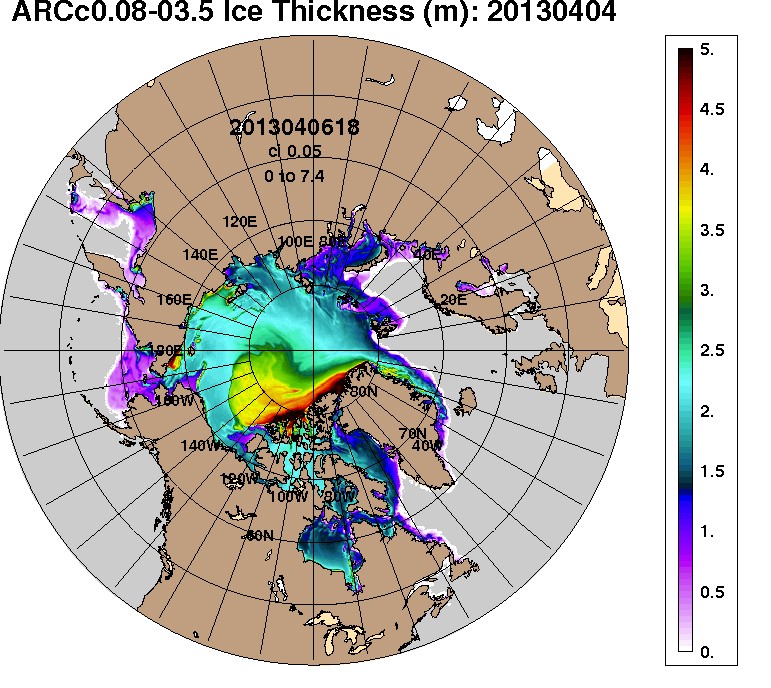
The US Navy shows that the entire Arctic Basin has 2-5 metre thick ice.
PIOMAS (a key metric for climate alarmists) says that the average Arctic sea ice thickness is about 1.5 metres.
The US Navy shows that the entire Arctic Basin has 2-5 metre thick ice.

Interesting how the clergy of alarmist move the goal post.
For example, when a record low or high is not meet for thier agenda, they move to “Average” as the benchmark.
Ice is now lower than average instead of record low.
You would think someone could measure the actual thickness of the ice. That should not be that hard to do.
I think Serrez and/or Julliene should go up there and measure the holes caused by CO2 to show just how rotten all that ice is.
The validation runs for the Navy model showed that it overstated ice thickness significantly, by 1m or more in places (obviously by less than this in thinner areas though).
Data from the current mass balance buoys agrees that the Navy is overstating thickness
http://imb.crrel.usace.army.mil/newdata.htm
2013D Beaufort 04/13 – present 141cm (Navy says 2-2.5m)
2013A C.Archipelago 01/13 – present 128cm (Navy says 1-1.5m)
2012M Fram Strait 08/12 – present 202cm (Navy says 2.5-3.5m)
2012L Beaufort Sea 08/12 – present 336cm (Navy says ~3.5-4m)
2012J Laptev Sea 08/12 – present 155cm (Navy says 2-2.5m)
2012H Beaufort Sea 08/12 – present 219cm (Navy says 3.5-4m)
2012G Central Arctic 08/12 – present 209cm (Navy says 2-3m)
2011M Central Arctic 09/11 – present 240cm (Navy says 3-4m)
11M, 12J, 12L and 12M are in multi-year ice, the others are in first year ice. It’s striking that only one of even the multi-year buoys shows ice over 2.5 metres thick.
Thanks for validating that almost all of the buoys show ice thicker than 1.5 metres.
PIOMAS is a model, and models never fail, so observations are incorrect.
pjie2: Did you note that by clicking each bouy, you can get ice depth at deployment, and ice depth now?
Almost all show ice thickness has increased since the bouys were deployed.
Did you note that I listed the current ice thickness for each buoy? Clearly not.
Did you note that you did not list ice thickness at deployment? Obviously not.
I did see that. I also saw by clicking on each, that they also gave ice thickness at deployment, which was 2011, 2012 or 2013. Nearly all show an increase in ice thickness since deployment.
Did you see that? Clearly not.
Les, did you notice that deployment was invariably in August/September (end of the melt season), current conditions are April (end of the freezing season)…clearly not…ice is thicker at the end of a winter than the end of a summer, gosh who knew. One would think that only a fool would try to claim that represents long term ice gain, but hey clearly not.
So did anyone look at the upward looking sonar data from 2004-2010 at the bottom of this page.
http://imb.crrel.usace.army.mil/thickdat.htm
The ice thickness varies quite a bit. Those bouys are just pin pricks in the pack. Only one bouy in the archive was placed over one of these thicker areas. It was placed on a Second Year Ridge, and they could only drill down 8m and that wasn’t deep enough to hit water.
http://imb.crrel.usace.army.mil/sheba5.htm
The GIF in the post is just an estimated mean, obviously, and doesn’t truly reflect the highly variable thicknesses that exist across the pack.
T.O.O bad?
T.O.O. soon to tell.
As I have repeatedly said, Arctic ice cover in late July and August will bear out the truth and the importance of ice volume over ice extent as the best metric of winter ice health.
We shall all just have to wait and see.