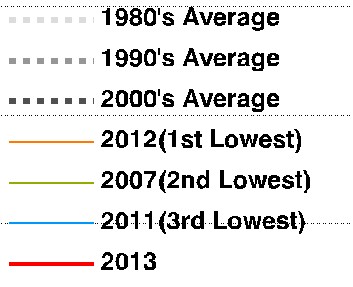
The animation below shows the changes from JAXA V1 to V2. Note how the 1980s minimum hardly changed at all, but more recent minimums have been increasingly reduced over time, particularly the last four years where they have made large reductions in ice extent. Hansen must be proud.
Disrupting the Borg is expensive and time consuming!
Google Search
-
Recent Posts
- Gaslighting 1924
- “Why Do You Resist?”
- Climate Attribution Model
- Fact Checking NASA
- Fact Checking Grok
- Fact Checking The New York Times
- New Visitech Features
- Ice-Free Arctic By 2014
- Debt-Free US Treasury Forecast
- Analyzing Big City Crime (Part 2)
- Analyzing Big City Crime
- UK Migration Caused By Global Warming
- Climate Attribution In Greece
- “Brown: ’50 days to save world'”
- The Catastrophic Influence of Bovine Methane Emissions on Extraterrestrial Climate Patterns
- Posting On X
- Seventeen Years Of Fun
- The Importance Of Good Tools
- Temperature Shifts At Blue Hill, MA
- CO2²
- Time Of Observation Bias
- Climate Scamming For Profit
- Climate Scamming For Profit
- Back To The Future
- “records going back to 1961”
Recent Comments
- conrad ziefle on Gaslighting 1924
- arn on Gaslighting 1924
- Gordon Vigurs on Gaslighting 1924
- Bob G on Climate Attribution Model
- conrad ziefle on Climate Attribution Model
- Ohio Cyclist on Climate Attribution Model
- Bob G on Climate Attribution Model
- Bob G on Climate Attribution Model
- Bob G on Fact Checking NASA
- arn on Climate Attribution Model


At least they didn’t monkey around with the predictable endpoint of 2013, which tracks the 2008 “recovery” (not shown) with precision, and for the same (non-CO2 related & affected) reason!!!
new and improved….to show less ice
When they initiated the coastal algorithm, of course it’s going to show less ice…
They must have “adjusted” the past again to show that.
…so they lied again
The 1980s average max change is the big problem.
The article “North American moose dying at alarming rates” says “Winters have grown substantially shorter across much of the moose’s range”, “a longer fall with less snow”, and “when the temperature rises above 23 degrees Fahrenheit in winter, as has happened more often in recent years”. The link is: http://www.lasvegassun.com/news/2013/oct/24/north-american-moose-dying-alarming-rates-biologis/
Reblogged this on Edonurwayup's Blog.