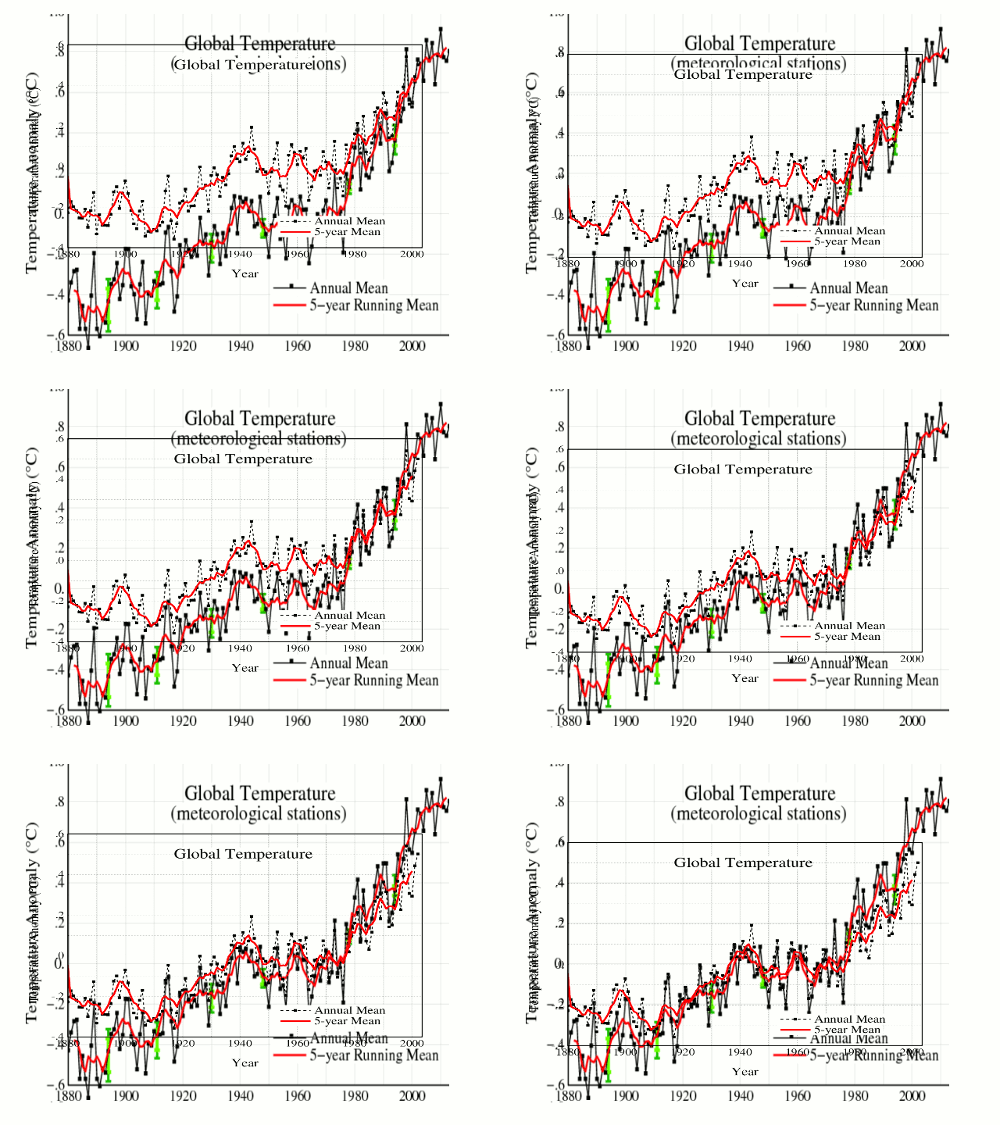
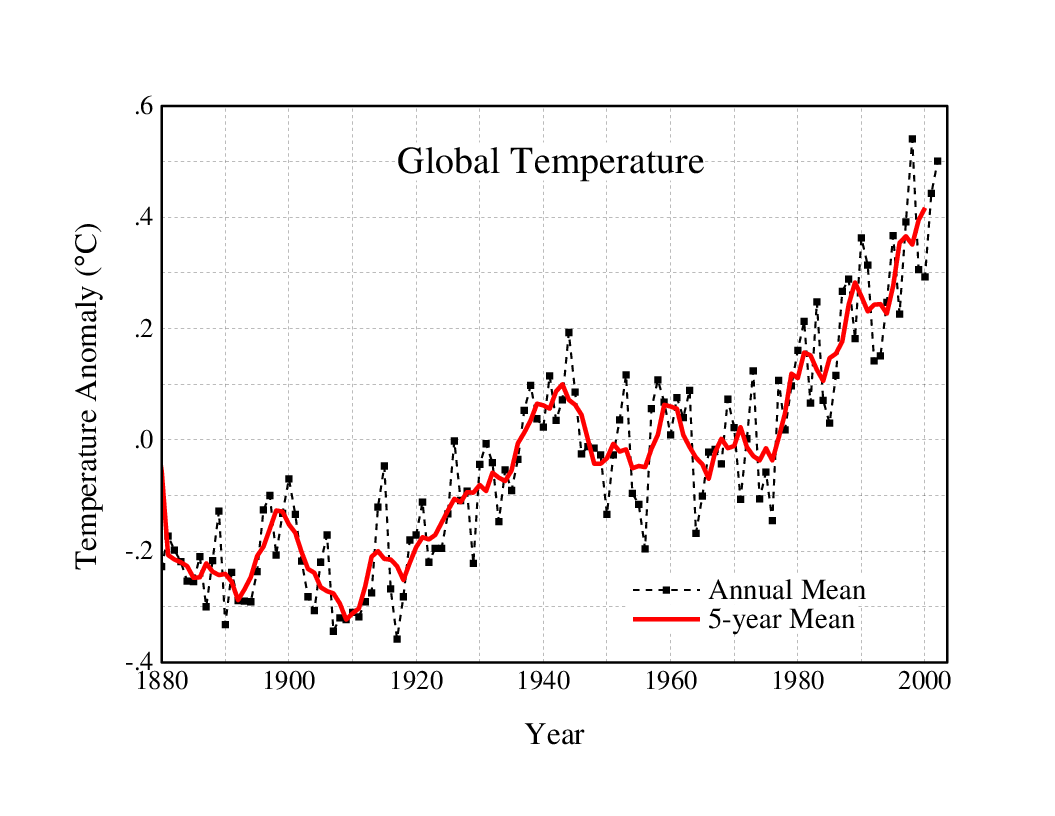
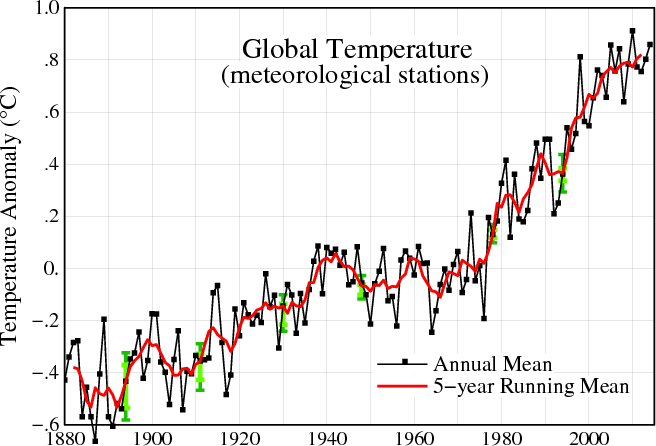
GISS uses an insidious trick to hide their data tampering. They cool pre-1963 years, and warm post-1963 years. This makes their data tampering look much less severe than it actually is. A better visualization is to normalize the graphs to the most recent common data, and show the total magnitude of the tampering. The animation below shows that.
2003 version
http://www.giss.nasa.gov/data/update/gistemp/graphs/Fig.Anew.ps
2014 version


My thermometer just reached 0ºF! It was below zero all night. Global warming! 🙂
My Thermometer just reached 37ºF. Yesterday evening it was 54ºF… OH my goodness an Ice Age Cometh!!!
Is that before the iceman.
http://media.cagle.com/205/2014/01/27/143546_600.jpg
I’ve been obsessed with Global Warming for years, and I save old data. So I have GISS global data from 2009 and I compared it to the latest 2015 edition. Interesting results.
For example, 1901/1 was -0.2 and now 191/1 is -0.33 for a change of -0.13
Plotted out blue for downjusting and red for upjusting it looks like this:
http://oi57.tinypic.com/2r38h9v.jpg
Perhaps it would make sense to examine the reasons for adjustments, rather than to assume that people are using an “insidious trick” and “data tampering”.
The reasons are quite clear. They are pushing an agenda which isn’t supported by science
http://www.woodfortrees.org/graph/rss/from:1996.5/plot/rss/from:1996.5/trend
You obviously have NOT read this blog. We have “examine the reasons for adjustments” and found the reasons are out right LIES!
Now go do your homework like I did.
You can start with the LIE that a change from Liquid in Glass thermometers (Lig) to thermistors needed the older Lig data high temperature data adjusted DOWN.
On error:
And http://pugshoes.blogspot.se/2010/10/metrology.html
There’s only one reason to lower past temperatures…since nature has refused to warm the earth for eighteen years, lowering past temps. will make it appear as if it is warming.
Fraud on a massive scale.
Can you go find the official reasons and methods? (including program sources)
Good luck with that here, but I am afraid you are wasting your time. The actual data, which is NOT subject of a massive conspiracy everywhere, doesn’t support the ideological fixations here. Assuredly they will cite the flawed RSS outlier (why IS it different from UAH? … and from every other measurement set?) .
http://www.drroyspencer.com/2011/07/on-the-divergence-between-the-uah-and-rss-global-temperature-records/
They will ignore BEST, or any other corroborating work, ignore the significant work done to improve our information, and they will ignore the oceans. I am convinced that Goddard himself misunderstands the statistical effects of corrections to data given posts on correlation that I have seen here. <> Doesn’t matter really.
Doesn’t matter what data, logic or science you bring… a conspiracy theorist can always counter it. They need no REAL reason why the scientists would do this, but they can make up theories that challenge reality by the dozen. Best to put the site, and its denizens, on permanent ignore and just leave.
…and no, I’m not hanging around to see how this goes. 😉
ciao
BJ
Typical drive by troll with no real information to add.
“…and no, I’m not hanging around to see how this goes.”
Don’t let the door hit you in the ass on the way out.
Then talk to Trausti Jónsson, a senior climatologist at the Icelandic Met Office, who wrote Paul Homewood in 2012, ““The GHCN “corrections” are grossly in error in the case of Reykjavik”. GISS made Reykjavik’s warm 1940 period disappear by reducing the real temperatures by up to nearly 2 degrees. Jónsson wrote that he was unaware that NOAA made corrections to Iceland’s historical data, did not agree with them, and refused to modify Iceland’s own historical temperature records.
So whether you think GISS had a “REAL reason” why they would do it or not, they did. The Icelandic Met Office is only one example.
Good luck with that here, but I am afraid you are wasting your time. The actual data doesn’t support the ideological fixations BJ Driveby Chip has.
He has driven off …
Steve Case– thank you for the effort, so lazy people like me can steal your work
(but I will give you credit)
Some how I missed this headline yesterday.
Odds are 2014 was not the warmest on record according to NOAA and NASA
pic.twitter.com/Y1AfZQ2lxc
Speaking of Defrauding the Public, Jo Nova had an interesting update on Loony Lewandowsky who claimed ‘deniers’ believed al sorts of crazy things. (Hence Obummer calling us Flat Earthers.)
The used toilet paper on Loony Lew’s face should be spread to UWA, The Uni of Bristol, PLOS, and the Royal Society if we had any honest media.
Lewandowsky peer reviewed study includes someone 32,757 years old Bookmark this one folks for the next time someone pulls out loony Lew or his buddy the Crook (SkS)
Oh, and just to make even funnier Jose Duarte says this about Gavin Schmidt:
The situation for warmists is dire. Since they fundamentally believe rising CO2 causes rising temperatures, and CO2 continues to rise, temperatures cannot be seen to decrease. They can talk around a plateau, calling it a “pause”, but they absolutely must prevent a decline. First they got rid of the high temperatures in the 1930s, then 1998 went, now 2014 is the new record. Yet future years must surpass this last one, in order to hide a decline. Future cooling is not an option.
The original 2003 disappeared: http://www.giss.nasa.gov/data/update/gistemp/graphs/Fig.Anew.ps
Of course. Hansen always hides their tracks
Surely it is somewhere out there. You can’t just delete thing from the web once it has been posted. Everything gets captured once it is public.
It’s great to see that CNN, HuffPost, ABC, NBC, CBS and the rest are reporting these baseline shifts and continuing to keep the public so well informed 😉
Reblogged this on Globalcooler's Weblog.