Obama Will Return Us To The Cool Years Of The 1920s

Benevolent dictator Barack Obama has seized control of the global atmosphere, and will return CO2 to 310 PPM – like it was during NASA’s cold years of the 1920’s

Fig.A2 (3)

This is indeed a worthy goal.

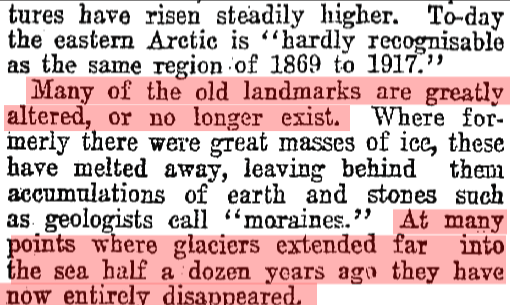
The Arctic was rapidly melting due to a radical change of climate, and unheard of high temperatures.

ScreenHunter_6310 Jan. 23 08.15

ScreenHunter_6317 Jan. 23 08.40

16 Apr 1923 – THE NORTH POLE CAUSES OF CHANGE OF CLIMATE.

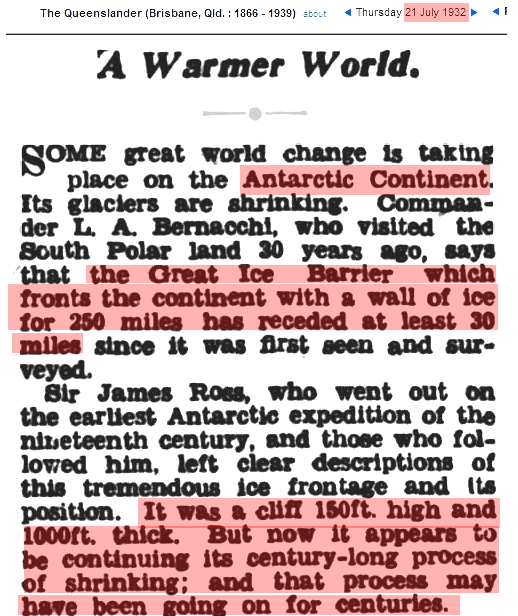
The Antarctic was also rapidly melting

ScreenHunter_6313 Jan. 23 08.23

21 Jul 1932 – A Warmer World.

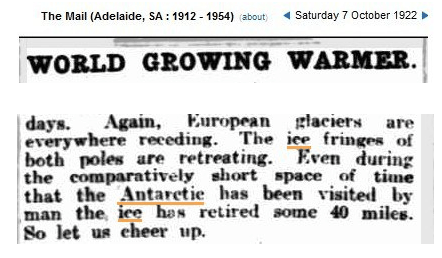
Glaciers were disappearing everywhere

ScreenHunter_6314 Jan. 23 08.25

07 Oct 1922 – WORLD GROWING WARMER.

The climate was awful

ScreenHunter_6315 Jan. 23 08.29

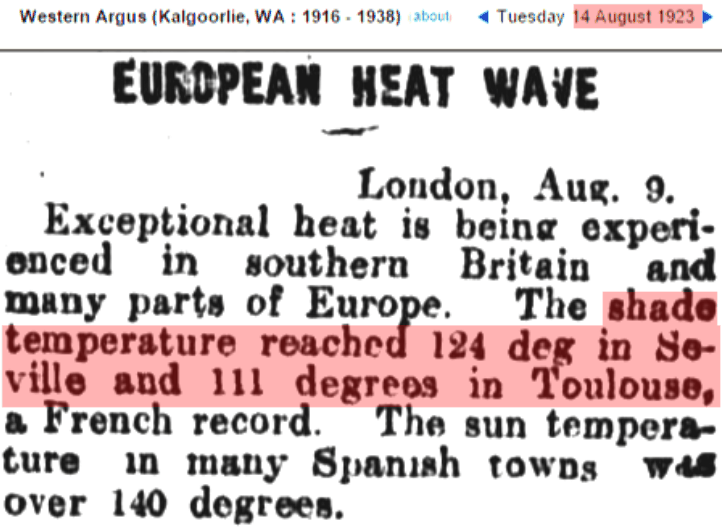
It was 124 degrees in Spain

ScreenHunter_6307 Jan. 23 07.59

14 Aug 1923 – EUROPEAN HEAT WAVE London, Aug. 9.

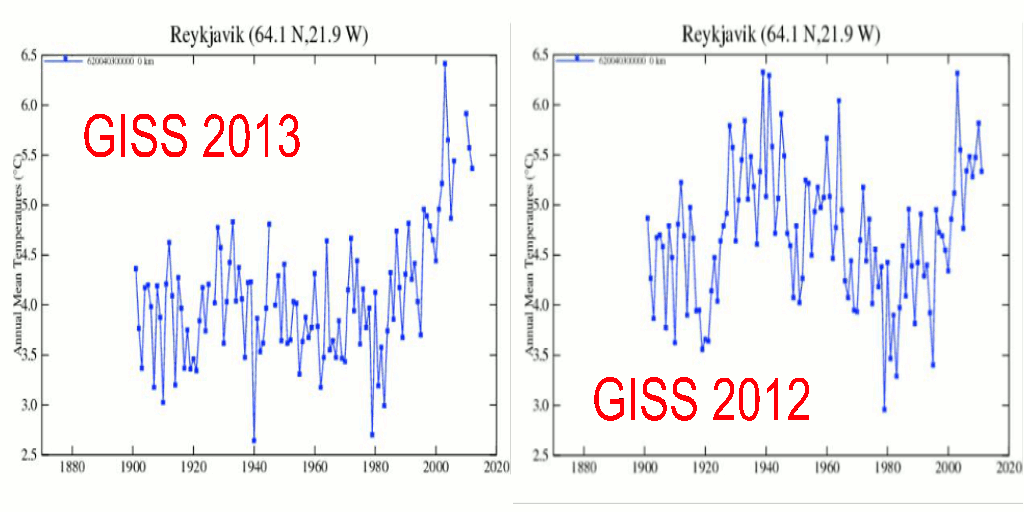
Returning to the 1920’s is indeed a worthy goal, though it might be simpler and cheaper to just stop paying NCDC and Gavin to tamper with the thermometer data.

ReykjavikGISS2012-2013

About Tony Heller

Just having fun
This entry was posted in Uncategorized. Bookmark the permalink.

17 Responses to Obama Will Return Us To The Cool Years Of The 1920s

  1. gator69 says:

    Magical Misery Tour

    Gas up, gas up for the Misery Tour
    Step right this way.

    Line up, line up for the Misery Tour
    Put up, put up with the Misery Tour.
    Set up (for some real inflation)
    Fed up with the Misery Tour
    Foul up (this free and great nation)
    Wake up to the Misery Tour.
    The Magical Misery Tour is waiting to take all your pay
    (Here in the US of A).

    Line up, line up it’s the Misery Tour
    Fed up, fed up with the Misery Tour.
    Pay up (we’ve got insatiable greed)
    Set up by the Misery Tour
    Held up (wealth extraction guaranteed)
    Wake up to the Misery Tour.
    Obama’s Misery Tour is taking your money away

    (Our bus aint no Chevrolet)

    The misery dip.

    Aaaaaaaaagghhh!!!!!!!!!!
    The Magical Misery Tour.

    Line up, line up for the Misery Tour
    Set up (then comes hyper inflation)
    Set up by the Misery Tour
    Pay up (we call it confiscation)
    Pay up for the Misery Tour.
    The Magical Misery Tour is coming to take hope away
    (Hoping will soon go away)
    The Magical Misery Tour is dying to take all your pay
    (Dying to make you obey)
    Rape you today.

    I’d like to say thank you on behalf of the pragmatists and skeptics and I hope we’ve passed the audition.

    https://www.youtube.com/watch?v=1DbnEbIDgzs

  2. emsnews says:

    This is why they erased the previous warmer eras of course. Because there was rampant warming minus CO2 hikes.

  3. philjourdan says:

    No wonder the icelandics are pissed all to hell.

  4. Eliza says:

    OT But if GOP Americans are even remotely considering Romney as a candidate for the next Election, they deserve him. They are even more ignorant than the democrats.. Unbelievable.This cretino now believes in AGW

  5. _Jim says:

    WHERE THE HELL did the warming for the 20’s through the 40’s go in JUST one year!!!!!

    What the hell is this!!!!!

    NASA GISS is effing ‘gas-lighting’ us all …

  6. gofer says:

    “Scientist” at Daily Caller explains why temps are adjusted and thinks Steve has a agenda: Things must be getting bad in the doomsday community. Steve doesn’t run his work through the scientific community so it can be rejected or altered………..apparently Steve is making too many waves. Since this individual is posting for “public outreach”, just helping him out.

    “The data was corrected to account for a difference in measurement methodology. Back before a standard practice was in place, many measurements were taken at midnight and noon. Now, they’re taken at the highest and lowest temperatures of the day. There is plenty of information out there from trustworthy sources like politifact, who exist to correct controversial claims. [1] The man using the pseudonym Steven Goddard has an agenda. Anyone who publishes “science” directly to the public without first going through the academic sphere should be highly questioned.

    There are actually quite a few different temperature records out there (GISS, CRUT, Berkley) that all use different methodologies and data sets to arrive at roughly the same conclusion. The Berkley Earth project was started with the assumption that the previous temperature record was faulty. They compiled 8x as much data as NASA of different sorts and arrived at almost the exact same temperature profile. Those NASA scientists (many of my colleagues) know what they’re doing![2]

    Question 2)

    Datasets are often kept in messy files, just like our computers. I personally cannot speak to the various data used to construct the global temperature history, but I’d imagine it to be a clustf*ck. Not too long ago, I was working on using HDTV towers to aid in satellite navigation outside of GPS orbits. In order to get data on broadcasting tower properties, I had use the FCC database center. [3] As it happens, the database only contains complete data for about 30% of the high-power towers in their database. The vast majority of the towers had some data, but a bunch of empty spaces.

    Should I immediately jump to the conclusion that there is a massive conspiracy going on? Probably not. The same goes with the datasets that NASA uses. Again, be VERY skeptical of what unpublished folks with an agenda (Steven Goddard) have to say. Don’t take their conclusions as the end-all-be-all.

    Any more questions? Again, my specialty deals with satellites and satellite measurements (sorry, not temperature satellites). I can talk about how the poles are melting away at an INCREDIBLE and accelerating rate. I can also talk about Sea Level rise. One of my colleagues was even a lead author on the Sea Level rise chapter of the IPCC AR5. He even has one of his famous graphs on the equally-biased-as-Goddard website WattsUpWithThat. C’mon, learn something today! I’m here to educated, not to troll. I like to think of my posting as educational public outreach.

    [1] http://www.politifact.com/pund
    [2] http://berkeleyearth.org
    [3] http://wireless2.fcc.gov/UlsAp

    • Neal S says:

      The first explanation does not pass the sniff test. Unless the change in methodology was between the 20’s and the 40’s, how does this account for the dramatic shift in the reporting of those temps between GISS 2012 and GISS 2013? And even if this were the case, why has it taken this long to realize it? Either they were incompetent then, or lying then, or are incompetent now or lying now, or some combination of ALL of those. And it has to be at least one if not more of those. This internal inconsistency makes it impossible to believe anything that comes out of GISS any more.

    • Anyone who publishes “science” directly to the public …

      Directly? Not through a priest? Radicalis! Periculosus!

      • gofer says:

        Ah but Mr Smith, the Phd student at Boulder says,”if anything, working for the government REMOVES any incentive to bias your research. You are on salary, after all.”

        • Gail Combs says:

          Mr Smith the PhD student is all wet.

          Hasn’t he ever heard of not having your contract renewed?

          Ask Dr Gray or Dr Salby about what happens if the Uni is not happy with your results.

    • Gail Combs says:

      Been there done that but I will repeat:

      In the article Understanding Adjustments to Temperature Data.

      Zeke Hausfeather states:

      ……Nearly every single station in the network in the network has been moved at least once over the last century, with many having 3 or more distinct moves. Most of the stations have changed from using liquid in glass thermometers (LiG) in Stevenson screens to electronic Minimum Maximum Temperature Systems (MMTS) or Automated Surface Observing Systems (ASOS). Observation times have shifted from afternoon to morning at most stations since 1960, as part of an effort by the National Weather Service to improve precipitation measurements.

      All of these changes introduce (non-random) systemic biases into the network. For example, MMTS sensors tend to read maximum daily temperatures about 0.5 C colder than LiG thermometers at the same location. There is a very obvious cooling bias in the record associated with the conversion of most co-op stations from LiG to MMTS in the 1980s…

      ……………………………

      What is NEVER mentioned is the original system had two separate thermometers. One mercury for the high temperature and an alcohol thermometer for the minimum temperature. These were sent to the coop stations by the US Weather Service along with a well written instruction manual in 1882. The manual describes the specification for building a Stevenson screen and how it should be located. Calibration, methods for reading….

      For the maximum thermometer they state:

      …When a maximum thermometer is not read for several hours after the highest temperature has occurred and the air in the meantime has cooled down 15° or 20°, the highest temperature indicated by the top of the detached thread of mercury may be too low by half a degree from the contraction of the thread….

      That would indicate the max thermometer should be read just after the heat of the day and any adjustment for reading at the wrong time of day should RAISE the maximum temperature not lower it as has been done by the ClimAstrologists.

      A second book
      Meteorology: A Text-book on the Weather, the Causes of Its Changes, and Weather Forecasting By Willis Isbister Milham 1918 mentions the Six thermometer and says the accuracy was not good so the US weather service used the two thermometers mentioned above.

      He also states there are 180 to 200 ‘regular weather stations’ ordinarily in the larger cities, 3600 to 4000 coop stations and 300 to 500 special stations.

      The observations of temperature taken at a regular station are the real air temperature at 8am and 8pm, the highest and lowest temperatures of the preceding 12 hours, and a continuous thermograph record…. (Richard Freres thermograph) ….these instruments are located in a thermometer shelter which is ordinarily placed 6 to 10 feet above the roof of some high building in the city. At a Cooperative station the highest and lowest temperatures during a day are determined, and also the reading of the maximum thermometer just after it has been set. The purpose of taking this observation is to make sure that the maximum thermometer has been set and also to give the real air temperature at the time of observation…..

      If a good continuous thermograph record for at least twenty years is available, the normal hourly temperatures for the various days of the year can be computed….

      ….the average temperature for a day is found by averaging the 24 values of hourly temperature observed during that day…

      I thought it quite interesting that Willis Isbister Milham was talking about 20 years of hourly data in 1918.

      On page 68 he says a thermometer in a Stevenson screen is correct to within a half degree. It is most in error on still days, hot or cold. “In both cases the indications of the sheltered thermometers are two conservative.”

      on Page 70
      “The Ventilated thermometer which is the best instrument for determining the real air temperature, was invented by Assman at Berlin in 1887…will determine the real air temperature correctly to a tenth of a degree.”

      Another book The American Meteorological Journal, Volume 8 from 1891 also mentions the Richard Freres thermograph

      An Account of the “Leste,” or hot wind of Madeira
      by H. Coupland Taylor, M. D. F. R. Met. Soc.

      Being an invalid, I must beg for the indulgence of the Society for the irregular times of obervation and the other defects the Fellows may discover in the following paper.

      I must first state that my insturments are placed in a regulation Stevenson screen…. The maximum and minimum thermometers are by Casella, and duly tested at Kew….I also have had in use for some months a self-registering hair hygrometer by MM. Richard Freres of Paris, and likewise a thermograph by the same makers but no very severe Leste has occurred since I had them.

      This “Leste” is a very dry and parching wind and sometimes very hot,….

      The people at the turn of the 19th century were real scientists. When was the last time you ever heard mention of the measurement error when the headlines scream The Warmist Year EVAH! …..by 0.02C

    • Gail Combs says:

      So that is one temperature data adjustment done in the WRONG direction for up to 0.5F

      Zeke Hausfeather states:

      ……. For example, MMTS sensors tend to read maximum daily temperatures about 0.5 C colder than LiG thermometers at the same location. There is a very obvious cooling bias in the record associated with the conversion of most co-op stations from LiG to MMTS in the 1980s…

      Seems German meteorologist Klaus Hager didn’t take the ClimAstrologists word for it and did the actual tests:

      ….The last couple of days I posted on an 8.5 year side-by-side test conducted by German veteran meteorologist Klaus Hager, see here and here. The test compared traditional glass mercury thermometer measurement stations to the new electronic measurement system, whose implementation began at Germany’s approximately 2000 surface stations in 1985 and concluded around 2000.

      Hager’s test results showed that on average the new electronic measurement system produced warmer temperature readings: a whopping mean of 0.93°C warmer. The question is: Is this detectable in Germany’s temperature dataset? Do we see a temperature jump during the time the new “warmer” system was put into operation (1985 – 2000)? The answer is: absolutely!

      So that is another 0.93°C that the ClimAstrologists adjust in the wrong direction.

      And that isn’t getting into the dropped thermometers.

      https://diggingintheclay.files.wordpress.com/2010/04/canadadt.png

    • Gail Combs says:

      And then the Russians tore into the Climastrologists…
      From the Ria Novosti agency,

      On Tuesday, the Moscow-based Institute of Economic Analysis (IEA) issued a report claiming that the Hadley Center for Climate Change based at the headquarters of the British Meteorological Office in Exeter (Devon, England) had probably tampered with Russian-climate data.

      The IEA believes that Russian meteorological-station data did not substantiate the anthropogenic global-warming theory. Analysts say Russian meteorological stations cover most of the country’s territory, and that the Hadley Center had used data submitted by only 25% of such stations in its reports. Over 40% of Russian territory was not included in global-temperature calculations for some other reasons, rather than the lack of meteorological stations and observations.

      The data of stations located in areas not listed in the Hadley Climate Research Unit Temperature UK (HadCRUT) survey often does not show any substantial warming in the late 20th century and the early 21st century.

      The HadCRUT database includes specific stations providing incomplete data and highlighting the global-warming process, rather than stations facilitating uninterrupted observations.

      On the whole, climatologists use the incomplete findings of meteorological stations far more often than those providing complete observations.

      IEA analysts say climatologists use the data of stations located in large populated centers that are influenced by the urban-warming effect more frequently than the correct data of remote stations.

      The scale of global warming was exaggerated due to temperature distortions for Russia accounting for 12.5% of the world’s land mass. The IEA said it was necessary to recalculate all global-temperature data in order to assess the scale of such exaggeration….

      And the Climategate e-mail — March 2004, from Phil Jones to Michael Mann showing this was done deliberately.

      Recently rejected two papers (one for JGR and for GRL) from people saying CRU has it
      wrong over Siberia. Went to town in both reviews, hopefully successfully. If either
      appears
      I will be very surprised, but you never know with GRL.
      Cheers
      Phil

    • Gail Combs says:

      And finally Steve Goddard shows:
      US Temperatures Show No Correlation With CO2
      https://stevengoddard.files.wordpress.com/2014/10/screenhunter_3332-oct-05-05-19.gif

      BUT US Temperature ADJUSTMENTS have a near perfect Correlation With CO2
      https://stevengoddard.files.wordpress.com/2014/10/screenhunter_3233-oct-01-22-59.gif

      Yes, I can see why Steve is a threat to the grant feeding trough of the ClimAstrologists.

  7. sabretoothed says:

    http://wattsupwiththat.com/2010/08/21/worlds-worst-heatwave-the-marble-bar-heatwave-1923-24/

    The world record for the longest sequence of days above 100°Fahrenheit (or 37.8° on the Celsius scale) is held by Marble Bar in the inland Pilbara district of Western Australia. The temperature, measured under standard exposure conditions, reached or exceeded the century mark every day from 31 October 1923 to 7 April 1924, a total of 160 days.

    WOW NASA’s coldest time AMAZING!!!!!!!!!!!!!!!!

Leave a Reply

Your email address will not be published. Required fields are marked *