Disrupting the Borg is expensive and time consuming!
Google Search
-
Recent Posts
- Gaslighting 1924
- “Why Do You Resist?”
- Climate Attribution Model
- Fact Checking NASA
- Fact Checking Grok
- Fact Checking The New York Times
- New Visitech Features
- Ice-Free Arctic By 2014
- Debt-Free US Treasury Forecast
- Analyzing Big City Crime (Part 2)
- Analyzing Big City Crime
- UK Migration Caused By Global Warming
- Climate Attribution In Greece
- “Brown: ’50 days to save world'”
- The Catastrophic Influence of Bovine Methane Emissions on Extraterrestrial Climate Patterns
- Posting On X
- Seventeen Years Of Fun
- The Importance Of Good Tools
- Temperature Shifts At Blue Hill, MA
- CO2²
- Time Of Observation Bias
- Climate Scamming For Profit
- Climate Scamming For Profit
- Back To The Future
- “records going back to 1961”
Recent Comments
- Bob G on Gaslighting 1924
- John Francis on “Why Do You Resist?”
- conrad ziefle on Gaslighting 1924
- Bob G on Gaslighting 1924
- Bob G on Gaslighting 1924
- Bob G on Gaslighting 1924
- conrad ziefle on Gaslighting 1924
- Bob G on Gaslighting 1924
- Bob G on Gaslighting 1924
- arn on Gaslighting 1924
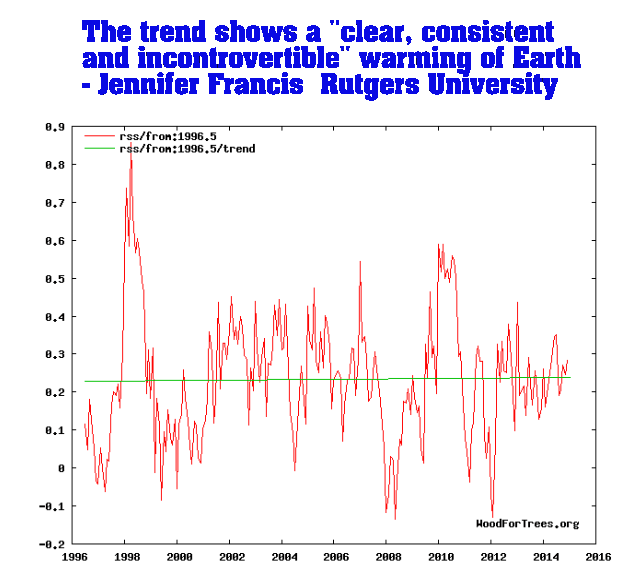
The Trend Is A “Clear, Consistent And Incontrovertible” Increase In A Few Fraudsters Ramping Up Their Lies About The Climate
This entry was posted in Uncategorized. Bookmark the permalink.


For seventy years (1945 – 2015), world leaders used federal research grant funds to guide government science toward the goals of UN’s Agenda 21.
This unethical practice was invisible until the goals of UN Agenda 21 were finally published in 1972.
If we are lucky Washington DC will get buried under five feet of ‘Global Warming’ next week as Buffalo NY did in November.
In order for the IPCC’s projections/a> to come true rate of temperature rise needs to dramatically accelerate. It’s not.
If you take the last 30 years of data from GISTEMP, You will find that from 1985 to 2000 the rate of temperature rise was 0.2 deg/decade and from 2000 to 2015 the rate has been .1 deg/decade. That works out to a negative acceleration of minus -0.01deg/decade².
Don’t worry Steve, Gavin is doing his best to accelerate the non-warming. !
http://woodfortrees.org/plot/hadcrut4gl/from:2013/plot/rss/from:2013/plot/hadcrut4gl/from:2013/trend/plot/rss/from:2013/trend/plot/uah/from:2013/plot/uah/from:2013/trend/plot/gistemp/from:2013/plot/gistemp/from:2013/trend
Well, the link works but it should have looked like this:
IPCC’s projections
It’s a pity the chart doesn’t include the lowest projection of all – the “commitment”, which assumed zero growth in greenhouse gasses. The most accurate projection so far.
If you would put the error bars (or grey area) you can show that the data are really so noisy that no conclusions can be drawn.
I can draw the conclusion that there isn’t any acceleration sufficient enough to result in the ridiculous IPCC projections. Click on my link
They should at least refer to them as tamperatures, not temperatures.