
Arctic sea ice continues to track 2006, the year with the highest summer minimum of the past decade.
Temperatures near the North Pole are running far below normal again this summer.
Temperatures are forecast to remain very cold in the Beaufort Sea

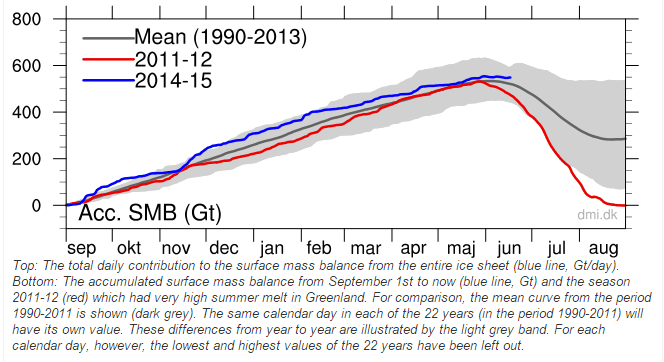
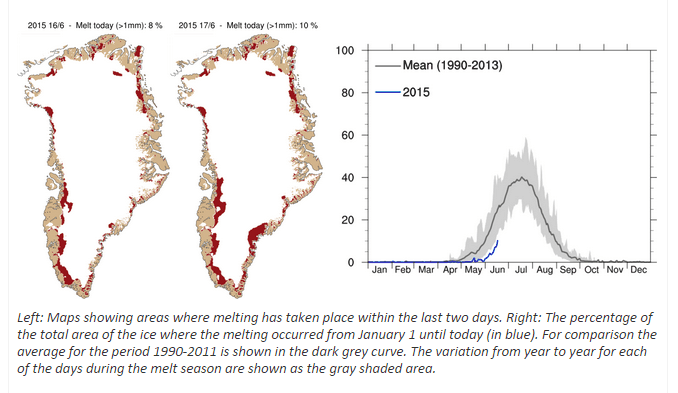
Greenland’s surface has gained more than half a trillion tons of ice, it is still snowing, and less than eight possible weeks left to the melt season.
Greenland is having their slowest melt season on record.
Greenland’s capital still has winter snow on the ground.

The Arctic melting story has completely collapsed, so government experts simply lie about it now to keep their scam alive.

You forgot Antarctica 😛
From Pys.org
Without fossil fuels and Mann-made CO2, how could we have warmed up enough to melt those enormous glaciers?
Reblogged this on Gunny G: "IF" EVER THE TRUTH BE KNOWN………. BLOGGING BAD!.
“Completely collapsed” due to some weather? LOL that is funny, report back when melting is at 1990’s levels again 🙂
Or maybe at levels during the LIA..
Would that make you happy ???
IDIOT !!!
What would make me happy is a mile high glacier sitting on Chicago, Boston and NYC.
You forgot D.C. Personally, I’d be thrilled to see 1600 Pennsylvania Avenue under a mile of ice.
I would prefer to see them under the rule of law, as set forth by our founders.
You STILL don’t get it do you, you ignorant little twerp.
High summer Arctic ice is NOT the normal for the last 10,000 years. The normal would have been sea ice free summers, and easy Arctic navigation, to the benefit of all far northern countries. Not any more.. those good, prosperous days are well behind them.
The current level of Arctic sea ice is only normal for the LIA and the very short climb out of what was the COLDEST period in the whole of the Holocene.
Unfortunately, Arctic sea ice levels are climbing again in the last few years after partially becoming navigable.
This is NOT good for the world, particularly considering the massive amounts of sea ice in the Antarctic.
The world is still perilously close to another ice age.
You better just hope that it doesn’t arrive in you life time.
Ok so please post links to peer-reviewed studies that argue we’re currently just rebounding from LIA, which BTW only started a few centuries ago.
Meanwhile here’s an analysis of proxies indicating that the current Arctic sea ice summer extent is at it’s lowest for at least 1450 years, i.e. for a period way longer than the LIA:
http://www.nature.com/nature/journal/v479/n7374/abs/nature10581.html
No reason to get angry, just post the studies (or shut up).
”Prof Peter Wadhams, of Cambridge University, said the ice that forms over the Arctic sea is shrinking so rapidly that it could vanish altogether in as little as four years’ time.”
Cows could fly as well. Lol.
Jim Steele, head of a research station (You can contact and ask for the URLs of the actual studies at http://landscapesandcycles.net/ ) said on August 29, 2013
“Retreating Alaskan Glacier Reveals Remains Of Medieval Forest”
“….Park Service personnel recently discovered evidence of a buried forest dating back to at least 1170 AD high in the Forelands near the current glacier’s edge….”
Holocene temperature history at the western Greenland Ice Sheet margin reconstructed from lake sediments – Axford et al. (2012)
Lesson from the past: present insolation minimum holds potential for glacial inception (2007)
Abrupt Temperature Changes in the Western Mediterranean over the Past 250,000 Years
Current Arctic Sea Ice is More Extensive than Most of the past 9000 Years
A peer-reviewed paper published in the Canadian Journal of Earth Sciences finds that Arctic sea ice extent at the end of the 20th century was more extensive than most of the past 9000 years. The paper also finds that Arctic sea ice extent was on a declining trend over the past 9000 years, but recovered beginning sometime over the past 1000 years and has been relatively stable and extensive since.
Although it seems like a day doesn’t go by without an alarmist headline or blog posting obsessing over the daily Arctic sea ice statistics (and never about Antarctic sea ice extent which reached a record high this year), this paleo-climate perspective takes all the wind out of alarmist sails. Satellite assessment of sea ice conditions is only available beginning in 1979 (around the time the global cooling scare ended), with only sparse data available prior to 1979. The alarmists at the NRDC fraudulently claim in a new video that due to ” climate destruction,” Arctic sea ice reached the lowest in history in 2010 (actually the low since 1979 was in 2007 and 2010 was the 3rd or 4th lowest depending on the source). Probably wouldn’t bring in many donations if they mentioned the truth: the 21st century has some of the highest annual Arctic sea ice extents over the past 9000 years.
The figure below comes from the paper, but has been modified with the red notations and rotated clockwise. The number of months the sea ice extent is greater than 50% is shown on the y axis. Time is on the x axis starting over 9000 years ago up to the present. Warming periods are shown in gray with the Roman and Medieval warming periods (RWP/MWP) notated, the Minoan Warming Period about 5000 years ago, and another other older unnamed warming period. The last dot on the graph is the end of the 20th century and represents one of the highest annual sea ice extents.
Holocene fluctuations in Arctic sea-ice cover: dinocyst-based reconstructions for the eastern Chukchi Sea Canadian Journal of Earth Sciences, 45: 1377-1397
Authors: J.L. McKay, A. de Vernal, C. Hillaire-Marcel, C. Not, L. Polyak, and D. Darby
Abstract: Cores from site HLY0501-05 on the Alaskan margin in the eastern Chukchi Sea were analyzed for their geochemical (organic carbon, d13Corg, Corg/N, and CaCO3) and palynological (dinocyst, pollen, and spores) content to document oceanographic changes during the Holocene. The chronology of the cores was established from 210Pb dating of near- surface sediments and 14C dating of bivalve shells. The sediments span the last 9000 years, possibly more, but with a gap between the base of the trigger core and top of the piston core. Sedimentation rates are very high (*156 cm/ka), allowing analyses with a decadal to centennial resolution. The data suggest a shift from a dominantly terrigenous to marine input from the early to late Holocene. Dinocyst assemblages are characterized by relatively high concentrations (600–7200 cysts/cm3) and high species diversity, allowing the use of the modern analogue technique for the reconstruction of sea-ice cover, summer temperature, and salinity. Results indicate a decrease in sea-ice cover and a corresponding, albeit much smaller, increase in summer sea-surface temperature over the past 9000 years. Superimposed on these long-term trends are millennial-scale fluctuations characterized by periods of low sea-ice and high sea-surface temperature and salinity that appear quasi-cyclic with a frequency of about one every 2500–3000 years. The results of this study clearly show that sea-ice cover in the western Arctic Ocean has varied throughout the Holocene. More importantly, there have been times when sea-ice cover was less extensive than at the end of the 20th century.
Arctic summer sea surface temperatures are also currently lower than much of the past 9000 years.
Arctic Ice Loss Has Been Much Worse Historically
The meltdown underway in the Arctic is remarkable, but an international team of beachcombers has uncovered evidence it’s been much worse before.
Driftwood from Canada, Alaska and Siberia picked up on the planet’s most northern beaches indicates that, for several thousand of the past 10,000 years, there was at least 50 per cent less sea ice in the Arctic than there is today, the team reports Friday in the journal Science.
Open water used to crash ashore on Greenland’s northern beaches, which are now locked in ice year-round, say the scientists, who have weathered fierce summer snowstorms on their beachcombing expeditions.
While the researchers say they expect global warming will eventually make the Arctic sea ice disappear, they say the dire warnings about its imminent demise have been overstated.
“The bad news is that there is a clear connection between temperature and the amount of sea ice,” says lead author Svend Funder, at the University of Copenhagen, adding there is “no doubt” continued global warming will reduce Arctic summer sea ice.
“The good news is that even with a reduction to less than 50 per cent of the current amount of sea ice, the ice will not reach a point of no return,” says Funder, who has headed several treks to the inhospitable north coast of Greenland to get a better read on how the ice waxes and wanes.
Satellite records showing how the ice grows and retreats only go back to early 1979 — and suggest 2011 could see another record ice loss.
But the Greenland north coast provides valuable long-term perspective, with the driftwood and sand on the beaches recording ice trends that go back 10,000 years.
Between 8,000 to 5,000 years ago, when the temperatures were warmer than today, Funder and his colleagues report, there was probably less than 50 per cent of the summer 2007 ice coverage, which was the lowest in 30-year satellite record.
During the pre-historic warm period, they say, the southern limit of Greenland’s year-round sea ice was about 1,000 kilometres north of where it is today.
The data was gathered on beaches, which are now locked behind ice that lasts all year on the northern coast of Greenland. But ridges along the beaches, dating back thousands of years, show that waves used to break along the coast, indicating plenty of open water, report the scientists, who mapped beach ridges extending 500 kilometres along the coast.
The driftwood is even more telling, revealing when the ice returned and how it moved around.
Funder said the wood had to have been carried in on ice. That’s because it would take several years for wood to make it across the Arctic Ocean and “driftwood would not be able to stay afloat for that long.”
The most direct route is from central Siberia, with larch from the Siberian forest arriving in Greenland after a trip on the ice lasting two to five years.
“The voyage form North America is more precarious,” the researchers say, because the wood had to go from the Beaufort Sea and then make a detour around past Siberia, increasing the travel time to six years or more. (Ice travels around the Arctic counter-clockwise.)
Spruce from Canada and Alaska started showing up on the Greenland beaches about 6,000 years ago, and increased with the climatic cooling that then occurred, Funder said via email.
He said spruce makes up about 40 per cent of all the driftwood, “which at first glance is surprising” considering that the travel route is much longer than from Siberia.
“The reason is probably that with its longer residence time in the Arctic Ocean the American ice grows to be very thick and therefore a more robust wood-carrier than the thinner Siberian ice with its much shorter passage,” he said.
Funder said the results support the idea that sea ice could regenerate even if it’s reduced to half its current amount.
WHERE THE DEBATE REALLY IS:
1.) Most scientists on both sides of the debate agree with the Milankovitch cycles. Gerard Roe did a recent modification that took care of the objections SEE: http://motls.blogspot.com/2010/07/in-defense-of-milankovitch-by-gerard.html and http://culter.colorado.edu/~saelias/glacier.html
2. ) Most scientists on both sides agree we are near the half precession point and solar energy at the earth surface in high summer at 65N is declining.
3.) The sticking point is what minimum level of solar energy in summer at 65N is the threshold for the descent into an ice age.
4.) The fourth point that no one is talking about is how unstable the weather becomes near that threshold. The general point of view is the climate has two stable states, warm and cold. That is it is bi-stable like a sail boat that is right side up or upside down. When it is in the in-between state the climate can swing wildly. This means approaching that threshold point can be as bad as crossing it. Note the steep declines in temperature in the geologic record.
http://climateclash.com/files/2010/10/Jouzel-science2007-crop640.jpg
I can not post a link to the original because of wordpress censorship, but a very interesting graph of Northern Hemisphere Solar Insolation vs the Vostok and Greenland Ice core temps is at Annoying Lead Time Graph along with a graph of the Milancovitch Orbital Parameters and resultant W/m2 N.H. over several interglacials.
The earth is certainly not going to warm catastrophically for another 65 kyr.
Will the earth descend into glaciation or be a ‘‘double precession cycle’’ interglacial? That is still being argued although the above paper carries a lot of weight. A newer paper from the fall of 2012 a href=”http://www.clim-past.net/8/1473/2012/cp-8-1473-2012.pdf”>Can we predict the duration of an interglacial? agrees and gives the calculated solar insolation values @ 65N on June 22 for several glacial inceptions:
Current value – insolation = 479W m?2 (from that paper)
MIS 7e – insolation = 463 W m?2,
MIS 11c – insolation = 466 W m?2,
MIS 13a – insolation = 500 W m?2,
MIS 15a – insolation = 480 W m?2,
MIS 17 – insolation = 477 W m?2
The Holocene is 11,700 years so the earth came out of Ice age when the insolation was 522.5 Wm?2 (12,000 years ago) The depth of the last ice age was 464 Wm?2 (23,000 years ago) so the insolation changed 58.5Wm?2 (@ 60°N June insolation from NOAA )
The ClimAstrologists are saying that solar insolation change is going to be trumped by CO2 forcing when the entire CO2 forcing is 32 to 44 W m–2 [cf., Reid, 1997]. and all but 5 to 6 W m–2 of that forcing occurs in the first 200 ppm CO2 (modtran) A CO2 concentration where plants barely survive.
Some how 60 W m–2 trumps 6 W m–2 in my book and that is using THEIR numbers!
Gator,
If you can get your hands on one of those old Danish ice-extent-maps from August., 1938, it will be some handy proof there were years of low ice-extent before 1978. Maybe they didn’t have satellites back then, but they did have fishermen sailing north, and they reported open water north of Norway well past Franz Josef Land and past 80° latitude towards the Pole.
Leaving everything else aside, giving that the article to which you link is dated from 2011, the concept of “current” must mean something different than you think it means.
roflmao.
I assume you have read Gator’s and Gail’s posts.
Temperature proxies clearly show that the Arctic is just a tiny bump above the temperatures of the LIA, the coldest period of the Holocene, and nowhere near as warm as the previous 90%+ of the Holocene.
Even the Nature study by rabid alarmists says there was less ice 1450 years ago.
(I suspect they have their dates wrong as they continue to try to get rid of the MWP, ala Mann)
But their study is still confirmation that low Arctic sea ice is the NORM for the Holocene.
That is a fact you need to get into your brain-washed skull.
I suggest you admit that fact, (or STFU, yourself) 😉
Furthermore, IF this study is correct and not just yet another attempt to blank out the MWP, (they certainly trying on the rabid alarmista anthropogenic rant)…. then IF there was not a drop in sea ice levels during the much warmer MWP, it shows that temperature is not the main driver of Arctic sea ice levels.
Maybe the return to Holocene normals of Arctic sea ice is NOT down to human’s not warming the planet.
“Here we use a network of high-resolution terrestrial proxies from the circum-Arctic region to reconstruct past extents of summer sea ice, and show that—although extensive uncertainties remain, especially before the sixteenth century—both the duration and magnitude of the current decline in sea ice seem to be unprecedented for the past 1,450 years.”
Aside from the extensive uncertainties, that seems like solid, irrefutable proof that certain terrestrial proxies are consistent with the possibility that some aspects of the current ice extent constitute a full one sigma outlier. I guess the debate is over.
Did anyone pay to read the full study? I’m very curious as to what their proxies were. Not curious enough to pay them, however. If you look in to their funding, I expect that we’ve already paid for that study through taxes. Why do they want more of our money for the privilege of reading it?
And the fact that they opened with a blatant lie, doesn’t inspire confidence. Arctic ice has been shrinking for less than 40 years, as established by their own satellite observations. 1979 was the high point.
Here you go, sir:
http://dehavelle.com/papers/2011__Kinnard__Reconstructed_changes_in_Arctic_sea_ice_over_the_past_1,450_years.pdf
Here is a description of the proxies:
They conclude that the recent drop in ice coverage dramatically exceeds anything in the past 1,450 years. Of course they smoothed out the low ice values in the 1940s and even 1970s. They don’t even appear as a blip.
Their smoothing was interesting:
Some of their proxies have only 100-year resolution. But later, they say:
And under “Proxy pre-processing” they have:
A lot went on with that proxy data, including different weights based upon rationales:
Despite all this talk of smoothing, the ice extent endpoint is approximately the actual value for August 2007, the low point to date, of between 7m and 8m km². They note that they have few proxies after 1995.
And they use August because that was the only historical observation data they could get from Russia.
===|==============/ Keith DeHavelle
Thanks for the link. I’ll get started reading as soon as I’m done typing.
I’ve always thought their smoothing techniques were absurd. They start with a series of incomplete point clouds, each with it’s own inherent inaccuracies, representing something they believe correlates with what they want to reconstruct, usually with a theoretical maximum resolution of one year. (in this particular case, most of the proxies are only for temperature, which itself is only a weak proxy for sea ice extent) They throw out the outliers off the top. Then they smooth each point cloud, and throw out the outliers among the smoothed series. Then they average the remaining smoothed series with weightings that are little more than guesses. Then they smooth that average. Finally, they compare this product of repeated homogenization and outlier dumping to current data, with daily resolution, and claim it as proof that today’s conditions are unprecedented. It’s no different than averaging every number from 1 to 100, then claiming 53 is an unprecedented outlier. If they’d properly carried the error bars through the calculations, we’d see a very different conclusion.
This is is why even random numbers always produced hockey sticks, when run through Mann’s algorithms.
Alarmists hope for warm disasters, not cold ones. But the worst effects they imagine of warmth are actually cold-caused (violent weather, drought). So they’re truly up fecal creek.
Yes, it has “completely collapsed”, because the stated idea was that low-ice-extent years such as 2012 would have an immediate and devastating effect. The “albedo” would be less, and the open water would absorb so much sunlight that the Arctic Sea could not refreeze to the same thickness. So we watched carefully. It didn’t happen. In fact the ice is thicker in the central arctic. I’d say that shoots a hole through the theory that you could drive a truck through.
It is also troubling that the second graph our host posted has been below normal the past two summers. If you go to the DMI site you can check back through the graphs all the way to 1958:
http://ocean.dmi.dk/arctic/meant80n.uk.php
What you see is that there are always 60 days of slush up there. You say, “Report back when melting is at 1990’s levels again,” but in terms of temperature those summers were warmer. Only 1996 comes close to being as cold. The past two summers are the coldest, in terms of temperature.
If the DMI graph shows that it stays colder than normal up there for a third consecutive summer, I’d say there is a cause for concern, (if you are inclined to fretting about such things), even if the warm PDO melts ice on the Pacific side and the wind flushes ice south through Fram Strait on the Atlantic side. I’ll be watching with interest.
https://sunriseswansong.wordpress.com/2015/06/16/arctic-sea-ice-klyuchi-and-the-quietude/
Last but not least, there is this odd NOAA forecast for a greater ice-extent than normal, (which may be reason to assume there will be less, judging from some of their long-term forecasts.)
http://origin.cpc.ncep.noaa.gov/products/people/wwang/cfsv2fcst/imagesInd3/sieMon.gif
Caleb, thanks for the link to the DMI graphs. Summers have been a bit cold recently, but not so much winters. I assume this has to do with the recent displacements of the polar vortex during winters. Would you suggest that summer temperatures have a more significant impact on Arctic ice extent than those in winter?
Good question. I don’t know the answer, but here are some guesses:
DMI winter temperatures are largely a reaction to other factors during the winter. When the winter DMI graph shows a lot of warm spikes it usually means windy conditions and many storms with surges of warm air up towards the Pole and cold air down to sub-polar areas. When it is windy up at the Pole it breaks up the ice and can create wide leads, sometimes many miles across, which further warms the air, and also exposes more water to be frozen and cools the water more. Therefore you wind up with a counter-intuitive result of more ice resulting from warm winter DMI graphs.
When the ice is thick and unbroken it insulates the water from the cold, and when the pattern is zonal the cold stays up at the Pole and it is often calmer. Then, when the water beneath the ice is never churned, it can stratify to a remarkable degree, both in terms of temperature and salinity, and you can have flat layers of warmer water sliding in beneath the ice like a playing card into a deck. Warmer water under the ice has more to do with the decrease of ice thickness than air temperatures above the ice.
Temperatures actually come in third place, after winds that can flush lots of ice south. There are reports our host knows about from back in 1816 of an extraordinary amount of ice being flushed south into the Atlantic, cooling all of Europe even as the arctic was more ice-free than usual.
Once waters are ice-free they keep air temperatures milder until the water refreezes. During the MWP some arctic areas may have had a maritime climate until the Arctic Sea froze over, at a later date in the early winter than it does now.
I suppose what I am saying is that temperature is not the best measure of arctic conditions, as it depends on other factors. However the DMI graph is of interest, as it only measures north of 80 degrees, and other factors don’t have so much of an influence up there during the summer calm, where the sea is usually shifting floes of ice, summer after summer.
The fact it is measurably colder the past few years may have something to do with a climate shift, (perhaps due to the Quiet Sun). (It also may be due to DMI changing how they measured in 2002.)
While cooler summer temperatures might slow the summer melt slightly, I tend to think most of the melt continues to be due to warmer water below and also winds pushing the ice south through Fram Strait.
Replying to Caleb.
Thanks. Lots of stuff to ponder. To simplify your speculation, winds breaking up the ice sheets may make it easier for the polar region to radiate heat out to space–which has in fact been suggested by various commenters. If the vortex displacement is also associated with greater storminess in the Arctic seas, it could actually cool the Arctic despite the coldest air masses being relocated to Canada or Siberia.
All speculation, of course.
With the prolonged Cold, delaying the melt season ; logic tells me that the Arctic Sea Ice will trend even larger than the Summer minimum of 2006. This will be a disaster for the UN CC Conference in Paris with all those failed predictions. The IPCC is audacious to hold it in December ; with all probability of it being Snow bound & postponed… that would be like icing on a fruit cake!
At least in Paris, they will still have electricity from nuclear power available.
Not so sure they would want to hold it in the UK or Germany in this coming December. !
Reblogged this on Climatism and commented:
I thought the planet was meant to be warming. Will the people in Paris who want it to warm question why it isn’t? Will they question the sensitivity of CO2 based on the fact that the arctic, based on the most fundamental metrics, is likely cooling instead of melting?
The low solar peak of cycle 24 seems to be taking effect faster than many thought it would !
Dr. Evens and Dr Norman Page are suggesting a delay of about 11 to 12 years for the effects of changes in the sun.
http://joannenova.com.au/2014/06/big-news-part-vi-building-a-new-solar-climate-model-with-the-notch-filter/
http://junkscience.com/2015/04/14/dr-norman-paige-makes-a-good-impression-smart-guy/comment-page-1/
NASA reported a ‘DEEP Solar Minimum in 2009.
http://science.nasa.gov/science-news/science-at-nasa/2009/01apr_deepsolarminimum/
You can do the math.
The solar-notch theory is not worthy of consideration until they get it published. I followed some of the critique online and some of it put the whole theory in serious doubt. If they get it published, I will be all ears.
Why are you not all ears when CAGW is put in nserious doubt? Or when the models have been falsified at the 95% level?
According to the NOAA State of the Climate 2008 report, climate computer model simulations show that if observations find that the globe has not warmed for periods of 15 years or more, the climate models predicting man-made warming from CO2 will be falsified at a confidence level of 95%:
“Near-zero and even negative trends are common for intervals of a decade or less in the simulations, due to the model’s internal climate variability. The simulations rule out (at the 95% level) zero trends for intervals of 15 yr or more, suggesting that an observed absence of warming of this duration is needed to create a discrepancy with the expected present-day warming rate.”
http://www1.ncdc.noaa.gov/pub/data/cmb/bams-sotc/climate-assessment-2008-lo-rez.pdf
Page 24, Middle column
According to Phil Jones, there has been no statistically significant warming since 1995 [16 years, 3 months ago]. Ergo, the climate models have already been falsified at the 95% confidence level and it’s time to revert to the null hypothesis that man made CO2 is not causing global warming.
He further admitted that in the last 15 years there had been no ‘statistically significant’ warming, although he argued this was a blip rather than the long-term trend.
http://www.dailymail.co.uk/news/article-1250872/Climategate-U-turn-Astonishment-scientist-centre-global-warming-email-row-admits-data-organised.html
We are now past 18 years and counting.
Why are you all mouth?
Dr Evans put it up for serious critique, not pal review. An error was found that he is presently working on. I am waiting for the new improved version. Also Dr Evans made a conrete near term prediction as did Dr Page and Dr. Abdussamatov not some hand wavy some time in the next hundred years prediction like the ClimAstrologist are now doing. (There real term predictions all flubbed.
Mean time here is the 1976 paper by Eddy.
http://www.odlt.org/dcd/docs/john_eddy_Maunder_Minimum.pdf
A number of the critcisms ave been addressed here…
http://sciencespeak.com/climate-nd-solar.html
Lubos and a few misconceptions. Lubos Motl posted some inaccurate criticisms of the model, so we correct the main ones. Basically he attacked us for things we never said.
http://joannenova.com.au/2014/06/lubos-and-a-few-misconceptions/
Are transfer functions meaningless (the “white noise” point)? Beware your assumptions!. A review of the assumptions underlying the investigation that led to the notch, because some people haven’t noticed both assumptions or appreciated their implications.
http://joannenova.com.au/2014/06/are-transfer-functions-meaningless-the-white-noise-point-beware-your-assumptions/
The Solar Model finds a big fall in TSI data that few seem to know about. Leif Svalgaard beclowned himself in a vitriolic orgy of baseless accusations over at WUWT, so we graph his own data, and that of the IPCC’s preferred TSI reconstruction, and show that they also show strong falls in TSI, albeit from 1996 as well as 2003/2004. Apparently he didn’t know. Svalgaard emailed Joanne to say “science is a bloodsport”; Joanne replies that it “doesn’t have to be… You could use logic and reasoning instead.” Where possible, we stick to measured data over reconstructions, which, as Svalgaard says, “are guesses. Most of them are bad.” The measurements say the fall started in about 2004.
http://joannenova.com.au/2014/07/the-solar-model-finds-a-big-fall-in-tsi-data-that-few-seem-to-know-about/
More strange adventures in TSI data: the miracle of 900 fabricated, fraudulent days. Answers the fallacious charges of Lief Svalgaard and Willis Eschenbach in comments in a recent post at WUWT. The repetitious, tendentious, and aggressive nature of their comments mark them as something other than truth-finding.
http://joannenova.com.au/2014/07/more-strange-adventures-in-tsi-data-the-miracle-of-900-fabricated-fraudulent-days/
Notching up open review improvements — a correction to Part III. Originally we thought a notch in a linear invariant system necessarily implied the existence of an associated delay. However electrical engineer Bernie Hutchins showed that a notch was causal, not non-causal as we had calculated. We had calculated the response of a notch to a train of rectangular pulses, not to a step function as intended (due to a subtle misapplication of the DFT). That error is now corrected. In our opinion this is a triumph of open science, because many eyeballs found a problem that review by peers had not.
http://joannenova.com.au/2014/07/notching-up-open-review-improvements-a-correction-to-part-iii/
This is how peer review works in the 21st century. No gatekeepers.
You can see the fall in solar activity in this graph. Note 2009.
http://jonova.s3.amazonaws.com/graphs/solar/solar-ap-index-2014-sm.gif
As SG has predicted, Arctic sea ice area is trending with less melting than previous years.
It is now well above 2010 and 2011.
Antarctic sea ice is tracking very slightly below the 2014 extremes
Global sea ice is tracking 2009 very closely.
The Russian science is saying another ice age imminent
http://thermalscience.vinca.rs/pdfs/papers-2015/TSCI140902018A.pdf
Yes Fred, the Russian’s may well be right given the trends in recent years. I have also seen similar predictions, from some UK Scientists on a “little ice age” ; that’s possible…
Fred Singer has been posting a few articles suggesting that it might be worthwhile to do some research on how to deal with a new glaciation.
One of Dr Singer’s articles Preventing a Coming Ice Age
The Logistics in preventing an Ice Age maybe easier than converting the Warmists to the concept of Cooling ( CAGW is a die-hard religion ). I believe Dr Singer has a good handle on the reality of the situation ; yes, highly probable and good Science.
So Dr. Habibullo Abdussamatov, head of the space research laboratory of the Russian Academy of Science’s Pulkovo Observatory has “… a time delay of 20±8 years defined by the thermal inertia of the Ocean…” That is in the same ball park as Dr Evans and Dr Page estimate of the delay (11 to 12 years) between changes in the sun and changes in earth’s temperature/climate.
Looks like more validation.
Expect a really big push to get the treaty giving the Banksters*** control of CO2 in Paris this year. They know they are on a very short clock.
*** Copenhagen climate summit in disarray after ‘Danish text’ leak
The banksters REALLY REALLY want to control CO2 so they can control entire economies.
Where did cfgj go? I’m hoping he/she is reading the papers listed, but I’m not holding my breath.
Neither am I. Tthe information is for the fence sitters who may view this blog.
The Alarmists know they do not have scientific facts on their side, that is why true scientists were labeled ‘Deniers’ and barred from commenting at many prominent papers and websites.
When the facts are against you ATTACK the person. That is what Obummer and senator Whitehouse are doing. The more vicious the attack the closer the person is to the real facts. – What a sorry state of affairs for this country and the world.
Caleb says:
June 18, 2015 at 3:17 pm
Gator,
If you can get your hands on one of those old Danish ice-extent-maps from August., 1938, it will be some handy proof there were years of low ice-extent before 1978.
The map can be found here…
http://brunnur.vedur.is/pub/trausti/Iskort/Pdf/1938/1938.pdf
But the map only shows the melting that occurred after 65 years of no LIA. It has now been 185 years (or nearly three times the melt time) since the LIA ended, so one would expect there to be less ice now than 1938. This is what alarmists just do not get. They do not understannd logic, or nature.
Thanks. The ice edge is not quite as far north as I remembered, but still way up there.
So when was the latest time there was less summer sea ice than now? According the the study in Nature probably not in at least the past 1450 years. Was there less ice in the Roman Warm Period – any proxy-data about that?
You do realize that the Earth is 4.5 billion years old, right? Even if the last time summer sea ice was at its current level was 1450 years ago, what does that prove? You are yammering on about nothing.
One would expect sea ice to continue to decline during an interglacial.
If AGW is true at some point we will have an anomalously fast/big reduction in ice. Only past statistics can tell us what is “anomalous” and here we need statistics from after the recovery from the previous ice age and not something millions or billions of years old.
More blathering. We should expect the ice to continue to melt right up to the next ice age. That is what has happened before, and that is what will happen again.
You are all mouth.
LEAP ( Late Eemian Aridity Pulse) is the last thermal pulse (warm period) of the Eemain. The late Eemian aridity pulse lasted 468 years with dust storms, aridity and bushfires There was a decline of thermophilous trees at the time of glacial inception. (At the end of the four hundred years.)
Of course the threshold is NOT necessarily as low as 416 Wm2 as the fall 2012 paper, Can we predict the duration of an interglacial? showed.
It varies.
Current value – insolation = 479W m?2 (from that paper)
MIS 7e – insolation = 463 W m?2,
MIS 11c – insolation = 466 W m?2,
MIS 13a – insolation = 500 W m?2,
MIS 15a – insolation = 480 W m?2,
MIS 17 – insolation = 477 W m?2
John Kehr had a good graph of the Eemain, (temperature CO2 and Solar insolation at 65N) but WordPress is still censoring his site.
Here is the link with several * added to allow me to post it.
h*ttp:/*/the*inco*nve*nients*keptic.com/wp-content/uploads/2012/01/Chap_6-Illustration_45.png
Any guesses on how long we need to wait for “some point” to come around? I predict that, at some point, there will be no ice at the north pole. I also predict that, at some point, there will be glaciers covering much of Canada. Lastly, I predict that none of us will live to see either of my first predictions. This is easy. I should have been a climate scientist.
No Ted, you are too smart to be a climate scientist ; your IQ is over 130…
One subtlety is the sort of “unnaturalness” of summer sea ice in the Arctic at all. During the period of plant and animal life on Earth’s continents, on the order of 600 million years, it has only been in the past few million (after the gap between North and South America was filled by volcanic activity) that the Gulf Stream was directed northward and ice ages began. We had Milankovitch cycles all that time, of course, but they did not result in glaciations. This then represents only about one-half of one percent of the time of life on land. There had been “snowball Earths” long before — and nothing about those past times could be considered beneficial to any but certain marine life forms, most of which are hundreds of millions of years extinct.
For the first couple of million years of the current “ice age,” the cycles were around 40,000 years — lots of little glaciations, and growing gradually colder each time. For the past million years, the cycle has been about 100,000 years, still getting colder on average. Most recently the cycle seems to be lengthening again, which is not good news as glaciation is the norm during these cycles and the current retreat has historically been a brief respite between unceasing ice ages.
The pattern has shown, for the past few hundred thousand years, signs of instability once again, seeming to grow longer yet. Would that CO2 worked as advertised, as it would help to prolong the brief warm Holocene before we plunge back into the bitter cold! But the impact of the increased carbon dioxide, while greatly beneficial to plants, is evidently too small to have much effect upon temperatures.
===|==============/ Keith DeHavelle
You are correct Keith, the Holocene is really rather cool compared to say the Eemain as shown in the graph I can not post. The Eemain never got as cold as now until AFTER 118 kyrs, that is after glacial inception. Glacial inception according to the Sirocko and Seelos paper was 118 kyrs before present and the Eemain finaly got to present temperatures ~116 kyrs before present. So by that metric (temperature) we are already passed glacial inception which is about right since the timing of the Milancovitch cycles puts glacial inception during the little ice age. Our lives are too short for us to really tell.
You can see how hot the Eemain was in this graph.
http://blogs.agu.org/wildwildscience/files/2013/01/vostok_back_to_eemian.jpg
Actually low level of sea ice wasn’t 1450 years ago (before the Little Ice Age) according to another study on the glaciers in Norway. That study wasn’t a conglomeration of mutilated proxies where ” extensive uncertainties remain, especially before the sixteenth century”
A new approach for reconstructing glacier variability based on lake sediments recording input from more than one glacier January 2012
So that study shows “significantly reduced glacier extent… ~ 900 cal yr BP” and the highest growth in glaciers that reformed after the Holocene Optimum “around 600 and 200 cal yr BP.”
The Little Ice Age wasn’t just one long cold spell although that is what the Alarmist who wrote the paper are hoping people think.
http://c3headlines.typepad.com/.a/6a010536b58035970c019b003de856970d-500wi
(Same graph)
http://3.bp.blogspot.com/-DEoXwnPzSVg/Umb4quSAX8I/AAAAAAAAFdo/Fdvv9sSIqNo/s400/Fullscreen%2Bcapture%2B10222013%2B31241%2BPM.jpg
From: Testing long-term summer temperature reconstruction based on maximum density chronologies obtained by reanalysis of tree-ring datasets from northernmost Sweden and Finland
Believe me Gail, I was only allowing 1450 as the last low point to illustrate the inanity of the comment, and study. Both are merely fools gold.
It was certainly warmer in the Arctic during the MWP and all the previous 8000 odd years.
Proxy data for that is very solid. It is only the last few hundred years that have been anomalously cold in the Arctic for this interglacial.
Are you saying there was not less sea ice during the warmer 90 odd percent of the Holocene, apart from this last few hundred frozen years?
I’m asking what the proxies show. The drop in ice volume in the North has been VERY rapid in the last 30 years, any data showing that this is within “normal” variation?
Any data showing it isn’t?
We know during the Holocene the Arctic was 2-3ºC warmer for most of the time.
Are you saying that this warmer climate did not lead to lesser levels of Arctic sea ice ?
Gator and Gail have provided such evidence of low Arctic sea ice levels during the Holocene..
Even the little warmista paper you linked from Nature, says as much.
You have just ignored it, like you do all contrary evidence.
” The drop in ice volume in the North has been VERY rapid in the last 30 years, any data showing that this is within “normal” variation?”
Are you not familiar with the Dansgaard-Oeschger temperature cycle where the temperature rises 8 to 10C in a matter of years to decades? Within the Holocene they are called Bond Events. Both have a period of about 1450 years.
https://media2.stickersmalin.com/produit/100/stickers-devil-smile-R1-143760-2.png
Coincidence?
From NOAA
https://www.ncdc.noaa.gov/paleo/abrupt/images/data3-gisp2-icecore.gif
(Graph from NOAA website)
http://c3headlines.typepad.com/.a/6a010536b58035970c0133f64fd3c5970b-pi
How about speleothems?
http://c3headlines.typepad.com/.a/6a010536b58035970c0133f5c6ea96970b-400wi
A lot more graphs here:
http://www.c3headlines.com/temperature-charts-historical-proxies.html
So many of you posting with absolutely excellent information/sources! I am grateful for your efforts. Gail, Gator- I’m so glad you are sharing again. Really, thanks to all of you ( only one exception : ). It is beginning to look like I’ll live long enough to see all of Steve/Tony’s efforts validated and, of course, the works of all the honest scientists who are so maligned.
“Sent” happened before I was finished. I am grieved to learn today that Alan Carlin has died. It is a great loss to lose such an ethical, intelligent man. Final note: if I do pull off enough years, I’ll surely die before having to deal with too much cold! I hate cold! Love the myriad benefits of fossil fuels!
I believe you mean Alan Caruba. A great loss.
Darn, Darn, Darn —
You are correct Gator a great loss as was the loss of Nigel Calder last summer and Dr Zbigniew Jaworowski in 2011 to name just a few.
Reblogged this on Daily Browse.
May the summer of 2015 return society to SANITY (contact with reality):
For the past 500 years, mankind has lived in FEAR OF REALITY.
Selfishness – driven by fear – is the root of many other social problems today.
E.g., the current AGW scare is a continuation of an irrational response almost 500 years ago to the report by Copernicus in 1543 that Earth and the other planets all orbit a giant fountain of energy at the gravitational center of the solar system.
Precise measurements and observations on the Sun and other parts of the solar system have revealed that this fountain of energy is the creator, destroyer and sustainer of every atom, life and planet in the solar system [1].
The fountain of energy in the Sun’s core is powered by neutron repulsion, the source of energy in cores of
1. Atoms heavier than 150 amu, like Uranium
2. Some planets like Jupiter
3. Ordinary stars like the Sun
4. Galaxies like the Milky Way
5. The expanding Universe
We cannot control, but need not fear or ignore, the pulsar at the core of the Sun that created and sustains every atom, life and world in the solar system today.
References:
1a. “Solar Energy,” Adv. Astron. (submitted 1 Sept 2104; published privately 17 Mar 2015)
https://dl.dropboxusercontent.com/u/10640850/Solar_Energy.pdf
1b. “Supplement for Teachers” (published 30 Mar 2015) https://dl.dropboxusercontent.com/u/10640850/Supplement.pdf
1c. “Intro: Science for Teachers” (published 23 May 2015)
https://dl.dropboxusercontent.com/u/10640850/Introduction.pdf
Ghastly weather in Nuuk, even now. More or less the same amount of snow but dismal rain too, temp 5°C, dewpoint 2°C:
http://arcticomm.gl/webcam/arcticomm_webcam.jpg
Temp/dewpoint 0°C/0°C in Upernavik.
METARs for Greenland:
http://www.dmi.dk/en/groenland/vejret/metar-og-taf/
Dave1billion says @ June 18, 2015 at 6:42 pm
Leaving everything else aside, giving that the article to which you link is dated from 2011, the concept of “current” must mean something different than you think it means.
>>>>>>>>>>>>>>>>
Current to many means the Holocene. Just depends on your perspective. That is why ClimAstrologists and their hobgoblin ‘climate’ scare stories are so down right funny. Dansgaard-Oeschger cycles can mean a temperature change of 8C – 10C and as much as 16C in dramatically short times like within a decade, so the ClimAlarmists hyperventilating over tenths of a degree over a similar period is really laughable especially since the error is greater than the measured change.
https://media2.stickersmalin.com/produit/100/stickers-devil-smile-R1-143760-2.png
The 2015 Summer may give the Pope another Sun burn:
https://craigm350.wordpress.com/2015/06/19/is-the-catholic-church-burned-by-the-sun-again/
Reblogged this on Climate Collections.
Ah hell! Does it really matter? I mean after all the “eminent scientist” Frank Fenner, says that we will probably be extinct within the next 100 years! http://phys.org/news/2010-06-humans-extinct-years-eminent-scientist.html
Pingback: ARCTIC SEA ICE —Klyuchi and the Quietude—(updated six times) | Sunrise's Swansong