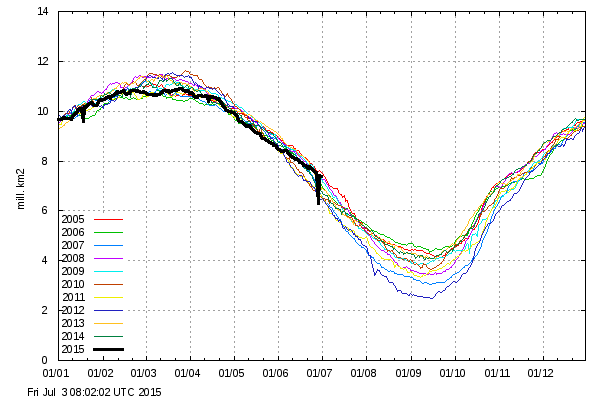
Yesterday the White House announced that Polar Bears are doomed, as sea ice returns back to 2005 levels.
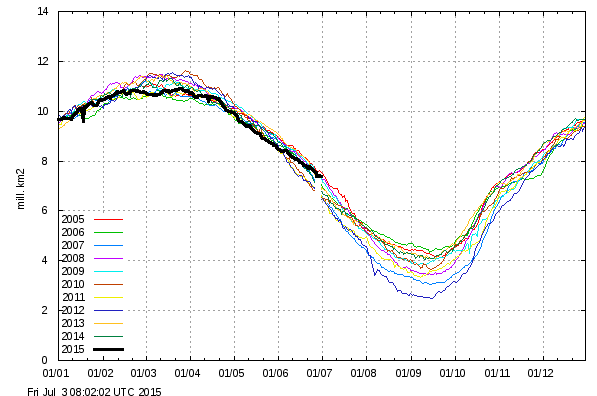
Here is the same image with the Wednesday glitch removed
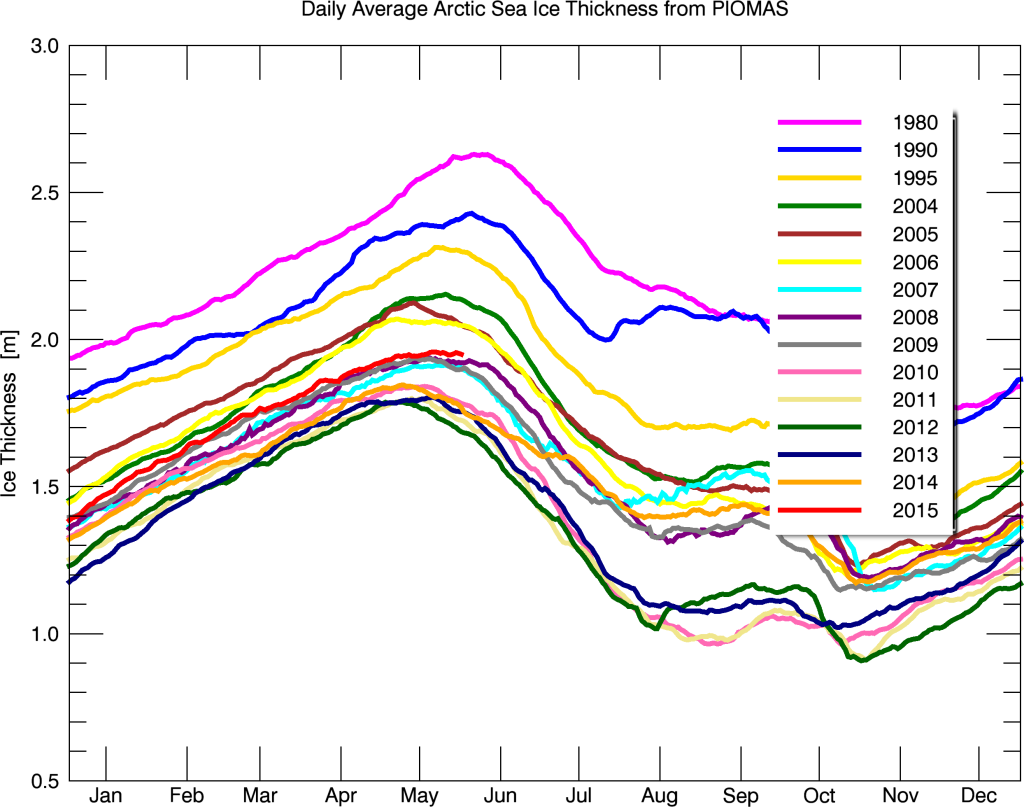
Not only is the ice extent high, but its thickness is too. Arctic sea ice is the thickest since 2006.
As always, the White House is lying – about both the ice and the bears. There is not the slightest indication that either are threatened.


You can tell when he’s lying,
His lips start to move;
With his climate agenda,
Obama’s right in his groove!
http://rhymeafterrhyme.net/obama-and-ignorance-an-infectious-disease/
The thickness graph is not up to date.
And where’s Jim Hunt?
Jim is busy stealing food from the real CAGW victims.
See that you’ve picked up on that old NASA trick – erasing the past (well, at least one day of it). LOL.
In other news on the other end of the globe, we find tomorrow’s forecast to be much warmer 😉
http://www.wunderground.com/global/stations/89208.html
Notice how they use their standard symbol for the clear or partly cloudy days? The sun does not rise so there can be no sun as their symbol is showing. Too funny! Guess it was too much trouble to make a special symbol for the poles when their is not sunshine.
-105 … “feels like -105”
too funny
then there was an ad with a retiree in wet suit with a surfboard
for when the glaciers melt
I’m looking forward to my surfing retirement in Antarctica
this climate change thing is just the best
Yes the slope is still indicating normal or above mean for September 2015. Watch out for the AGW cartel trying to kill off the DMI site.This is really the nail in the coffin for them if it occurs. Its “THE” AGW gold standard. That’s why there will be pressure on DMI to change something so it cannot be seen (minimum)
Meanwhile, I saw something unusual on an AccuWeather forecast video this morning. A high pressure area off the PNW coast was shown to be moving West. Somewhat northwest, to be exact. How is this even possible? I’ve never seen this phenomenon before.
You missed the obvious headline:
“ARCTIC SEA ICE EPANDS AT UNPRECEDENTED RATE.
Entire ocean to be frozen solid within days, if current trend continues.”
I know, some of you people spell “expands” with an “x”
That’s not how I roll.
Hey Ted! You might enjoy a short story by Poe, “X-ing a Paragrab”.
http://biblioklept.org/2013/01/28/x-ing-a-paragraph-edgar-allan-poe/
http://www.bing.com/videos/search?q=x%27s+and+o%27s+elle+king&qpvt=x%27s+and+o%27s+elle+king&FORM=VDRE
X’s and O’s by Elle King is an ecellent song
It appears that Reggie made an appearance on Wednesday with his gigantic blowtorch, but fortunately the effect was only temporary.
I finally got around to it and bought a max/min thermometer. Put it out on my 10th floor balcony on the north side of the building which does not get any sun. For the past week, my average high temperature has registered an average of 8 degrees lower than National Airport!
I have compared my thermometer to other thermomters and it seems to be reflecting an accurate temperature. My conclusion is they are exaggerating temperatures, not by just a little, but by a very large amount!
And that’s before any “robust” “adjustments”!
I’ve been observing the exact same phenomenon around Saint Petersburg, Tampa, and Lakeland for many years now. Around here, it’s especially pronounced in the winter, but even in the summer it is commonly a difference of 4-5 °F — before “adjustments”! (That last little detail cannot be overemphasized.) In winter, 10°F difference is not extraordinary, and 8°F is routine.
The Communists are obvious about the fraud because they figure they have so many of us utterly brainwashed that they don’t even have to hide it, and they’ll still achieve their goals without too much trouble.
RT
It is very possible that if we could get accurate measurements of the planet’s temperature we would find that we are slowly sliding into much colder times. But since we can’t trust any government funded data set — who knows?
What a great idea… we should all get weather stations … hook em’ up to WiFi and compare to the Local Airport bullshit…
Happy Fourth of July
1. This great nation began with the “Declaration of Independence” on 4 July 1776.
2. This great nation ended because:
_ a.) Eighty-seven years later, in 1863, President Lincoln trusted and appointed a private, self-perpetuating group of distinguished scholars to advise the government on science and technology – The National Academy of Sciences.
_ b.) Forty-nine years later, nations were united under the UN on 24 October 1945 and the NAS directed research funds in federal research agencies to support the “Secret Social Experiment.”
https://dl.dropboxusercontent.com/u/10640850/Introduction.pdf
Oliver
What do you expect will happen when we entered a global cooling period?
https://i0.wp.com/oi62.tinypic.com/33kd6k2.jpg
Sun is at its lowest activity since 1928
http://www.woodfortrees.org/graph/sidc-ssn/from:1972/to:2016/offset:10/trend/plot/sidc-ssn/from:1927/to:2016/plot/sidc-ssn/from:1927/to:1972/trend/plot/sidc-ssn/from:1927/to:2016/trend
Tied with 2005
and only 82,000 below 1 sd from the 1981-2010 mean
https://sunshinehours.files.wordpress.com/2015/07/arctic_sea_ice_extent_zoomed_2015_day_183_1981-2010.png
Antarctic still swapping 2nd/3rd with 2010
https://sunshinehours.files.wordpress.com/2015/07/antarctic_sea_ice_extent_zoomed_2015_day_183_1981-2010.png
there are one or two people on the arctic sea ice forum trying an failing,to keep a lid on the alarmist element on there. sadly it means the more sensible posters have started posting more detailed information,like the true thickness of some of the ice in the arctic (actual measured ice, not modeled crap ) which may make them reign in the alarmist hyperbole,thus removing a great source of amusement for people of a more realistic disposition.
it will be interesting to see whether minimum extent can increase for the third year in a row , if it keeps increasing surely even the most committed of the agw cause will have to have a rethink ?
Yea, they’ll “rethink” and the answer would be the same if it snowed on them in Paris thic coming Sept. They would say it’s just extreme weather caused by man made climate change. I’ve come to the conclusion that no thought of telling the truth ever enters their minds. They aren’t stupid. They’re just dishonest and caught red handed with their hand in the cookie jar they will lie like there is no tomorrow.
Using the well known climate science™ technique of extrapolation and channeling well-known Arctic ice expert Professor Peter Wadhams, I have calculated that the Arctic will be ice free by the end of January 2016.
Did you see Wadham’s prediction for minimum extent this summer? Something like 1.9 million km2. That’s something like 3 million km2 lower than the second-lowest prediction. It seems fairly obvious Wadhams is beyond embarrassment. He’s like a gambler so far in debt that he sells his last possessions and bets it all on number 7 on the roulette wheel.
I’m sure Jim “Starve ‘Em” Hunt will be all over that, always correcting alarmist statements. He is so detail oriented.
More likely he will swiftly change the subject by posting some tidbit of data that has little to do with the subject being discussed.
What’s worse is that he had grants for 16 years from ‘Big Oil’ – BP
… He received continuous support from British Petroleum Co. from 1976 until 1992 …
Does the man have no shame?
/sarc
Sorry Billy,
Wadhams is wrong. The Arctic was ice-free (below 1k km^2) last year and by this September we’ll have anti-ice in the Arctic. Here’s the proof:
https://14adebb0-a-62cb3a1a-s-sites.googlegroups.com/site/arctischepinguin/home/piomas/grf/pgd-volsep1.png?attachauth=ANoY7cpXAAZMpqdUiy4tXpzPCiCKJIC3_OTsMCREYLDtqdI7-NU61VqO1UdB6zdJIdWyR0Uh1eIIDvDp5YOUIrxcyVmxMXRleRI2CPb9E0LnREdHsD0IC_VbzXHy0pUc5QNF2iwXuRoo_zJo6fJoHBn46uFF2qPLUiovuwritQLgEH3675EJOlZXo84NV7NVR8VTQVhc4lyJyUCJu0etfOIb21TZknz2yk0_0YNpvAqCAMlH2EF_maNU_tKIe-Y3IV0BorNXqdvv&attredirects=0
-Scott
I can see you need some grant cash to study ‘anti-ice’ – I presume it will be a complex enquiry and take some time?
(oops, posted to the new site that it seems few even look at… so here it is again)
There is a wonder of information you can gather from that bottom graph Tony. Took 32 years to go from the top in 1980 to the low in 2012 which is showing about a six year lag to such charts as this (adjustments nulled out):
http://i39.tinypic.com/1118rnl.png
That would be about 2.5 cm per year it took it to go from 2.6 meters down to 1.8 in 2012. That is 0.8 m in 32 years gives about 2.5 cm/year and if the 62-64 year pattern holds it should thicken back at about the same level by 2040 or so. Stay tuned.
Tony, really, thank you for your incredible knack for digging all of this history back out of the papers and magazines. Priceless.
Based on my own blog stats, it seems that he’s getting a good number of readers over there. But they seem not to want to comment as much. Perhaps because they can’t get replies via e-mail? Anyway, I’m glad the new site is up. The T r o t s k y thing is just ridiculous, and makes me wonder, What’s next? But with another site up that they can’t control (or not as easily), people are less likely to try to mess with this one.
Regarding your graph, I noticed that the deAdjustment function is just a straight -0.75°C per century, starting at 1940. I’m concerned that maybe your not capturing the full effect of the fraud with a function like that. Plus it’s not really correct to say that you’ve “nulled out” all the “adjustments”.
–RT
The entire idea of the “Death Spiral” has already faced its “Tekel” moment. (IE: It has been weighed and found wanting.) It happened in 2007, and then, as if to rub it in or underscore the certainty, it happened again in 2013.
In order to be a “spiral” is has to go in a certain direction. It can’t back up. Once it backs up it isn’t a spiral, but rather a mess, a snarl, the sort of tangle your toy slinky gets into after your kid brother plays with it.
In fact this specific spiral, the so-called “Death Spiral”, was suppose to accelerate. Less ice and snow on the Arctic Sea was suppose to allow more sunlight to penetrate the water, heating the water and melting more ice, and so on.
Therefore to even have ice stay at the same levels defeats the theory. We don’t have to see any increase in the ice, for Alarmists to be proven wrong. Some seem to worry the ice has to increase, to prove the theory incorrect. Not so. Things only need to stay the same. And that’s what things usually do: Stay the same, more or less.
https://sunriseswansong.wordpress.com/2015/06/28/arctic-sea-ice-slush-the-puck-up/
That was and is the stupid idea. It is not nearly as simple, reason being once the water is open it has a higher evaporation rate, plus that the Arctic night easily freezes down the top mixed layer of cool (not heated or even warm!) water.
This is all about story-telling, not science. And while scientists can always change their story based on new evidence, the alarmists have lost their credibility there by starting a story which clearly didn’t and couldn’t come true. The scientists also lost the game, because they failed to shoot down the alarmist stories. Every time the MSM mentions the Arctic, I’m now thinking about professor Wadhams and his predictions.
You are correct. Also the story was and is a stupid story for many other reasons as well, (the MWP and Vikings in Greenland being what originally alerted me.)
People like a good story-teller, but people also have a tendency to “trust, but verify”. When a story fails to verify it either goes down in flames, or becomes a “belief”, which must have a special set of rules for when things don’t verify and prayers go unanswered.
The “Death Spiral” has simply failed to verify.
By the way, Hudson Bay began June with the least ice in the past five years, and ended the month with the most.
https://sunriseswansong.wordpress.com/2015/07/04/arctic-sea-ice-hudson-bays-slow-thaw/