A few weeks ago, climate criminal Michael Mann (who knows nothing about the subject) said that satellite temperatures are not as reliable as surface temperatures.
According to Dr. Michael Mann (Penn State), the satellite temperature record has actually been subject to more adjustments than the surface record. Mann also states that the global satellite temperature record has been shown to have a bias of showing too little warming.
How accurate are satellite measured temperatures of the troposphere? – Climate Change Weather Blog
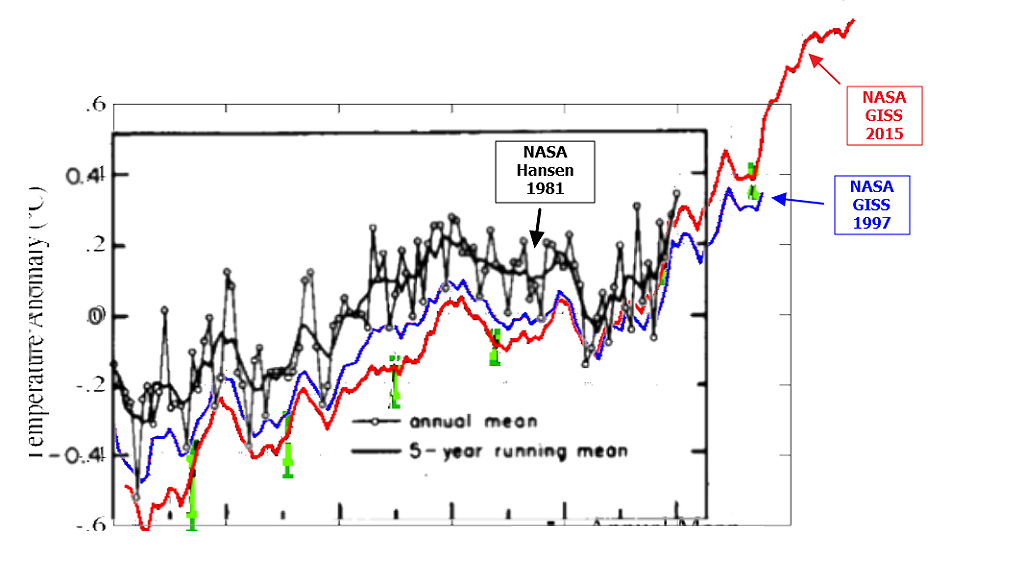
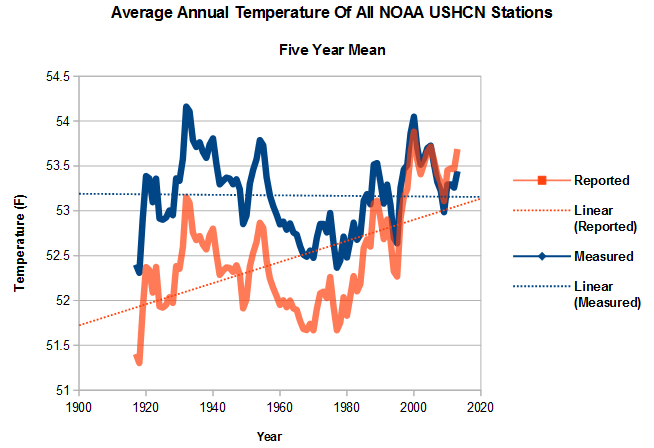
Thus is a flat out lie. The surface temperature record has been adjusted to the point of being farcical.
1981: Challenge_chapter2.pdf
2001: Fig.A.ps
current: Fig.A.gif
NASA has doubled 1880-2000 warming since 2001 by eliminating rural stations and homogenizing UHI infected urban stations.

The entire US warming trend over the past century is due to adjustments.
Dr. John Christy of the University of Alabama at Huntsville is an actual expert on satellite temperatures, and he pulverized Mann’s fraud in Congress this week.
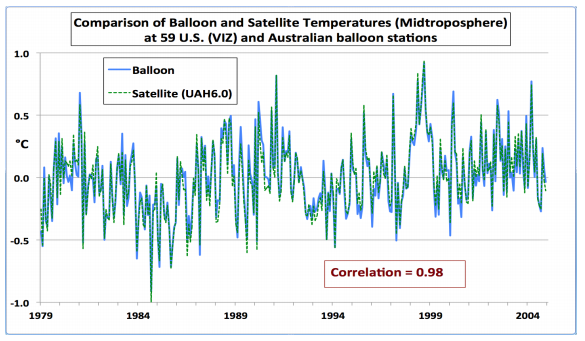
First, the claim is made the satellites do not measure temperature. In reality, the sensors on satellites measure temperature by emitted radiation – the same method that a physician uses to measure your body temperature to high precision using an ear probe. Atmospheric oxygen emits microwaves, the intensity of which is directly proportional to the temperature of the oxygen, and thus the atmosphere. That the satellites measure temperature is evident by the following chart which compares our UAH satellite data with temperatures calculated from balloon thermistors. As an aside, most surface temperature measurements are indirect, using electronic resistance.
Michael Mann has been shown over and over again to be an embarrassment to the profession, but he says the things that progressives want to hear. So they listen to him and ignore actual scientists.


I appreciated the brief discussion on the satellite method of measuring temperature.
It’s wrong that satellites only measure microwaves from O2 molecules. The CERES bolometer on the JPSS satellite measures IR directly in the 9-12 micron N-band. Since the atmosphere is 96% transparent in that band, the satellite is measuring the surface temperatures, not the temperatures of some pie in the sky.
John I am greatful to Tony for publishing Christy’s work. Christy is one of few who managed to retain his personal integrity while working for a federal agency.
And they give Mann MONEY.
NASA has doubled 1880-2000 warming since 2001 by eliminating rural stations and homogenizing UHI infected urban stations.
Yep, much said in one sentence. I thought only God could do that, but some people view NASA
as God. However, not relatives of seven would be space adventurers.
More important
The Paris agreements a bad deal for the Constitution.
https://youtu.be/ZWD22OtAMHg
Mr Groves 41:04
Comparison of regional satellites with the ONLY pristine surface data in the world.
http://s19.postimg.org/uuy2ft3jn/Combined_USA_temperatures.png
The satellites are doing an EXCELLENT job.
Those satellites sure are doing quite well. I find this comparison impressive. It makes it even more obvious how much BS there is going on with the other surface ‘adjusted’ records. It seems that if you are just careful and meticulous and don’t fudge with your readings after the fact, that various methods of measurement are fairly well in agreement. Thanks for providing this graph.
My understanding is that satellites do very well taking the temperatures in the tropic and temperate zones but have some issues to deal with in the polar zones.
How did you arrive at that understanding? Please share your informational sources.
Well if so, it is still better than GISS, HADcrut etc which basically don’t have ANY coverage in polar regions
The JPSS satellite goes over the poles, that’s what the P stands for
In his latest post Dr. Spencer alludes to the problem I am referring to. In an earlier post written before the lastest 6.0 data set he got into more detail about it but I can’t find it. It’s been too long ago and unlike Gail I do not save and catalog by subject every scrap of info I read on a particular subject.
http://www.drroyspencer.com/2016/02/uah-v6-global-temperature-update-for-january-2016-0-54-deg-c/
Neal, now look at this comparison, and see what you think.
Remember.. this is 3 data sets from very different sources. 😉
http://www.ncdc.noaa.gov/temp-and-precip/national-temperature-index/time-series?datasets%5B%5D=uscrn&datasets%5B%5D=climdiv&datasets%5B%5D=cmbushcn¶meter=anom-tavg&time_scale=p12&begyear=2005&endyear=2015&month=12
http://bishophill.squarespace.com/blog/2016/2/5/a-cartoon-week-josh-361.html
A heavily monied agenda, with unregulated, highly biased data adjustments by those supporting the agenda is a perfect recipe for fraud.
It may well be the happiest and most satisfying day of my life when that idiotic dirtbag gets his richly deserved come-uppance.
I hope I am right there to see it.
How dare you smear dirtbags by comparing them to that douchebag.
All of the lesser dirtbags will have to re-examine their life choices or be smeared by association with Dirtbag First Class Mann.
“We had been concerned that the LT temperature trends over land were too warm compared to the ocean. One hint that something might be wrong was that the trends over very high elevation portions of the Greenland ice sheet and the Himalayas were much colder than the surrounding regions (see Fig. 4 here). Another was discontinuities in the trend patterns between land and ocean, especially in the tropics.
“We determined this is most likely due to a residual mismatch between the MSU channel 2 weighting function altitude on the early satellites versus the AMSU channel 5 weighting function altitude on the later satellites. We already knew AMSU5 peaks lower than MSU2, and had chosen Earth incidence angles in each to get a match based upon theory. But apparently the theory has some error, which we find equates to about 150 meters in altitude. This was enough to cause the issues we see….land too warm at low elevations, too cold for elevated ice surfaces.
“We therefore changed the AMSU5 reference Earth incidence angle (from 35.0 to 38.3 deg.) so that the trends over Greenland and the Himalayas were in much better agreement with the surrounding areas.”
Absolutely nothing happens by mistake. Without Climategate, no one would ever believe our once beloved space agency – NASA – capable of fraud.
Although NASA successfully brought samples from the Moon in 1969, ESA and NASA worked in unison to prevent publication of information from analysis of lunar samples that showed the Sun is a giant mass-separator that enriches the two lightest elements, H and He, and the lighter isotopes of heavier elements in the photosphere and in the solar wind:
http://www.thesunisiron.com
uah seems odd one out?
http://www.woodfortrees.org/graph/hadcrut4gl/from:1987/to:2017/plot/hadcrut4gl/from:2002/to:2017/trend/plot/hadcrut3gl/from:1987/to:2017/plot/hadcrut3gl/from:2002/to:2017/trend/plot/rss/from:1987/to:2017/plot/rss/from:2002/to:2017/trend/plot/hadsst2gl/from:1987/to:2017/plot/hadsst2gl/from:2002/to:2017/trend/plot/hadcrut4gl/from:1987/to:2002/trend/plot/hadcrut3gl/from:1987/to:2002/trend/plot/hadsst2gl/from:1987/to:2002/trend/plot/rss/from:1987/to:2002/trend/plot/esrl-amo/from:2002/to:2017/trend/plot/jisao-pdo/from:2002/to:2017/trend/plot/uah/from:2002/to:2017/trend
WFT still uses the old v5.6.
There was a drift error that needed to be fixed.
You should get V6 from Roy’s web site.
Reblogged this on Climate Collections.