
In 2004, the University of Colorado showed 35 mm sea level rise from 1993 to 2003. 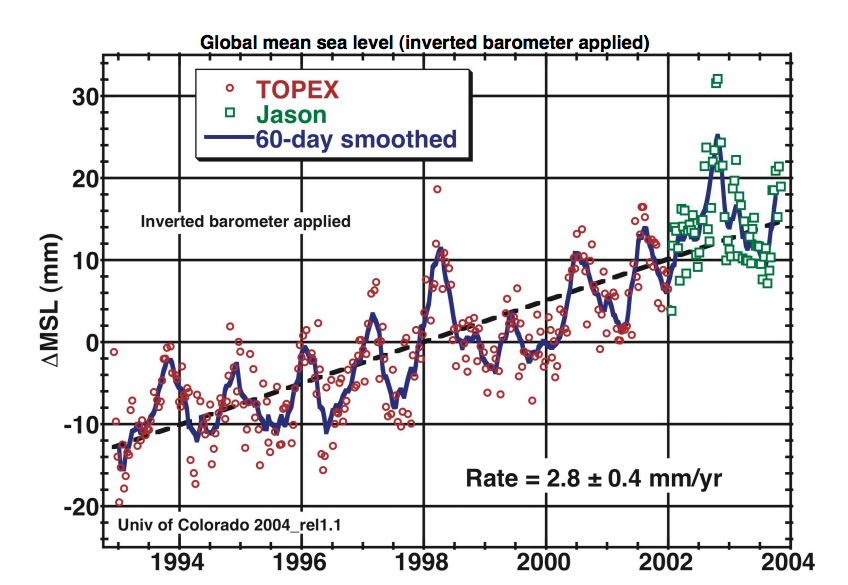
They now show 45 mm sea level rise during that same period, using the same data set.
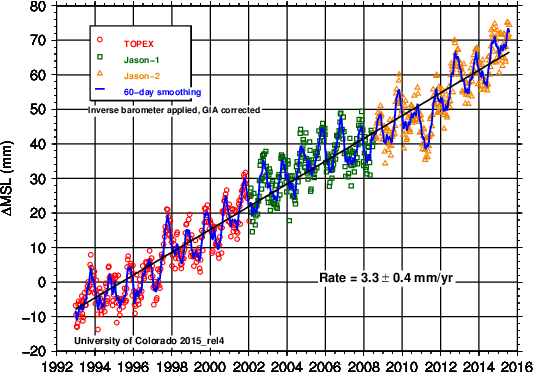
The overlay showed how the University of Colorado has altered the data since 2004, to suit their funding needs.
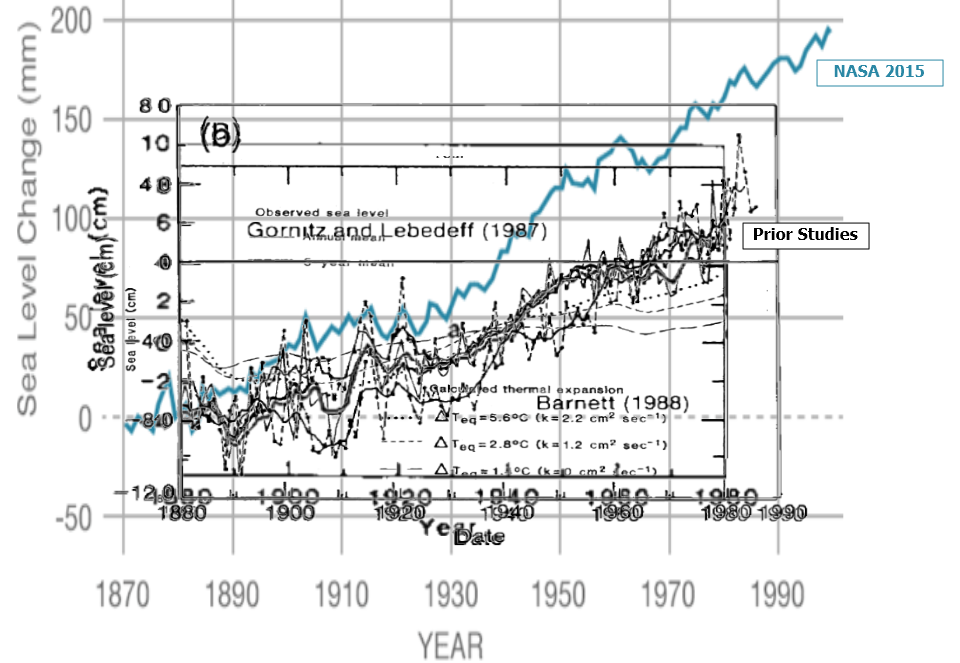
They are not alone in this effort. The overlay below shows how NASA has similarly altered their tide gauge data, to hide the fact that sea level rise slowed dramatically after 1950.
NASA Sea Level Fraud | Real Science
In 1982, NASA showed 1 mm/year. Now they claim 3.3 mm/year. They have more than tripled sea level rise by simply altering the data.
pubs.giss.nasa.gov/docs/1982/1982_Gornitz_etal_1.pdf
Eighty-six percent of tide gauges are below 3.2 mm/year.
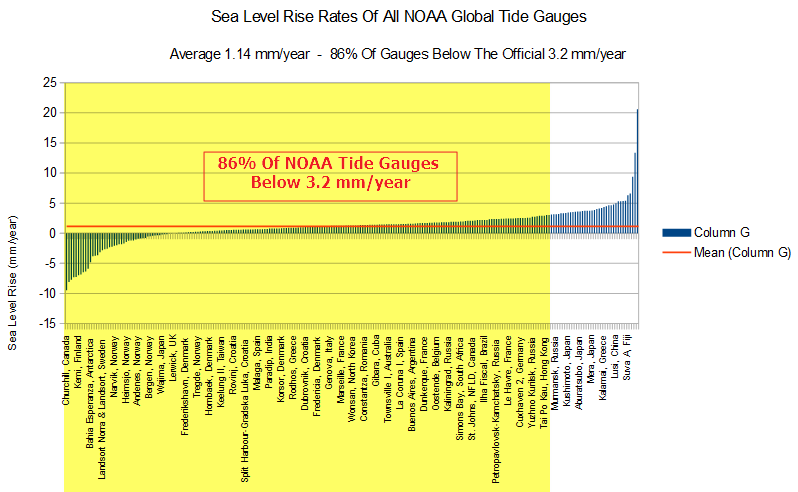
tidesandcurrents.noaa.gov/sltrends/MSL_global_trendtable.html
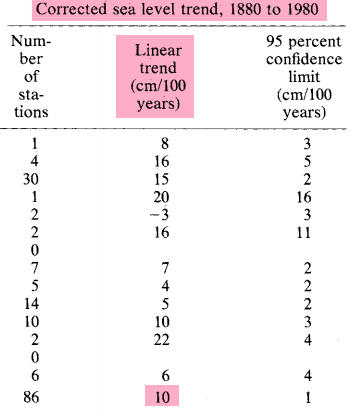
NOAA says that sea level rise is only 1.7-1.8 mm per year – just over half of what CU/NASA claim.
the absolute global sea level rise is believed to be 1.7-1.8 millimeters/year.
Anyone who accepts this obvious fraud as science, is clearly not a scientist – or a serious human being for that matter.

Does it strike anyone else as odd that sea level metrics come from Boulder? That’s like snow and ice data coming from Miami.
You are just jealous, Gator. We had our sea but when was the last time you had glaciers in Florida, huh?
Here is a maritime scene near Pueblo, Colorado (live recording made by University of Colorado, Boulder):
https://www.youtube.com/watch?v=xUFFRzVodWM
Heck, we even had swamps and we can prove it. CU Boulder scientists say that this live scene was recorded near Boulder; I looked it up and I think it’s at 5735 Arapahoe Ave:
https://www.youtube.com/watch?v=vc7MyIRmGPY
CU Boulder doesn’t say if we had Colorado farm girls back then playing in the swamps but I know that if we did they looked like this:
https://www.youtube.com/watch?v=FK5ThsyMB4c
So there.
Specist!
Just because my name is Gator, you automatically assume that I must live in the tropics. Get thee to a reeducation camp!
PS – Swampgirl can bait my hook any day. 😉
That’s absurd.
We all know Gail lives in North Carolina, not Colorado.
I guess with the CSIRO in Australia letting 350 “climate scientists” go because the science is “settled” the rest of the world’s best must be a bit worried other politicians may agree that the science is settled. We are told that all the time
FRONT PAGE NEW YORK TIMES…..TODAY Greenhouse Gas Lined to Floodsee Along US Coast
Thank you, Steven aka Tony, for using your talents to inform the public that today – more than six years after the surprising revelations of Climategate emails in late Nov 2009: Government science continues as a tool of government propaganda, much as
1. George Orwell warned in the book he started writing in 1946: “Nineteen Eighty-Four,” and as
2. President Dwight D. Eisenhower warned in a farewell address to the nation fifteen years later, in 1961, about the dangers of
_ a.) The military-industrial complex, and
_ b.) Elitist government-funded scientists taking control of government policy.
I will try to find and post links to warnings about the present state of science from fifty-five to seventy years in the past.
George Orwell’s warning from 70 years ago:
http://www.online-literature.com/orwell/1984/
President Dwight D. Eisenhower’s warning from 55 years ago:
https://m.youtube.com/watch?v=GOLld5PR4ts
CU is overdue to publish 2016 release #1. They still show 2015_rel4. I just read where NOAA says the satellite data is now up to 3.4 mm/yr and I’m also waiting for the new data from the satellite that was launched in January. I expect to find the 3.4 mm/yr from CU and probably some adjustment to the data that reflect the new piece of equipment. You can bet I will be redoing this chart
http://oi58.tinypic.com/331k5ya.jpg
When CU adjusts their data, they move the whole thing, not just a couple of entries. That’s why that
graph I paste up here at every opportunity looks like it does. So I will be check to see what it looks like for 2016_rel1 and when the new satellite data comes on line.
By the way, my daily Google “Sea Level” News search shows that a new paper is out, all the usual outlets are featuring it.
Sea levels rose faster in 20th century than in previous 2,700 years, says study
http://www.cnn.com/2016/02/23/world/climate-change-sea-levels-study/
is listed as two hours ago.
Steve/Tony – Thanks for giving the sea level correction/adjustment/callithwhatyouwant issue some coverage. Of all the scares coming out of the “Climate Change” Juggernaut, sea level is the scariest. The spectre of coastal cities inudated by the ocean touches a nerve.
I said NOAA above, it was NASA that said 3.4 mm/yr
http://climate.nasa.gov/vital-signs/sea-level/
Here’s a story on that satellite that should come on line this year sometime:
New Satellite Collects Sea Level Data to Monitor Climate Change
http://www.voanews.com/content/new-satellite-collects-sea-level-data-to-monitor-climate-change/3170452.html
The U of Colorado data sets are not the same. The second set is GIA corrected. You may still call it fraud but here is the info.
http://sealevel.colorado.edu/content/what-glacial-isostatic-adjustment-gia-and-why-do-you-correct-it
But isn’t what is important to us, where the water meets the land? These adjustments wind up making what is being measured no longer meaningful. It is just excuses to make scary stories so that we can be robbed for our own good.
The U of Colorado data sets are not the same. The second set is GIA corrected. You may still call it fraud but here is the info.
That’s right, they are not the same. One has been bumped up around 0.9 mm/yr. As you correctly point out, part of the bump up is the GIA correction that they started a few years ago. Their link says that they did it because they wanted their graph to represent ocean volume. They said, “In essence, we would like our GMSL time series to be a proxy for ocean water volume changes” The logical question to ask is, “Then why don’t you label you graph “Ocean Volume”? And of course the answer is that sea level is scarier. After all, the late Dr. Stephen Schneider said, “We have to offer up scary scenarios”
None of us here can prove that’s why they did it, that’s a matter of opinion, but that they did do it, is a matter of fact.
Once again, adjusting sea level for GIA is like adjusting my truck’s speedometer for planetary motion.
The GIA adjustment is 100% fraudulent in this context and has no legitimate basis in a sea surface height data series.
There may be an argument for using it to calculate ocean volume or depth, but GIA is not legitimate correction for sea surface height.
You know sometimes you read things and they make you go “HUMM” . If the land is rebounding would that not put more volume in the ocean ? Would that not screw up the sat’s ergo their crappy papers are 100% A$$ brakwards !
I am curious, why would anybody would panic and scream “the sky is falling”, even for a 4.5 mm per year fraudulent rate????? I am a engineer and a landlubber… but when I visit my Mom in Oregon, and go to the beach (Astoria (Tongue Point)), the tide varies daily around 8 – 10 ft., every day. I have seen a storm surge there of 10 ft., and was told by a local, “that ain’t nothing” . For non-Engineers, 2.54 cm = 1 inch = 25.4 mm… So over my Mom’s lifetime (80 years old), 4.5 mm/year would equate to 14 inches of sea-rise, or a little over a foot. With a 10 ft. high-tide daily change, and a 10 ft. storm surge, a 20 ft. rise is normal… so a 1 ft. sea rise is only a 5% change… over a 80 year lifetime!!!! My Mom also remembers the 1964 Good Friday Tsunami (from Alaskan Earthquake) being 14 ft. at Coos Bay… So I repeat.. I am curious, why would anybody would panic and scream “the sky is falling”, even for a 4.5 mm (0.177 inches) per year fraudulent rate?????
Frank asks “why would anybody would panic and scream “the sky is falling”, even for a 4.5 mm (0.177 inches) per year fraudulent rate?” Ummmm, maybe because they are weakminded and/or get some perverse pleasure out of imagining that if we all bow to the gummint that we will be protected from this imaginary threat.
Apologies in advance for my poor joke delivery …. it reminds me of the fellow that was wearing some obnoxious thing, and when asked about it, explained that it protected him from wild pink elephants. Someone exclaimed “but there are no pink elephants within more than 100 miles of here!”, to which he replied … “See …. it works!”.
This imagined dangerous sea level rise is like a whole herd of wild pink elephants.
Dear Steve,
In the continuous series of ridiculous articles claiming an acceleration of the sea level, here is a specimen you may wish to read. A remarkable example of how to avoid taking into account experimental data.
http://www.pnas.org/content/early/2016/02/17/1517056113
Thanks for your continuous and fantastic work.
This just in:
CLIMATE CHANGE CAUSES CANNIBALISM
http://news.nationalgeographic.com/2016/02/160223-polar-bears-arctic-cannibals-animals-science/
http://media-cache-ec0.pinimg.com/736x/51/9c/d3/519cd35903e7a24849c6466fc85a1f3c.jpg
I wonder if NG has any even rarer footage of a male bear raising its young?
The stupid, it burns. So glad I no longer subscribe. And so sad to see a once great magazine, that I read from childhood, turn into such utter nonsense.
I never looked a National Geographic when I was a child. Especially not the articles about tribal Polynesian or African women. Never. Not me.
Ted, I can’t recall right now, was National Geographic the one with the research centerfold or without?
CW, I think you are confused. NG was the one that had the “Primate of the Year” issue that came out at the end of each year.
Glamour?
http://www.gossipcop.com/wp-content/uploads/2015/10/Caitlyn-Jenner-Glamour-Woman-Of-Year-Photo.jpg
http://www.glamour.com/inspired/women-of-the-year/2015/caitlyn-jenner
He or She or what ever it is now is claiming it gets more flak for being a political Conservative than for being “transgender”.
OT but if Trump can win over the Latino vote as in Nevada, he definitely has a very good change of beating Clinton. He is very very anti-AGW so he’s got my vote now LOL
Reblogged this on Climatism.
Reblogged this on Roald J. Larsen.
What happened to woodfortrees.org ? I think the watermelons got it taken down
Ok back on
I am getting old an a little forgetful. But didn’t some scientist claim just a few weeks ago that the land was absorbing all the water from melting ice caps and that was the reason that the sea level was not raising as fast as predicted.
http://www.jpl.nasa.gov/news/news.php?feature=5136
Ok so which group is lying or maybe both
It sounds like more excuses, they are making this up to explain why sea level rise is not accelerating.
“GSL rise should be accelerating catastrophically like Al Gore says but it isn’t because blah blah blah”
Hmmm… satellite MSU measurements of the lower 22 Km of the atmosphere are wrong, but they can tell the difference between 1.5 mm/year sea level rise and 3.5 mm/year?? From space! Including the effect of storms, waves and tides. How does that work? Good post, I liked it.