
The Sydney Observatory shows several degrees warming since the 1940s.
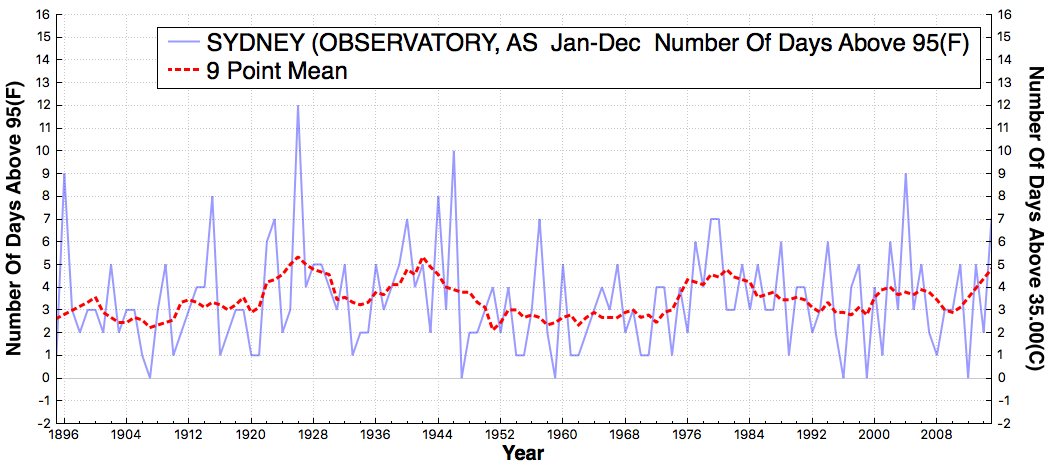
It is carefully situated next to a couple dozen lanes of asphalt, with a tall building reflecting the afternoon sun on to the thermometer.
Despite all of this, there has been no increase in the frequency of hot afternoons, which peaked in 1926.
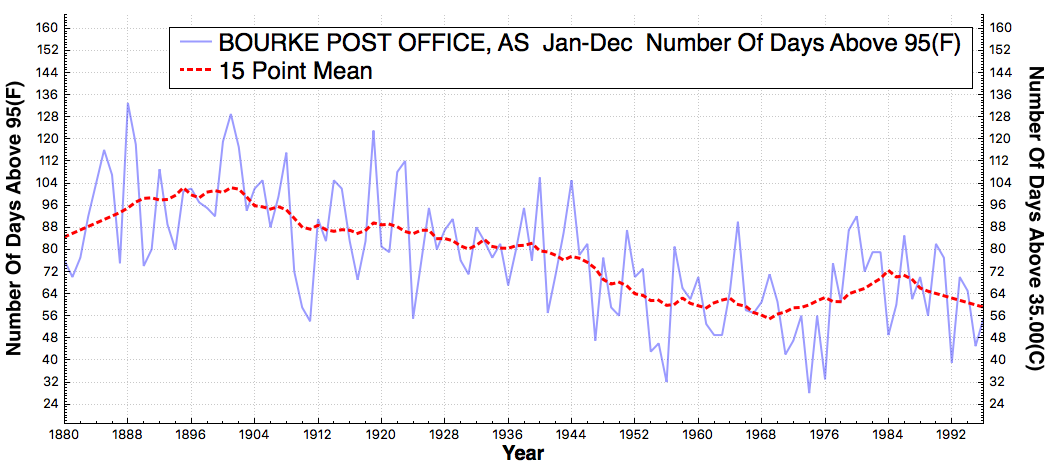
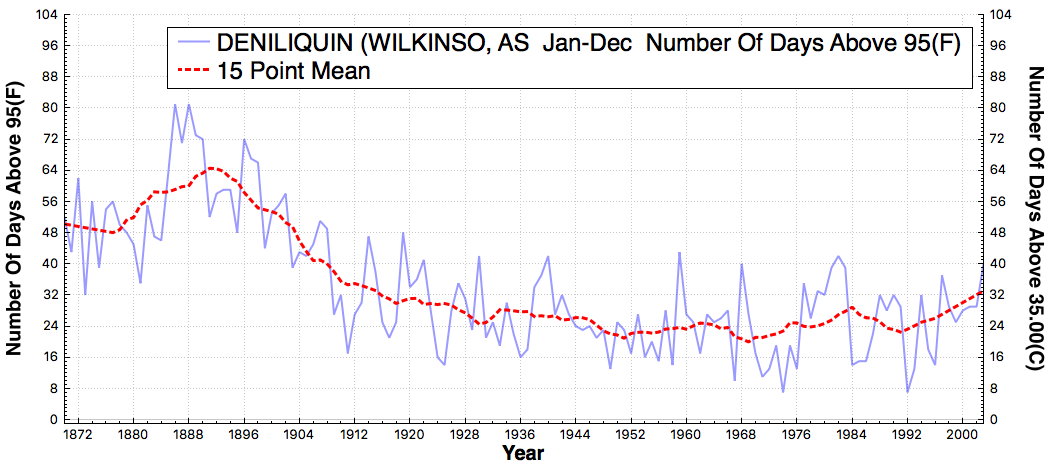
Rural stations in New South Wales show a sharp decline in the frequency of hot afternoons.
Government climate scientists prefer surface temperatures over satellites, because they can manipulate the station selection and give them the answer they are looking for.

City vs. Country….US model?
Surprise, surprise, surprise !!!!
I am going to send this to Jennifer Marohasy in Australia, an accomplished scientist at Queensland, an author in “Climate Change, the Facts 2014”, and has a very long list of accomplishments.
Her specialty is plant and water quality,. She has been fighting an uphill battle against the
orthodoxy of climate change. Quoting from her writing, (along with John Abbot)
“The theory of AGW has very little practical utility, but tremendous political value. It is a
theory that accords with the mood of our time, the zeitgeist, which assumes that man’s
greed is despoiling the earth and that political action based on a scientific consensus can
save the planet——–That is part of the reason why credible scientific rebuttals fail to achieve its
over throw.—-
—– the other is the history of science shows it is competition, not logical argument—-
that replaces a failed paradigm.”
Well stated, and I completely agree with her except for one thing. That is the word ‘theory’ which implies that data, experiments, facts etc can be explained by it. In fact, in the case of AGW, there is no valid theory, because the facts show otherwise. It is an hypothesis which at its core should be replaced or at best completely modified.
Let alone ‘theory’, it barely fits the criteria for ‘hypothesis’, if at all!
My “local” weather station. (I’m slightly inland so using Williamstown rather than Nobby’s)
http://s19.postimg.org/as7fnvb5f/williamstown.png
AndyG55, you are running Tony’s SW. I cannot yet cause am only Mac platform for company/security reasons. Check Rutherglen and send that to Jennifer also. She, JoNova, and I had quite an email correspondence about that station as I was drafting essay When Data Isn’t for my ebook. They both got lots of footnote credits.
I generated the graphs on my Mac. I just need to figure out how to release it.
I can wait til you are ready and it is easy, Tony. Can already do similar stuff, only very laboriously (and did one post late last year over at WUWT on AW’s surface station project CRN1–btw also proving your analyses are directionally correct). But have chosen to hit harder other warmunist climate targets to which my personal skill set is better suited. Academic misconduct, and all that. Direct challenges to Nature and Science. You already obliterated this target. No need to rebomb.
Hi Tony,
This is really quite strange.
The GISS mean temperature plot for Sydney now shows little to no warming between 1880 & 1995. I’m almost certain that plot showed significant warming 1-2 degC last year. I didn’t keep a copy.
Coincidence? Perhaps Congress asking about NOAA/NASA to supply all the climate data adjustments resulted in some data adjustment reversals???
http://data.giss.nasa.gov/cgi-bin/gistemp/show_station.cgi?id=501947680000&dt=1&ds=14
AndyOz,
That is very interesting. two different graphs.. investigations required.
Here’s this GISS one for comparison to the first graph posted by SG.
http://s19.postimg.org/zcslq2w4z/GISS_Sydney.png
Here is Jen’s graph of Rutherglen.
http://jennifermarohasy.com/wp-content/uploads/2014/08/Rutherglen-Annual-Max.png
Question is, why does the GHCN data only go back to 1965 ?
http://s19.postimg.org/6klu6lohf/RUTHERGLEN1.png
http://s19.postimg.org/9sqbjnar7/RUTHERGLEN2.png
Is this what you want ?
Jen’s Rutherglen
https://i2.wp.com/s19.postimg.org/6klu6lohf/RUTHERGLEN1.png
Why does GHCN only start in 1965?
wong graff……. lol 🙂
https://i0.wp.com/jennifermarohasy.com/wp-content/uploads/2014/08/Rutherglen-Annual-Max.png
Reblogged this on Climatism.
So it appears that whatever they claim as global warming is simply Urban Heat Island and some creative thermometer siting. What a farce!
Or maybe – just maybe – this is why the data are adjusted to correct for things like urban heat island effects?
Billy, according to NASA GISS own website, there are two ways to correct for UHI. You can cool the present to remove the effect. But then the temperature is not what the weather report says. Or, you can warm the past to get a trend without the UHI component. Which is what GISS says it does, using Tokyo as the example. I reproduce it in essay When Data Isn’t.
But in reality, as Tony has shown many times, the past is cooled. Backwards and wrong.
FYI, that “tall building reflecting the afternoon sun on to the thermometer” seems to be the 40 story Shangri-la Hotel in Sydney built in 1992. Aside, looks like PDO correlated to no surprise.
It is amusing to hear them say, “Well we placed the sensor 150 feet from any pavement”
http://earthobservatory.nasa.gov/Features/GreenRoof/Images/atlanta_thermal.jpg.
The same people that scream about man-made CO2 re-emitting a virtually undectable amount of heat will also tell you that steel and asphalt, that can burn at the touch, does not effect urban temperatures.
A few tenths of a degree big green global warming circle jerk doesn’t change UHI does it? To put it another way, when did a fabricated global temperature anomaly over power a local reading? Where’s the warming? Fact! There is warming in these lying bastards eyes… waisting billions that could be used for hospitals, schools or any other soical project, the political puppets at nasa and their cheerleaders should bow their heads in shame… shame on you fuck- eejits… and your abuse of power towords your intellectual opposition has been noted for all time… well done NASA scum that the world can look up to…
Supreme Court blocks Clean Power Plan
http://www.marketwatch.com/story/supreme-court-blocks-obamas-clean-energy-plan-2016-02-09
And Trump wins NH. I predict the stock market will rally tomorrow!
SG, Does GHCN get its data before or after BOM’s “homogenisation” trend increase?
This is daily data. It is not altered.
Thanks.. 🙂
Cruz comes in 3rd at 10% just behind kashich 12%. This likely means Cruz will be the GOP nominee and trounce Sanders/clinton. Already AGW is cooked we probably do not even need a Cruz to finish it off (re EPA is finished)
Over at Judith Curry’s blog Zeke Hausfather admits that they have adjusted US warming up by 100% compared to raw data. . Here’s his quote——-
“Fixes to errors in temperature data have effectively doubled the amount of U.S. warming over the past century compared to the raw temperature records.”
So how does that compare to the Watts stations used in their study? Dr Spencer said that the Watts study reduced US temps by 50%. That’s a turn around of 150% between the 2 data-sets.
Let alone ‘theory’, it barely fits the criteria for ‘hypothesis’, if at all!
The roads are at the entrance to the Sydney Harbour Bridge built in 1932. North bound traffic (left lanes) is free. Traffic went up from 11000 cars per day to 180 000 per day and with the tunnel opening in 1992, congestion eased. The step in 2000 is most likely a switch to AWS.
The ANA Hotel was built 1989-1992 . It is one the coastal side of the station where the sea breeze comes from to keep Sydney cooler than outer suburbs but its hard to see in the plot how the building affects the readings. Reflection from the Sun should affect the March & Sep maximum but nothing obvious in the data.
http://www.bom.gov.au/jsp/ncc/cdio/weatherData/av?p_display_type=dataGraph&p_stn_num=066062&p_nccObsCode=36&p_month=09
Johnlsayers.com/Stuff//Observatory_Hill.png
I’ll try to post it again
http://http://johnlsayers.com/Stuff//Observatory_Hill.png
Reblogged this on Climate Collections.