
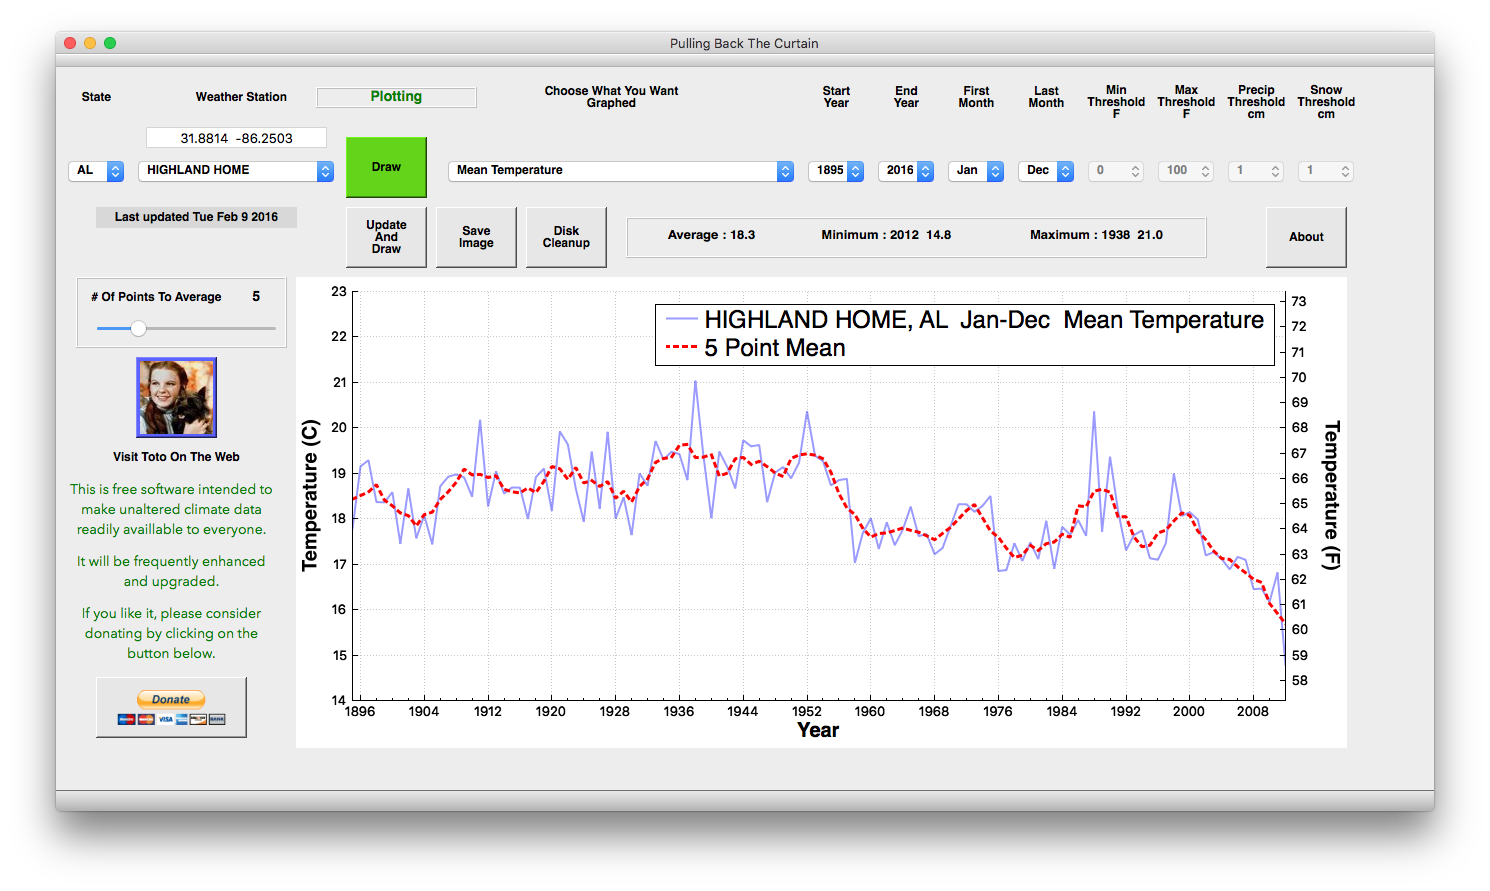
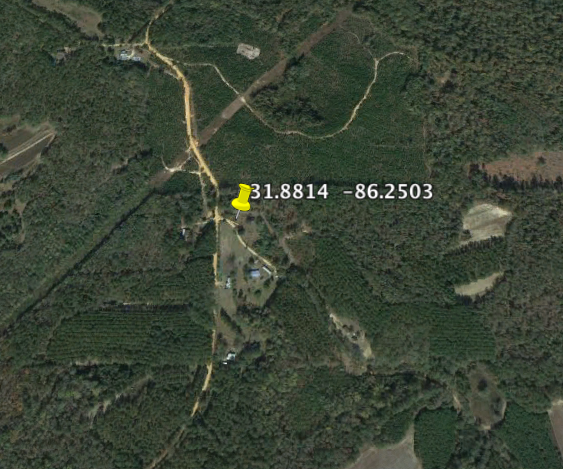
Release 1.3 adds a very important feature. Above the station name is the latitude/longitude which you can copy and paste into Google Earth, and then see exactly where the station is located.
Highland Home, Alabama shows a strong cooling trend. It is also a very rural station.
Download : PullingBackTheCurtain v1.3
V1.3 also adds Greenland stations.

It will be cold in the eastern US.
http://www.cpc.ncep.noaa.gov/products/precip/CWlink/blocking/real_time_nh/500gz_anomalies_nh.gif
Polar vortex broken.
http://www.cpc.ncep.noaa.gov/products/stratosphere/strat_a_f/gif_files/gfs_z50_nh_f00.png
http://www.cpc.ncep.noaa.gov/products/stratosphere/strat_a_f/gif_files/gfs_t50_nh_f00.png
Click.
Ren, when do you think the High blocking Calif will move to allow storm systems back in?
El Niño is weakening.
http://www.cpc.ncep.noaa.gov/products/analysis_monitoring/enso_update/sstweek_c.gif
David see the forecast stratosphere.
http://www.cpc.ncep.noaa.gov/products/stratosphere/strat_a_f/gif_files/gfs_t70_nh_f120.png
I’m a computer dummy on nearly everything except Excel so I need
to ask this question:
I downloaded the first version [V1.0] and I’ve procrastinated
since then. Now I see that V1.1 & v1.3 have the same URL address
so one must replace the other, so I assume that if I go ahead and
download v1.3 it will automatically replace the first version?
Or will I have two separate apps on my system? Which prompts me
to ask, do I need to uninstall V1.0 ? I’m guessing it will ask me if I
want to replace the existing file.
Steve,
If you just downloaded the zip file of the 1.0 version, extracted the files from it into a folder and ran the executable*) like I did, the program is not “installed” as Windows uses the terminology. It has only been copied to your computer. Since I don’t think there is a reason to keep the previous version(s) the clean way is to delete all files in that particular folder and then download and extract the newest ones into the same place. No need to “uninstall”.
——————–
*) PullingBackTheCurtain.exe
Thanks, it’s up and pinned to the task bar.
The only reason I am not using the installer is because some Chinese company is creating a fake positive match. You will have to manage the zip files yourself.
I saw why you did it but I actually prefer it that way.
Neal Stephenson’s In the Beginning… Was the Command Line is somewhat obsolete but many of the observations he made there are just as true today as in 1999.
Ive downloaded and unzipped the file. When i click on th exe file it tells me “Unable to find application to perform this action”. Any thoughts?
Haven’t downloaded any of it yet. I have windows 10 and saw some of the messages and besides no matter how good the programmer is it seems there are always some bugs to work out and expansion of what the program can do as one goes along. Being like you, a “computer dummy” and naturally conservative in this area anyway, I have just waited and will continue to wait a little longer. I guess it’s just the way I am. Never have nor will buy the first year of a new model car either unless I hit the lottery.
Ha ha ha ha ha ha ha ha ha! I have a few computer Geek stories to tell.
The warnings you are heeding are as valid as listening to Michael Mann’s warnings about climate.
There is nothing wrong with the software. Anti-virus companies are a protection racket.
“Protection Racket”
You’re probably right, I either had McAfee or Norton and I still got Optimizer Plus on my old machine.
SG
I always figured that about the antivirus companies. I have often wondered which they spend more time and assets on? Creating new viruses or the fixes for them? Don’t get me wrong, I’m looking forward to downloading your new program and I trust your competence and integrity. But it will be Friday when I do so I can’t be called away in the middle of something if I have issues with Windows 10 or my Avast antivirus. I use Avast because unlike the other two more predominate antivirus programs (McAfee and Norton) I’ve never had any real issues with it. But I know some people that rely only on Windows Defender and the antivirus program that is included with Comcast cable and seem to get along just fine.
Of course. They pay hackers to create viruses in the name of anti-virus research.Basically the mafia.
Also a way to keep small developers out by blocking “unrecognized” software.
https://coloradowellington.files.wordpress.com/2016/02/nice-little-machine.jpg
Wow! You guys are more cynical than me. I didn’t think that was possible but I love it.
Speaking of el Nino, I hope everyone out there has survived the catastrophic effects. Here in Bakersfield our seasonal rain total is about 1.7″. Another tenth or so and we will be beach front property. When will these disasters end? Y2K, Ebola, nuclear winter from burning Kuwait oil wells, no more snow in New York, all the Caribbean isles under water, George Bush, when will we cut a break?
Don’t worry about who they will blame. It’s looking like next year there will be a Republican POTUS then everything can be blamed on him. Now if by crook or hook some socialist democrap ends up in the oval office the press is going to have problem though there is no doubt some will still try to blame Bush for all our woes. BTW did anyone notice that anyone that according to Huffpo anyone that supports Trump is a racist scumbag?
I don’t know, they sure like the mileage they are getting out of W. Be hard to give up that addiction, change their stump answers. That means you read the HuffPo?!?!? So YOU’RE the one!
It’s not fair to blame W for everything. After all, he was kind of boxed in by the previous actions of Clinton. Of course Clinton was just reacting to what H.W. left him — and H.W. was limited because of Reagan. And Reagan….(snip)… so if only Adam had not eaten that fruit, well, things would be a lot better!
🙂
Nope I don’t read Huffpo. There is a story with link on it on The Blaze.
RAH said at 4:49 pm
… It’s looking like next year there will be a Republican POTUS …
I wouldn’t count on it.
Republicans are the party of the rich and make sure there are enough rich people to vote them into office. Democrats are the party of the poor, what do you suppose they do?
President Obama and the Democrats have made enough people dependent on government hand outs to form a constituency that’s hard to beat.
I would bet a little on it but not give any odds. I figure it’s better than the odds you get on a black or red bet on the roulette table at this point.
Tony, the station coordinates are a fantastic feature. I just ran it for Boulder and I have a question:
The program displayed this location from the NOAA data: 39.9919, -105.2667
The NOAA website’s station history page gives this location: 39.992772,-105.266163
Here’s where Google Earth overlays the respective coordinates on the satellite picture:
https://coloradowellington.files.wordpress.com/2016/02/boulder-weather-station-site.png
I’ve never seen the station on the NIST campus but it seems the history page location is right.
The Google earth locations seem to be accurate within a couple hundred feet. I ride my bike past there almost every day.
That I understand but the two sets of coordinates are still different.
I’m puling the coordinates from NCDC
CW, that is unfortunately not unusual. I did a study of the surface stations CRN1 sites using GISS. Of the four urban CRN1 sites, Corpus Christy could not be used because the raw data file had a different lat lon than the homogenized. Could not tell if a goof or a station move, so dropped from the analysis. If the small samplemis representative of the station population, then the location error rate is 7%. Good enough for government work?
Thanks, Rud, that doesn’t surprise me. And yes, it’s close enough for government work. What is a measly 7% to a government employee coming to work every day to engage in a heroic planetary struggle against evildoers who deny climate? And what is it like to sit at one’s desk to try and save the planet before lunch break?
On that picture, where exactly is the weather station.?
If Google Earth is accurate, neither rooftop nor bare ground are the correct location.
We know it’s not accurate. I think Tony knows where the actual station is and it is not on the roof. I just found it curious that the NCDC database has slightly different coordinates than the NOAA website. It seems that whoever put together the NOAA page did his own measurements but you would think that with billions that go into climate research and the claimed urgency about AGW they could get at least the locations in the NCDC database right (see Rud’s comment above).
Suggestion: txtStatus.text=”Ready” as the last line in the plotting sub (to replace “Plotting”)
My experience is consumer GPS is off by several hundred feet a lot of the time (i.e., MapQuest locations). Regardless, wherever you plop the sensors on that campus the answers will obviously be bogus.
I apologize if you have already answered this, but are these temperatures raw or adjusted (manipulated) values? Thx.
Raw daily temperatures
Any plans to offer the option to display temperatures in degrees Celsius, for those of us who are not American ?
Gives both already.
I can only see ‘Min Threshold F’ and ‘Max Threshold F’
Look at the graph, Richard. Celsius scale displayed on the left, Fahrenheit on the right. The only thing I can think of you can’t do is setting the thresholds in Celsius.
Yes, that’s what I was referring to. I cannot actually run the programme to generate a graph. When I try to do so, Norton Sonar deletes the executable (as I recall, on the grounds that the programme is only a few days old, and has too few users)
Let me guess … Norton also contributes funds to planned parenthood.
OK, I have confirmed that Symantec (who own Norton) are indeed a Planned Parenthood contributor. I was just struck by the idea of deleting a program simply because it is too new and used by too few as being similar to the idea of aborting an unborn child.
How dare they use a station site, surrounded just by vegetation! Especially when we need to convince all the yokels out there that there is runaway warming.
If you build a 12 lane super highway through Highland Home, next to an airport runway, and surround it with skyscrapers, you might get a more accurate reading. Otherwise, we need to expunge that data!
Don’t fret. Plenty of good old concrete on that campus to adequately pad the numbers.
You bring up a very good point about the temperature history from any climate network station.
One aspect of the historical temperature that is hard to pin down is how a site’s microclimate changes with time. Not just buildings or roads, but also trees and vegetation. For example, a site may have lived near a forest for 20 years, then the forest was cut down and became an open field. The sudden change in microclimate would definitely impact the readings. I suspect we see this local effect in a lot of the global historical temperature records.
Downloaded 1.3. Set Win7 Firewall to allow pullingbackthecuratain.exe and set Norton SONAR to allow it as well. The program runs, I click “Draw” and it shows “Download Started” but nothing ever happens after that. Something is still blocking the download. Maybe one of the dll’s needs to be allowed?
Try Qt5Network.dll
Found that Win7 Firewall only allows executables, so I could not add the dll. Norton SONAR did allow me to add the dll, but it had no effect. So far no luck. Will keep trying.
Tony, FYI, see my note to rogallad below. I figured out my problem.
try clicking update + draw
Thanks for the suggestion rogalland. I already tried that many times to no avail. I finally figured out my problem by process of elimination. It turned out to be my fairly new high speed cable modem/router. The router firewall default was set to “medium” protection. I found that I have to lower it to “low” protection in order for FTP to work. I don’t like leaving it on “low”, so I only lower when I need to use FTP.
OK, cool.
After Norton Sonar deleted the .exe file, I told it to restore and ignore this file (under Options) and it now works fine (I did ‘Update and Draw’ also once I had the program started)
Tony, thanks for the most excellent tool; + you must have read my mind regarding precise locations of stations; thanks again
Works fine as/with wine in linux.
Version 1.3 work fine on my box – Windows 7 and Firefox.
The more temperature data I stare at the more I am amazed at how stable temperatures are over the relatively short time data is available – just with regard to absolute values. With all the talk of climate change, man-made and otherwise and of course man-made global warming from CO2, you’d think think there would be greater delta Ts. The ’30s were real whopper years – highs, lows, wet, dry, you name it. But when I graph data I mostly see noise about zero and UHI. Catastrophe not much.
Hmm, even NOAA’s homogenized/pasteurized data show an 1895-2014 cooling trend for the state of Alabama:
http://www.ncdc.noaa.gov/cag/time-series/us/1/0/tavg/ytd/12/1895-2016?base_prd=true&firstbaseyear=1901&lastbaseyear=2000&trend=true&trend_base=10&firsttrendyear=1895&lasttrendyear=2016
Max temps and cooling degree days show an even bigger drop.