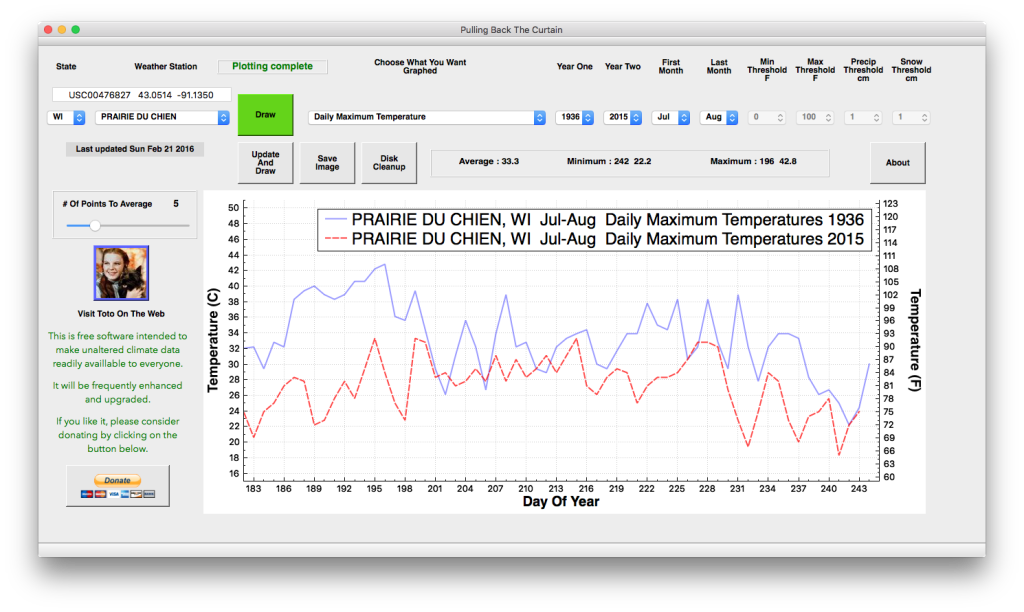
An exciting new release for Windows, and the first Mac version.
Version 1.6 allows you to do daily comparisons between two years, like the one below – which shows how incredibly hot the summer of 1936 was.
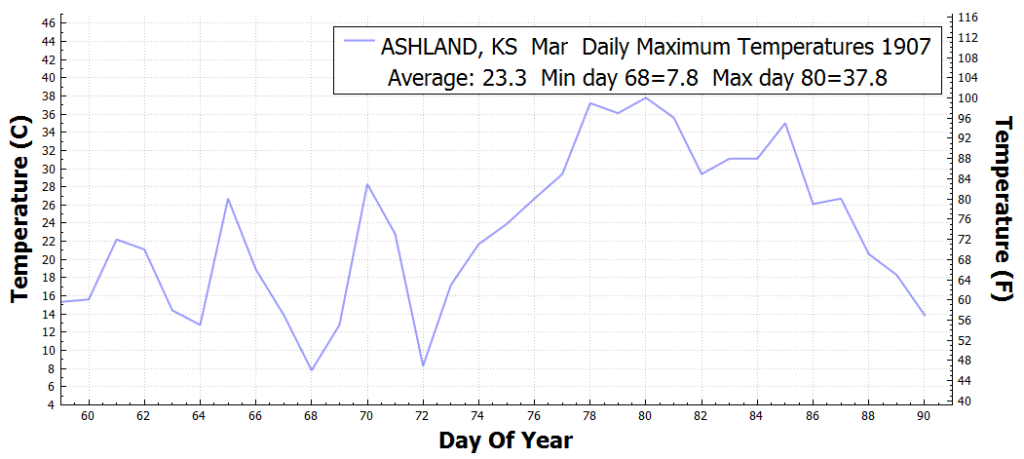
If you select two years to plot, you get a graph like this, which shows the record hot months of March 1907 and 1910.
If you select only one year, you get the average, minimum and maximum for the time period graphed..

This plot shows how Wisconsin summer temperatures peaked in 1901, and bottomed out in 2009.
Mac download :
Windows download the zip file by clicking here.
Or alternatively replace these two files in your current directory:
PullingBackTheCurtain.exe us_stations.txt
As always, the software is completely free and contains nothing nefarious. Some people get warnings from their virus protection extortion software.


Doesn’t seem to work with Mac gear…
Thanks Steven! Amazing work you have done here. Really appreciated. Time to hit the tip jar!
You need a link at the top or on the right of your website with the Pulling back the curtain software!
That is great stuff! I used to have to go to the NWS Library and hand search the temperature data state by state, year by year in musty old volumes. Was just doing it for fun, no one was paying me to do so.
But even using that crude, low tech method of getting data, I was floored by the 1930’s and all the 110+ degree days in places that now seldom reach 100. Saginaw, MI was a prime example, got up to 111 degrees and averaged 106 for an entire week during July 1936, when now a 95 degree day is infrequent.
I have not had time yet to use the downloaded software, but I do have a question. Does the data come un-“adjusted”?
Yes!
Thanks, Steven aka Tony, for your efforts to “pull back the curtain.” Fifty-five years ago, in Jan 1961, President Eisenhower warned us what we will find:
The research funds Eisenhower set aside to protect this nation from Soviet domination being used by an elitist group of scientists to take control of US policy:
https://m.youtube.com/watch?v=GOLld5PR4ts
The AGW scam shows the National Academy of Sciences using annual review of budgets of federal research agencies to direct US funds to support UN’s Agenda 21 for control of the world.
Ted Cruz and Donald Trump should stop fighting and join forces to:
1. End NAS and UN control of US policy,
2. Restore integrity to public science, and
3. Constitutional limits on US government.
Congrats Tony.
Awesome work.
Thanks!
Great work, Tony, but many Boulderites including NCAR scientists would strongly disagree with “the software contains nothing nefarious”.
How could it not be nefarious if it contains data contradicting Progressive social efforts?
Thank you, sir. Mac version is AOK!
Any plans to make the “corrected” data also available so that we can run comparisons? In any event, many thanks for your work to provide THIS !!
I might do that at some point, but it requires a different data set.
I’ve mentioned this before, but the BOM tool allows that, if you haven’t used it, it’s pretty good. Not the best interface, but it works.
https://tools.ceit.uq.edu.au/temperature/index.html
While it was created to debunk deniers, I find it quite useful for comparing data and the changes.
Agreed, Awesome work Tony!! I haven’t had any issues at all with the program, I’ve found the software very handy and interesting, I will get around to setting you up with a few drinks after the holidays.
I’ve just one question, when the data is downloaded can it be used in a spread sheet? When I notice some spikes and blips and want to look into them further out of interest and compare them with other data for example lunar/tidal, is that possible?
Just a suggestion, it would be great to have a ‘save data’ option.
Thanks again, great work 🙂