
It doesn’t matter how beautiful your theory is, it doesn’t matter how smart you are. If it doesn’t agree with experiment, it’s wrong.
– Richard P. Feynman
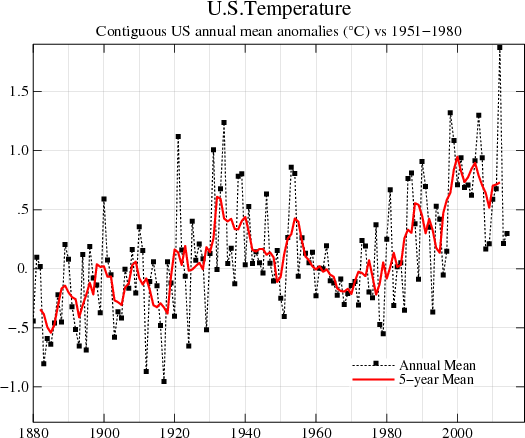
The most complete and accurate temperature data set in the world – by far – is the NOAA United States Historical Climatology Network (USHCN.) It consists of ~1,218 stations spread relatively evenly across the US. NOAA releases graphs like this to the public, which show about 1.5F warming over the past century.
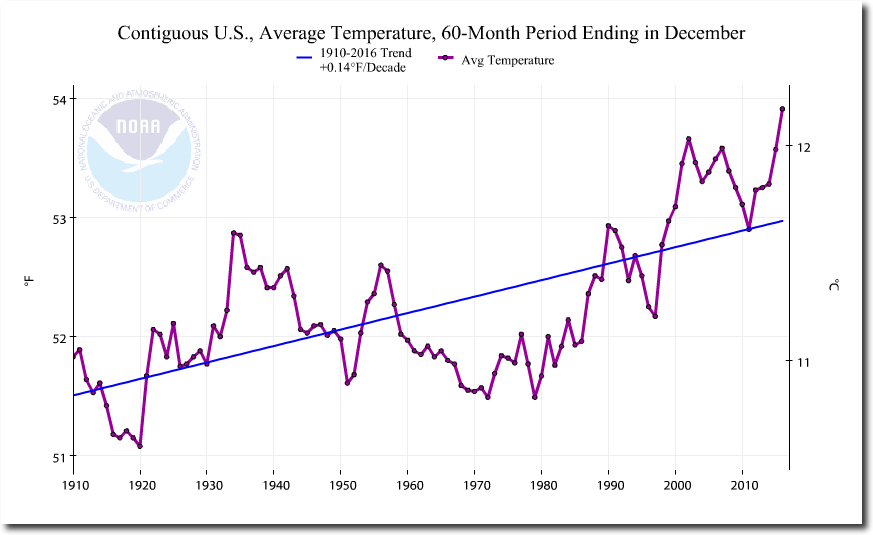
Climate at a Glance | National Centers for Environmental Information (NCEI)
Unfortunately, the graph is fake. The USHCN station data shows that the US has cooled over the past century, and NOAA massively tampers with the data before they create their graphs. The blue line below shows the actual measured (Raw) data.
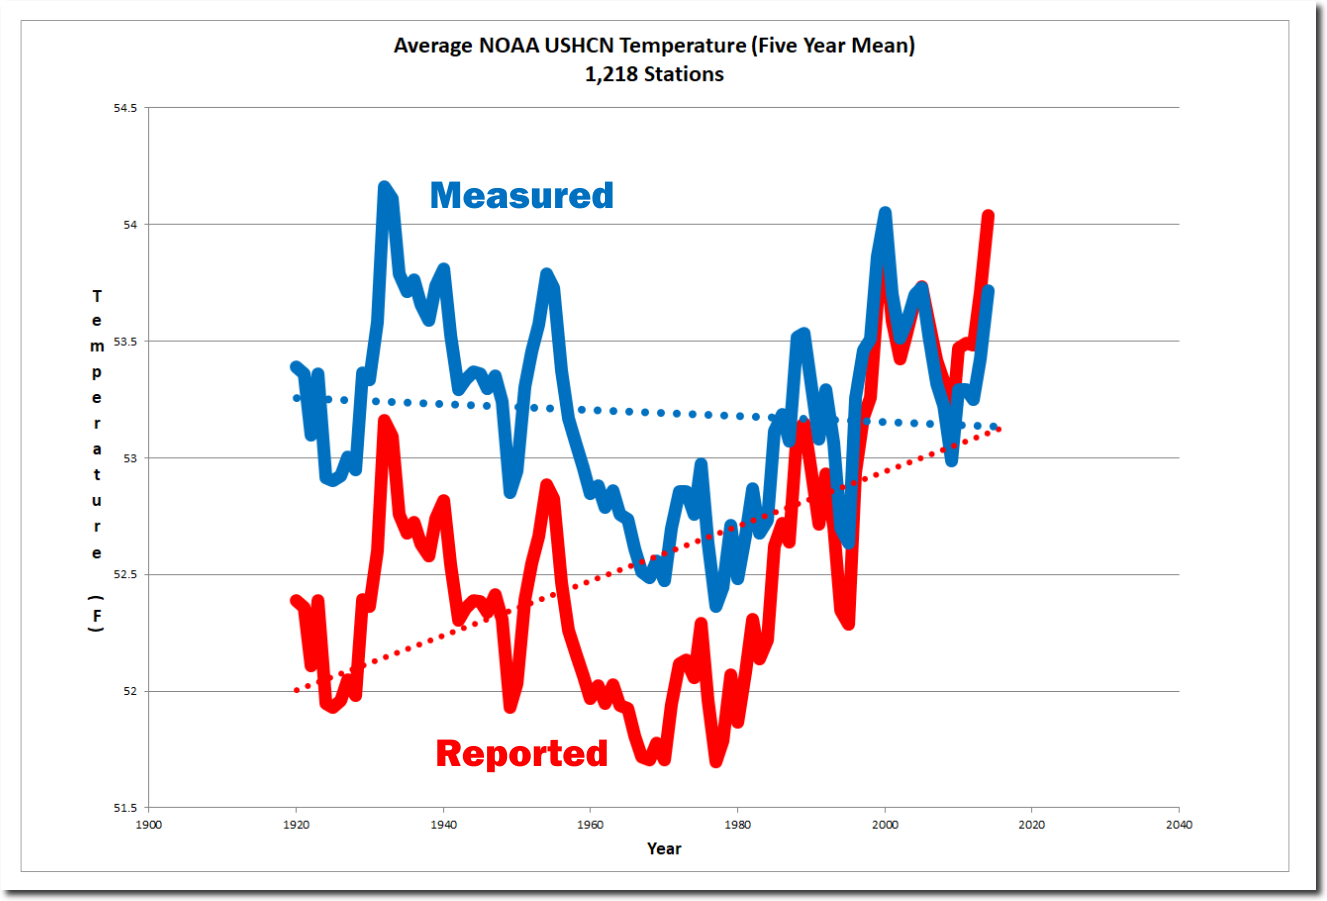
NOAA alters the temperatures in a spectacular hockey stick of data tampering – and turns cooling into warming.
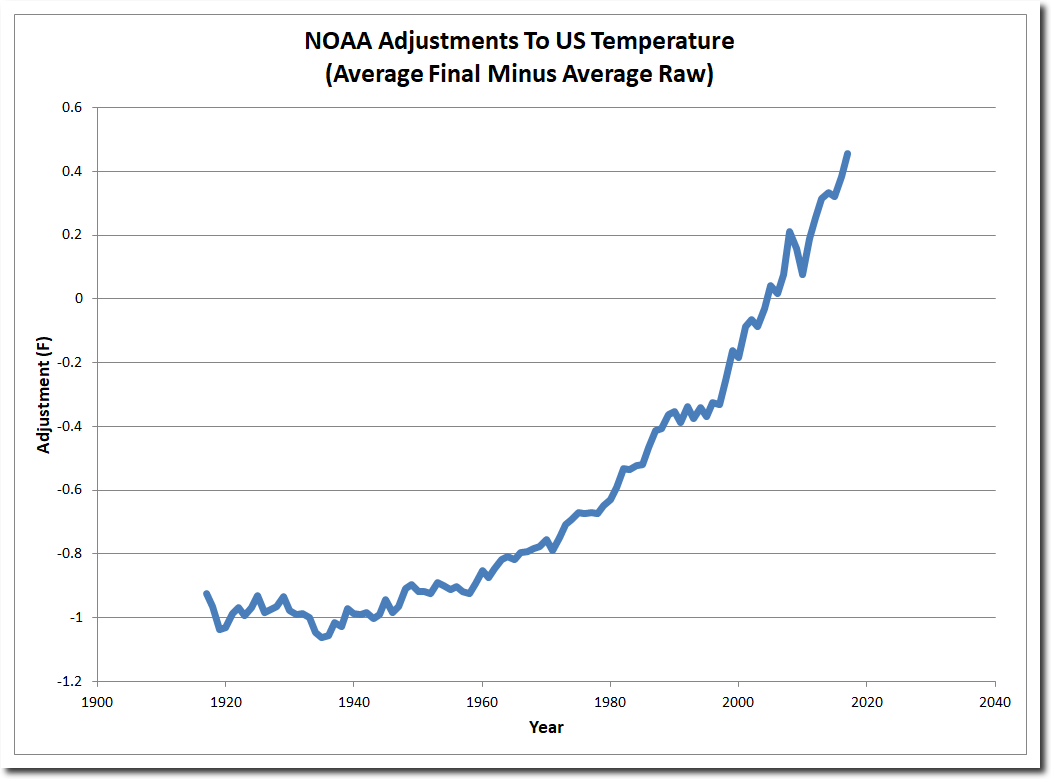
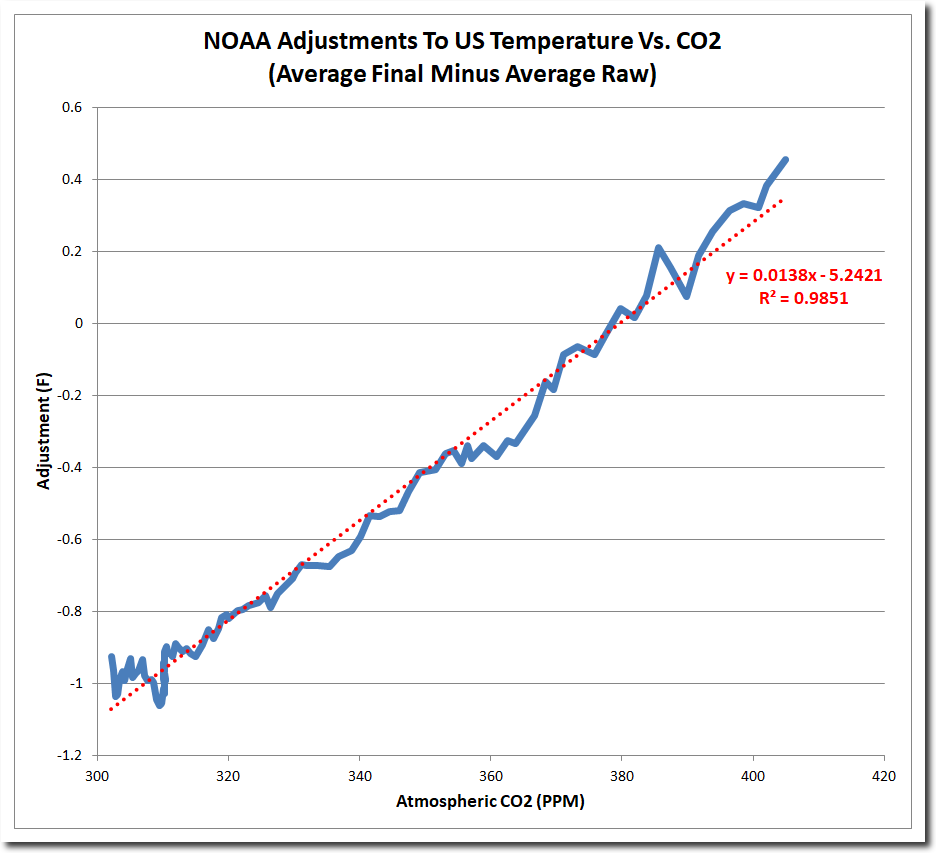
In order to keep the data tampering philosophically pure, NOAA tampers with the USHCN data precisely in line with their CO2 warming theory.
Most of the recent data tampering is due to simply making up data. If station data is missing in a particular month, NOAA fabricates data for that month. In 1960, about 10% of the data was fabricated, but now about 42% of the data is fabricated.
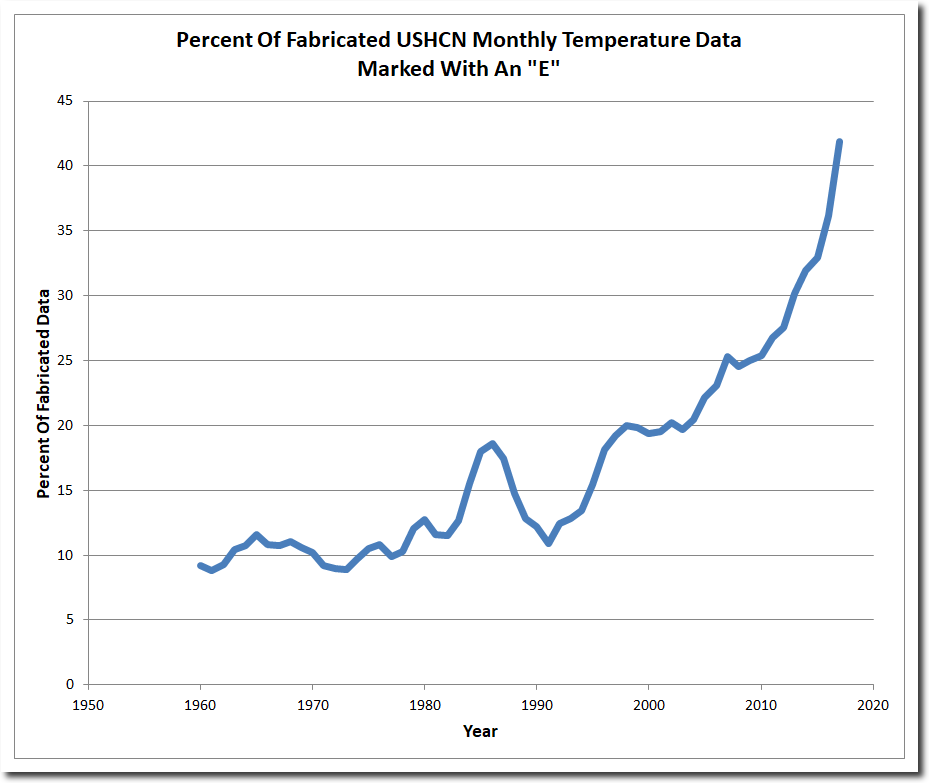
When people make up 42% of the data, they can get any shaped curve they want. This sort of fraud appears shocking, but is standard operating procedure for government climate scientists. NOAA and NASA know perfectly well that the US was not warming.
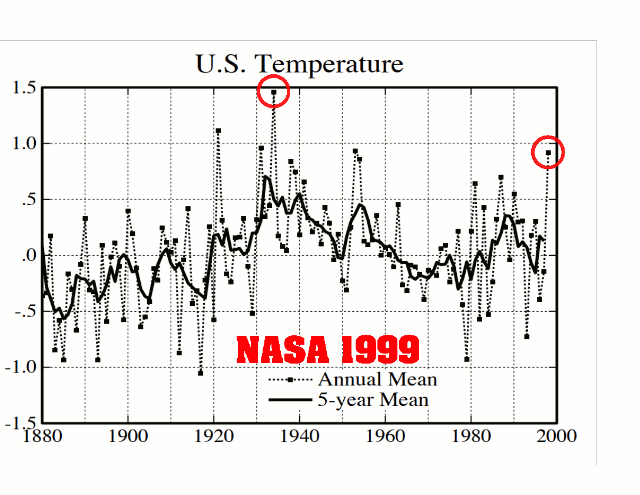
Whither U.S. Climate?
By James Hansen, Reto Ruedy, Jay Glascoe and Makiko Sato — August 1999
Empirical evidence does not lend much support to the notion that climate is headed precipitately toward more extreme heat and drought. The drought of 1999 covered a smaller area than the 1988 drought, when the Mississippi almost dried up. And 1988 was a temporary inconvenience as compared with repeated droughts during the 1930s “Dust Bowl” that caused an exodus from the prairies, as chronicled in Steinbeck’s Grapes of Wrath.
in the U.S. there has been little temperature change in the past 50 years, the time of rapidly increasing greenhouse gases — in fact, there was a slight cooling throughout much of the country (Figure 2).
NASA GISS: Science Briefs: Whither U.S. Climate?
U.S. Data Since 1895 Fail To Show Warming Trend – NYTimes.com
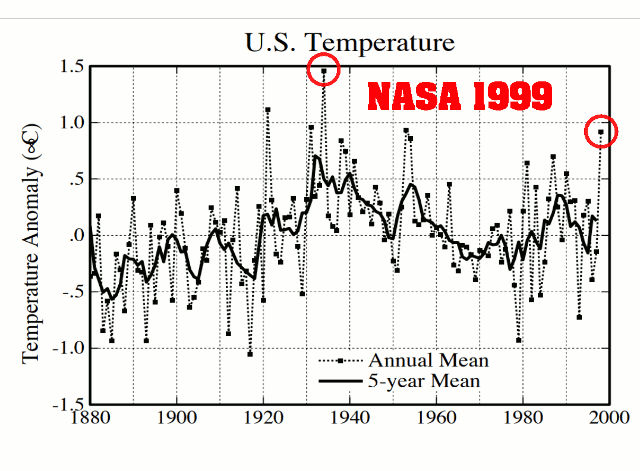
The 1999 NASA US temperature graph showed the US cooling since the 1930’s, but by 2015, the 1930-1998 cooling was turned into warming.
This didn’t happen all at once however. In 2001, NASA had removed all of the 1930-1998 cooling, but hadn’t yet turned it into warming.
The climate is not being cooperative with their scam. It is difficult convincing frozen people that they are burning up.
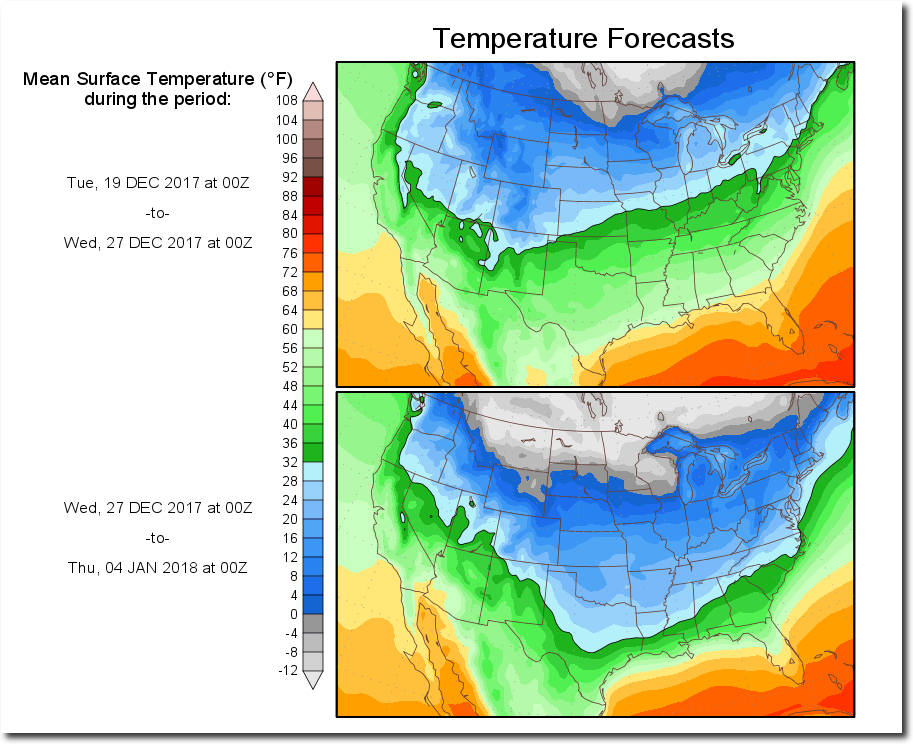
10-Day Temperature Outlook for the Conterminous U.S.
“With four parameters you can fit an elephant to a curve; with five you can make him wiggle his trunk”
- John von Neumann
