Arctic Sea Ice Volume Highest In Eleven Years

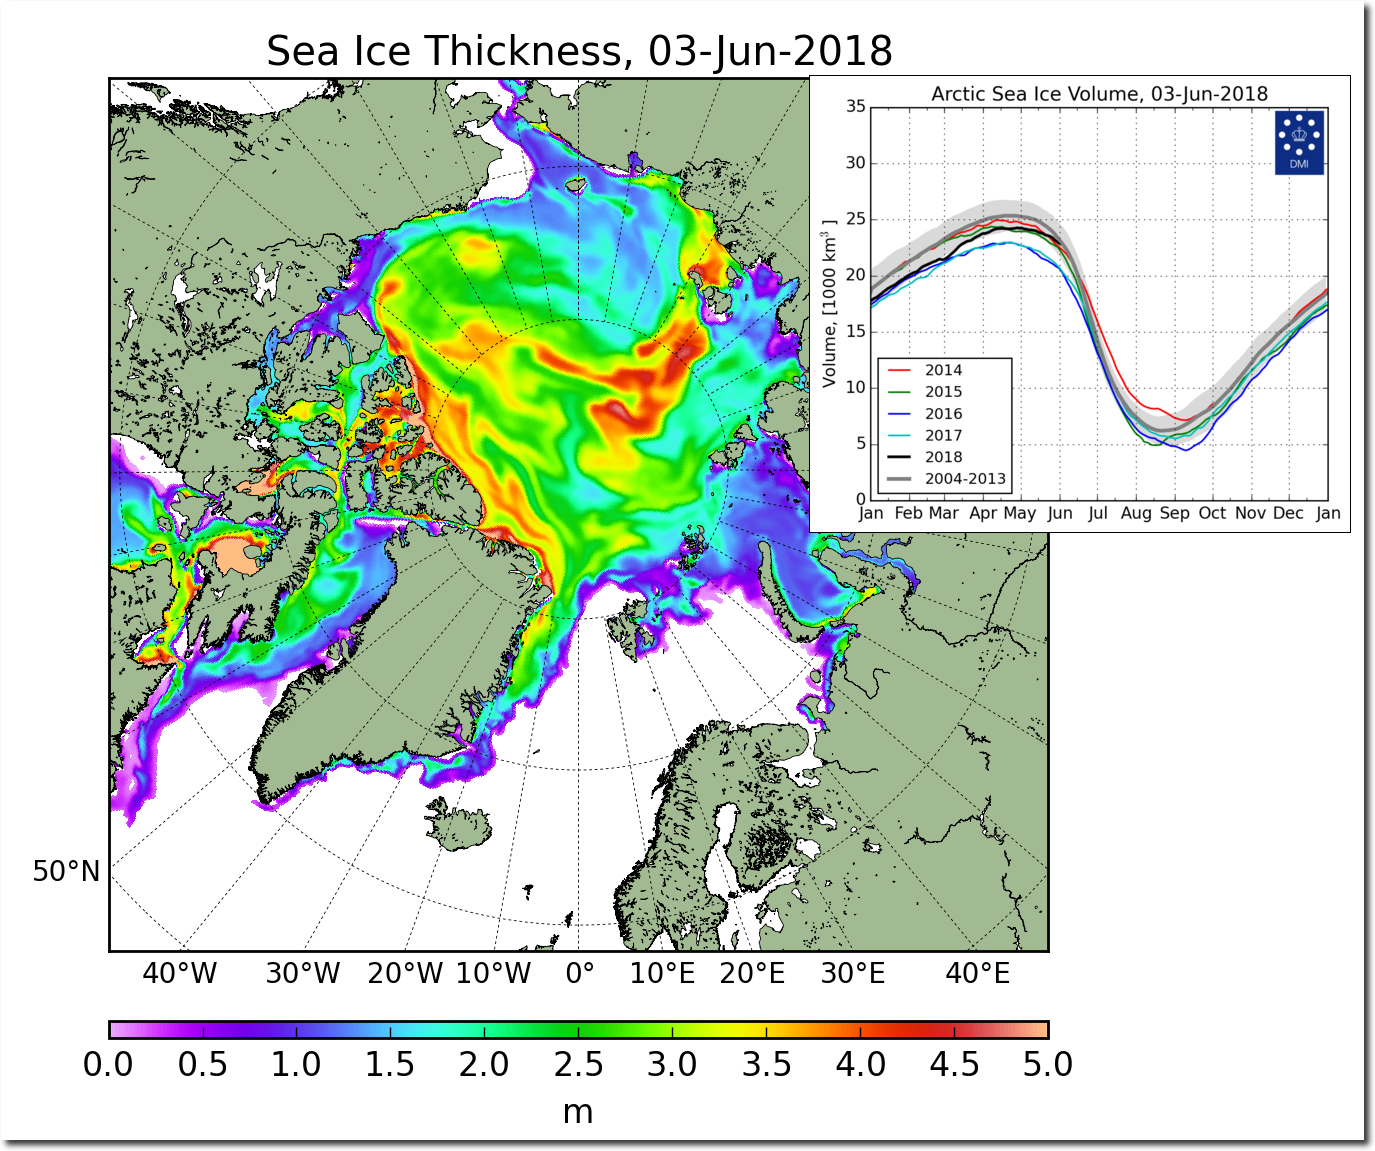
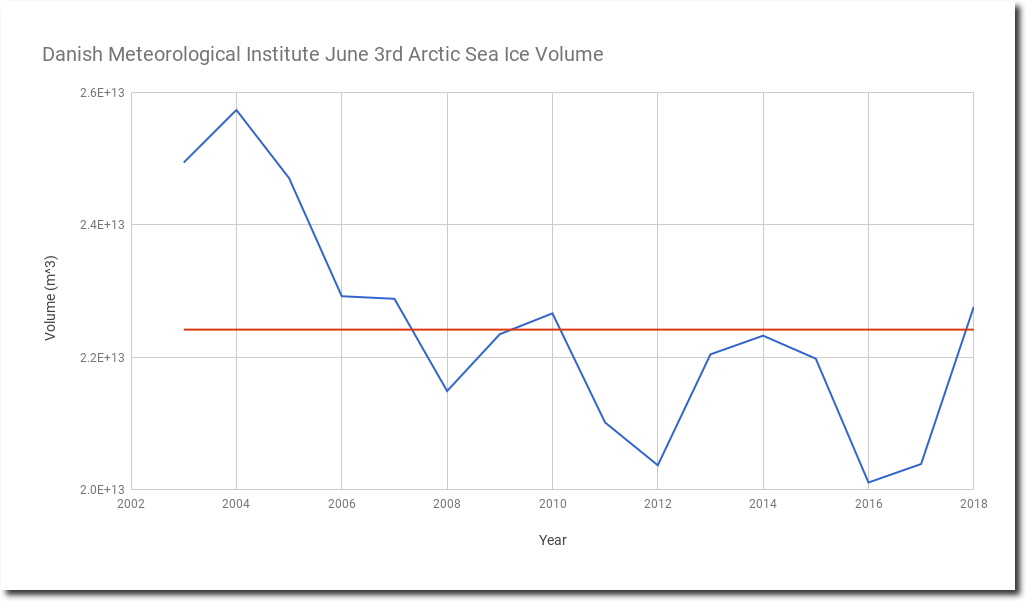
According to the Danish Meteorological Institute, Arctic sea ice volume is highest for the past eleven years and above the fifteen year mean since the start of DMI records in 2003.

http://ocean.dmi.dk/arctic/icethickness/txt/IceVol.txt    Spreadsheet

FullSize_CICE_combine_thick_SM_EN_20180603.png (1337×1113)

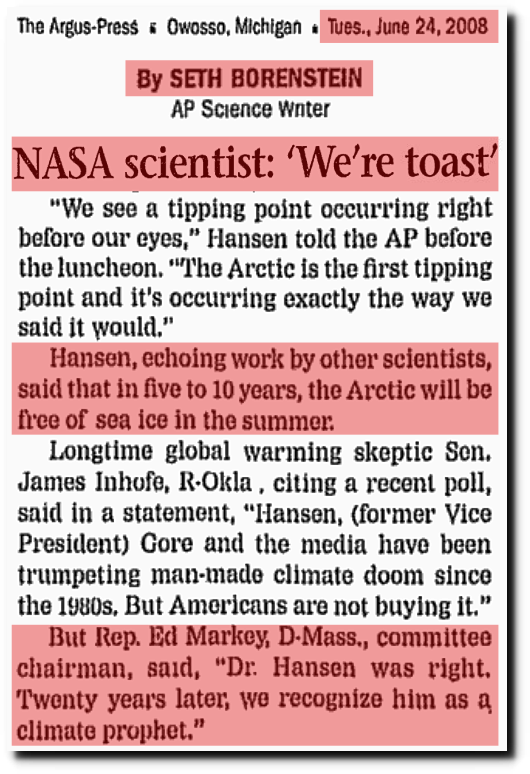
But fear not climate alarmists.  Your #1 prophet says the Arctic will be ice-free in a few weeks. He only needs to melt 22.8 trillion cubic meters of ice, with temperatures far below normal, and far below the freezing point.

The Argus-Press – Google News Archive Search

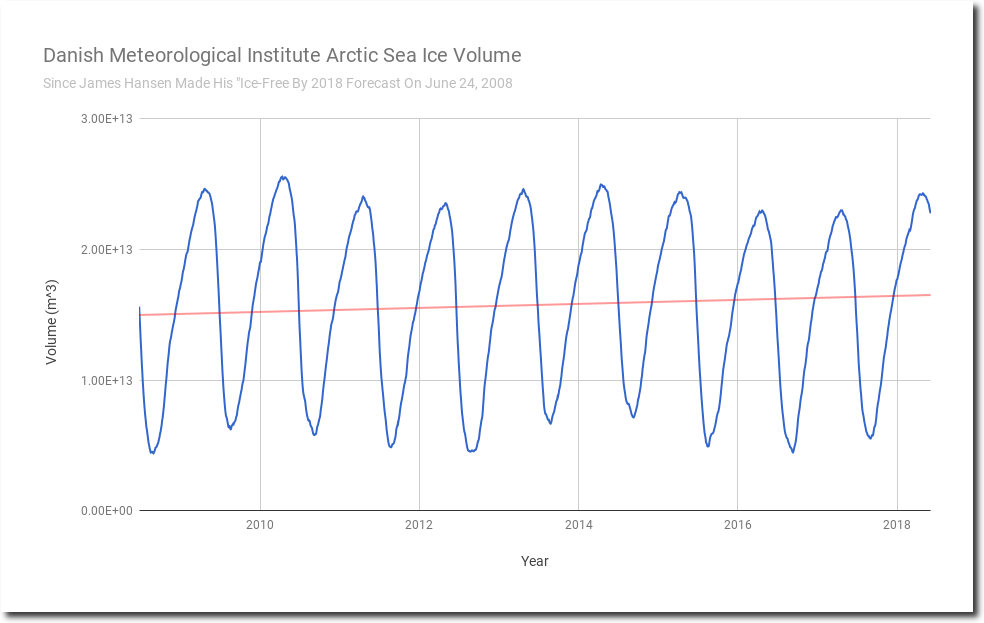
Here is what Arctic sea ice volume has done since the day Hansen made that prophecy – “echoing work by other scientists.

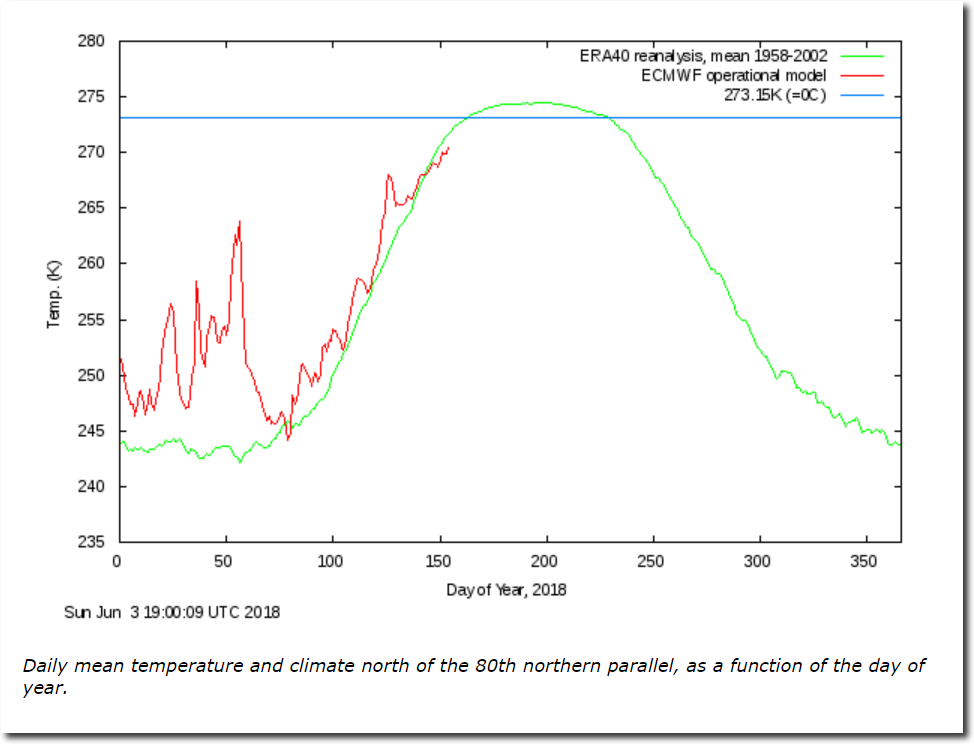
The North Pole normally starts melting this week for 70 days, but looks like melt will be delayed again this year due to below freezing temperatures.

Ocean and Ice Services | Danmarks Meteorologiske Institut

And with Reggie’s current legal problems, he probably won’t be able to help out with his blowtorch.

This entry was posted in Uncategorized. Bookmark the permalink.

45 Responses to Arctic Sea Ice Volume Highest In Eleven Years

  1. Robert Twic says:

    I luv the way U Marshall Your Real Data (- Called FACTS-) Steve that basically Crushes All the Climate Modelers into the Ground!

    • Craig Thomas says:

      Oddly, the DMI information used in this post is *modelled* data, not measurements, which makes your comment very special.

  2. Tallbloke says:

    Can we have X-axis years please.

  3. AndyG55 says:

    Also look at the “melt from maximum”

    Its really struggling to melt this year !!

    Slowest melt since 2004.

    • AndyG55 says:

      vertical units are km³….

      • Andy says:

        Let’s see how it does in June and July as those are the two months when volume decreases the most in the year.

        Would be good to revisit in October.

        Andy

        • AndyG55 says:

          You aren’t paying attention, are you, little andy. !

          Volume is above ALL of the last 10 years and will pass above 2006 and 2007 in the next few days.

          The melt trend is distinctly downwards.

          Although extent is still down a bit, the ice is thick and compressed and most importantly, is not being pushed down Fram Strait as much as in previous years.

          This is a sign the AMO is turning.

          It will be fun watching the ice-worriers over the next few years.

          But you won’t be visiting then, will you, little andy-troll. You will just crawl back under your rock and disappear.

          • Andy says:

            I’ve been visiting for a long time and will keep visiting whatever the values.

            My point above was that the volume declines massively in the next two months, so even high values at this time tend to merge together. Therefore there is nothing unusual …. yet

            However, the spatial distribution of ice thickness shows more thick ice on the Siberian side and this, rather than total volume, might slow down ice rate loss extent wise.

            So worth watching.

            Andy

          • AndyG55 says:

            Only time you visit is to try to push mindless Arctic sea ice propaganda.

            At least be honest about that. !!

  4. Jimmy Haigh says:

    Can you give us any more info on Reggie’s “legal problems”?

  5. Lasse says:

    Low ice cover does not imply high inflow of heat in the Arctic.
    One might state the opposite.
    Stabilising not destabilising. That is good news for planet but bad news for climate developer.

  6. lance says:

    To quote from the movie JAWS….”your gonna need a bigger torch”

  7. Steven Fraser says:

    This year is still #6, but approaching the next two years above it rapidly.

    Since the DMI ice volume decline this year is only about half the average decline, I expect That 2018 will rise above those years in the next few days, Making at #4 for the date .

  8. arn says:

    Arctic sea ice volume prooves the new ice age theory..oops,
    my fault.
    I forgot they traded the ice age scare for global warming in the meantime(without any resistance or discussion
    from the ice age climate scientists as your global warming scientists have been your ice age scientists.They just changed their minds 180 overnight the same way hundreds of german nazi scientists changed not just their minds and ideologies but also citizenships when they were secretely imported to the USA via operation paperclip).

    And they are now as right as they were during the ice age scare.
    ((maybe someone should ask the leaders of the only science on planet earth that is as almost as scientific as voodoo why there never ever,as compelling logical result of the transition from ice age to AGW,
    a vein/branch of climate scientists came into existence that argued that the effects of ice age and AGW would neutralize each other?
    The answer is simple-this was never about science but about agenda.

  9. esalil says:

    From the data http://ocean.dmi.dk/arctic/icethickness/txt/IceVol.txt I picked up the highest and the lowest ice volume of each year and from the highest value I subtracted the lowest value to get the total amount of melted ice of each year. The result is following:
    2003 2.24
    2004 1.90
    2005 1.99
    2006 1.86
    2007 2.01
    2008 2.00
    2009 1.84
    2010 1.98
    2011 1.91
    2012 1.90
    2013 1,79
    2014 1.78
    2015 1.95
    2016 1.82
    2017 1.75
    There is a clear trend of diminishing the amount of melted ice i.e. diminishing of the amount of heat available in the arctic region. Someone can maybe find whether this is due to the air temperature during the melting period or due to the SST of the arctic sea.

    • gregole says:

      esalil,

      Nice work, but please consider, (and note that I am no expert…) that arctic ice is also subjected to wind action which can blow bodies of ice south where it melts in the warmer waters south of the arctic circle.

      This action varies by season with 2012 having an anomalous (and powerful) summer arctic cyclone that greatly contributed to the loss of arctic ice for that year.

      And yes, prevailing ocean currents certainly do melt arctic ice bottom up; others on this site are far more expert than I at that aspect of arctic ice melt.

    • AndyG55 says:

      Graphically , except I use Mkm³ on the y axis

  10. esalil says:

    Sorry, I forgot to add e+13 to the figures above

  11. garyh845 says:

    However, DMI still has tthis absurd item posted on it’s website:

    During the past 10 years the melting of sea ice has accelerated, and especially during the ice extent minimum in September large changes are observed. The sea ice in the northern hemisphere have never been thinner and more vulnerable.

    I’ve been going round and round with them, via email, for about a month and a half now. They don’t seem to understand numbers:

  12. AndyG55 says:

    Just a point to Tony, if I may.

    Linear trends on cyclic graphs are tricky things.

    You should only ever really go from peak to peak or from trough to trough, otherwise the cyclic nature introduces non-existent trends.

    Take for instance this simple sine curve, calculate the linear trend here, and its a distinct positive trend

  13. AndyG55 says:

    What I’m saying is that your DMI trend graph should look like this

    • tonyheller says:

      My DMI graph is from the date of Hansen’s forecast. It is exactly what I intended to plot.

      • AndyG55 says:

        I know what you intended… :-)

        .. but from a purely mathematical perspective, you probably should have finished the chart at the black dot, so the down and up sections were equal, otherwise the cyclic nature introduces a spurious positive linear trend.

        Ignoring the dates on this WFT graph, I’ve just used them to created a pure sine curve with about the same start and end points on the cycle as you have used, just less cycles.

        You can see how this creates a positive trend.

        http://woodfortrees.org/plot/sine:10/from:1955/to:1993.5/plot/sine:10/from:1955/to:1993.5/trend

        I’m not criticising, I’m just saying to be very careful how you use linear trends on cyclic graphs.

        Don’t give them ammunition.

        • tonyheller says:

          As I said, the graph shows exactly what I intended it to show.

          • AndyG55 says:

            chuckle :-)

            Just me being finicky. ;-)

          • Andy says:

            What does your graph intend to show considering AndyG55’s valid point on the linear part ?

            Andy

          • AndyG55 says:

            It shows Arctic sea ice has done NOTHING,

            No drop in sea ice volume AT ALL.

            So very embarrassing for Hansen and all his followers, like you.

          • Andy says:

            I don’t follow Hansen AndyG55, not read anything of his stuff.

            My question was to Tony so he can answer it. Currently his graph shows a slight linear increase in volume whilst your graph shows it to be more level.

            Are you saying your graph is incorrect and Tony’s is correct?

            Andy

          • AndyG55 says:

            YAWN.. poor little andy..

            STOP your DENIAL of being a AGW- cultist. You are only fooling yourself.

          • Andy says:

            I guess that means you would prefer not to upset Tony rather than your graph be correct?

            Brown noser :p

            Andy

          • AndyG55 says:

            You poor little brain-dead troll.

            Discussing a minor mathematical nicety and you up it into something “wrong”

            You are an IDIOT, little andy.

  14. esalil says:

    Gregole: this is the ice volume, not the ice extent.

  15. Caleb says:

    A June storm will be churning the sea-ice as it moves up from the Kara Sea coast to the Pole this week. It will test many ideas. Looks like it will fail to transport much sea-I e down through Fram Strait. Snowfall and colder-than-normal temperatures at Pole. The one hope of Alarmists is for slightly milder water to get stirred up under the ice.

    http://sunriseswansong.wordpress.com/2018/06/04/arctic-sea-ice-a-june-storm/

    • tonyheller says:

      With the cold air temperatures, it will cause additional heat loss from the Arctic Ocean and make it harder to melt ice later in the summer.

    • RAH says:

      That thicker old compacted ice takes a lot more energy to break up so it can be pushed wherever by the wave action and current.

    • AndyG55 says:

      If there is very little ice transport down through Fram Strait, its going to even tougher to melt anything.

      Remember how the ice bed-wetters got all stirred up by the storm that broke up and transported all the ice in 2012.

      Well now it our turn ;-)

  16. Andy says:

    “The North Pole normally starts melting this week for 70 days, but looks like melt will be delayed again this year due to below freezing temperatures”

    The graph is for temps above 80N not the North Pole, so I am not sure why you mention the pole?

    I am sure there will be melting above 80N, best not try predicting how much will go on so soon in the season. We know how guesses turn out ! For instance this one

    https://realclimatescience.com/2018/05/disaster-looms-for-climate-alarmists-2/

    Andy

    • AndyG55 says:

      “The graph is for temps above 80N not the North Pole, so I am not sure why you mention the pole?”

      Weird.. little andy-trollette thinks the North Pole isn’t above 80ºN !!

      • Andy says:

        Where do I say the North Pole is not above 80N?

        My argument stands. Above 80N should not be called The North Pole. That is a separate entity with its own graph and data.

        Andy

        • AndyG55 says:

          Your argument is baseless.

          North Pole is above 80N..

          You made a moronic statement again..

          that’s ok.. we are used to it from you.

    • Phil. says:

      Because of the method of averaging the DMI temperature is strongly biassed towards the N Pole itself, so it’s not far off. According to NSIDC Arctic sea ice extent dropped by 73,000 km^2 yesterday, some of which is above 80ºN. The rapid loss of ice around Svalbard means that it is already below its normal annual minimum (September).

Leave a Reply to Caleb Cancel reply

Your email address will not be published. Required fields are marked *