Truth In Labeling At The New York Times : “NOT REAL NEWS”

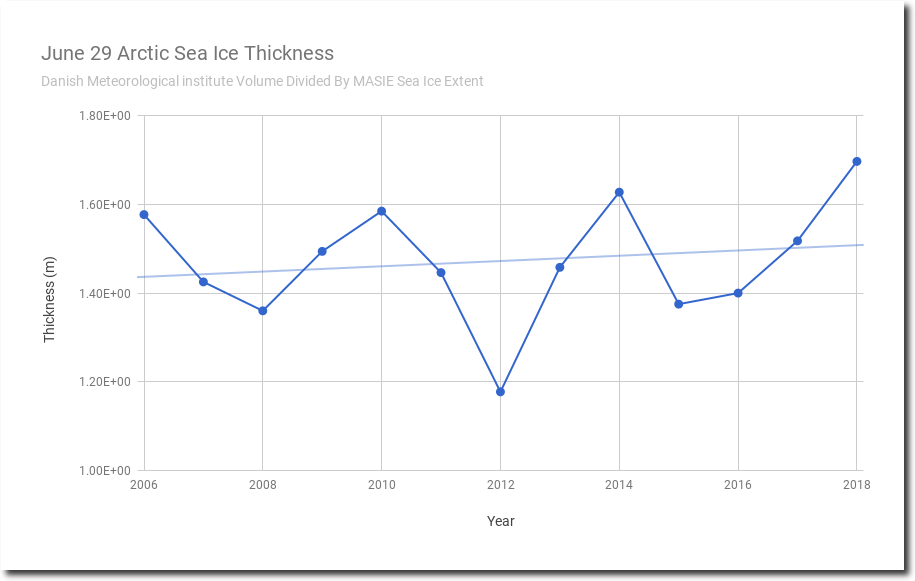
Arctic sea ice thickness has been increasing for the past twelve years, and is up 44% since 2012. I calculated this by dividing DMI volume by MASIE extent.  (The MASIE records only go back to 2006.).

The Arctic Basin is covered with thick ice.

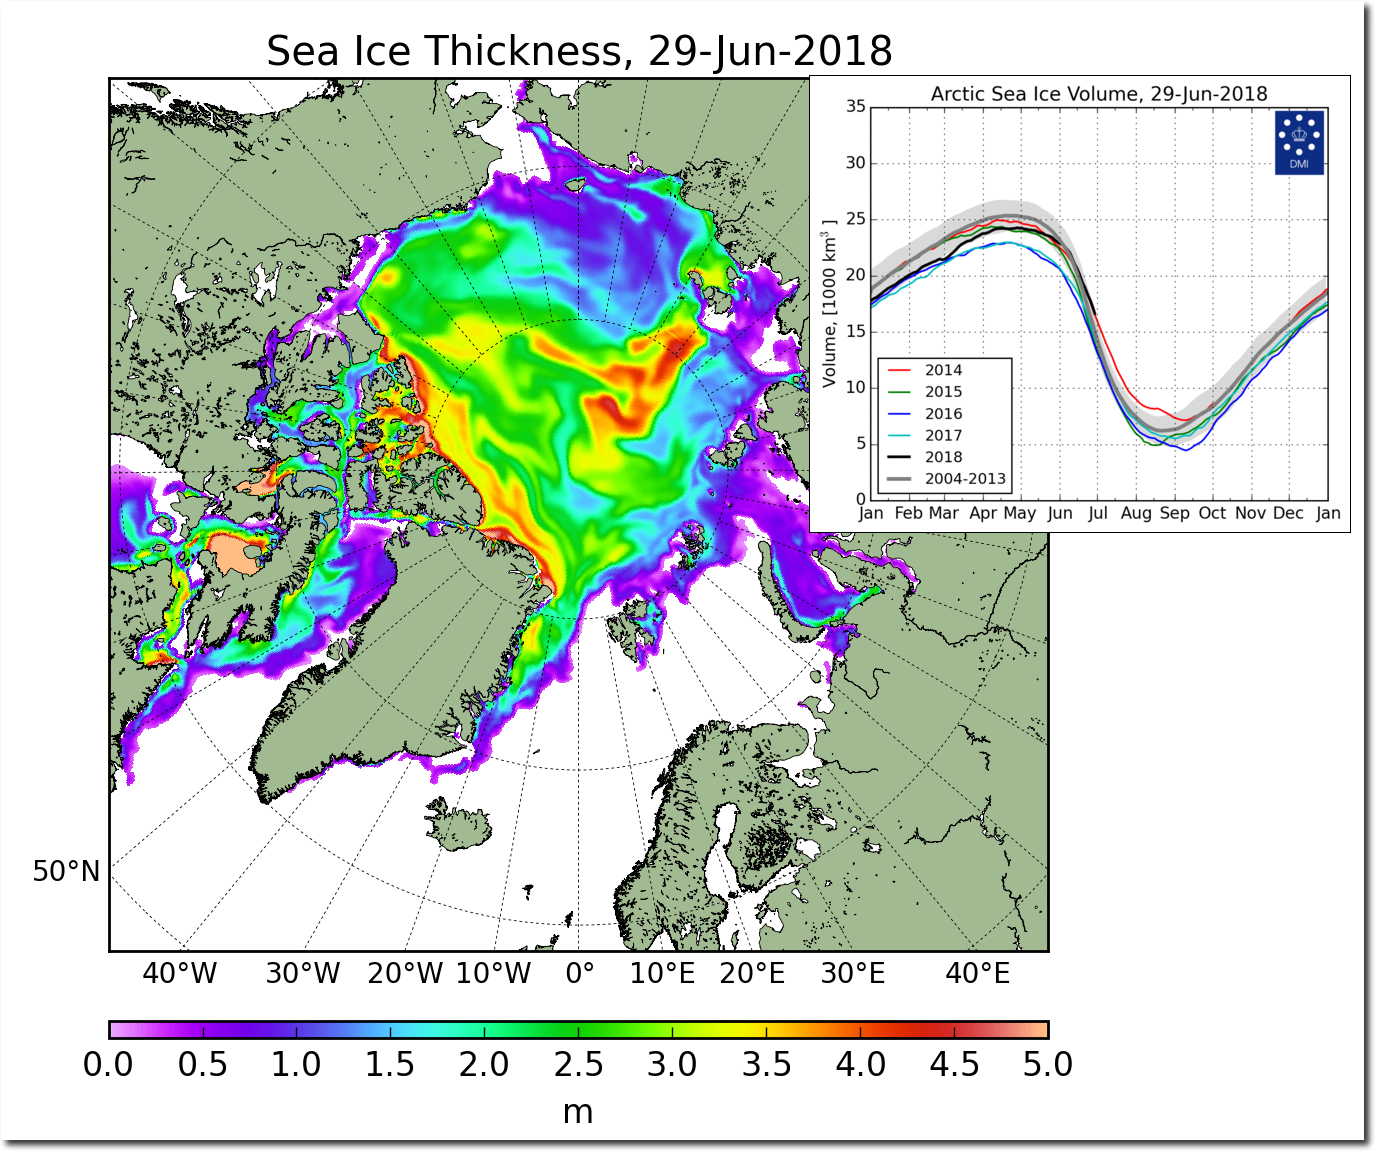
FullSize_CICE_combine_thick_SM_EN_20180629.png (1337×1113)

This is a change from ten years ago, when much of the Arctic was covered with thin ice.

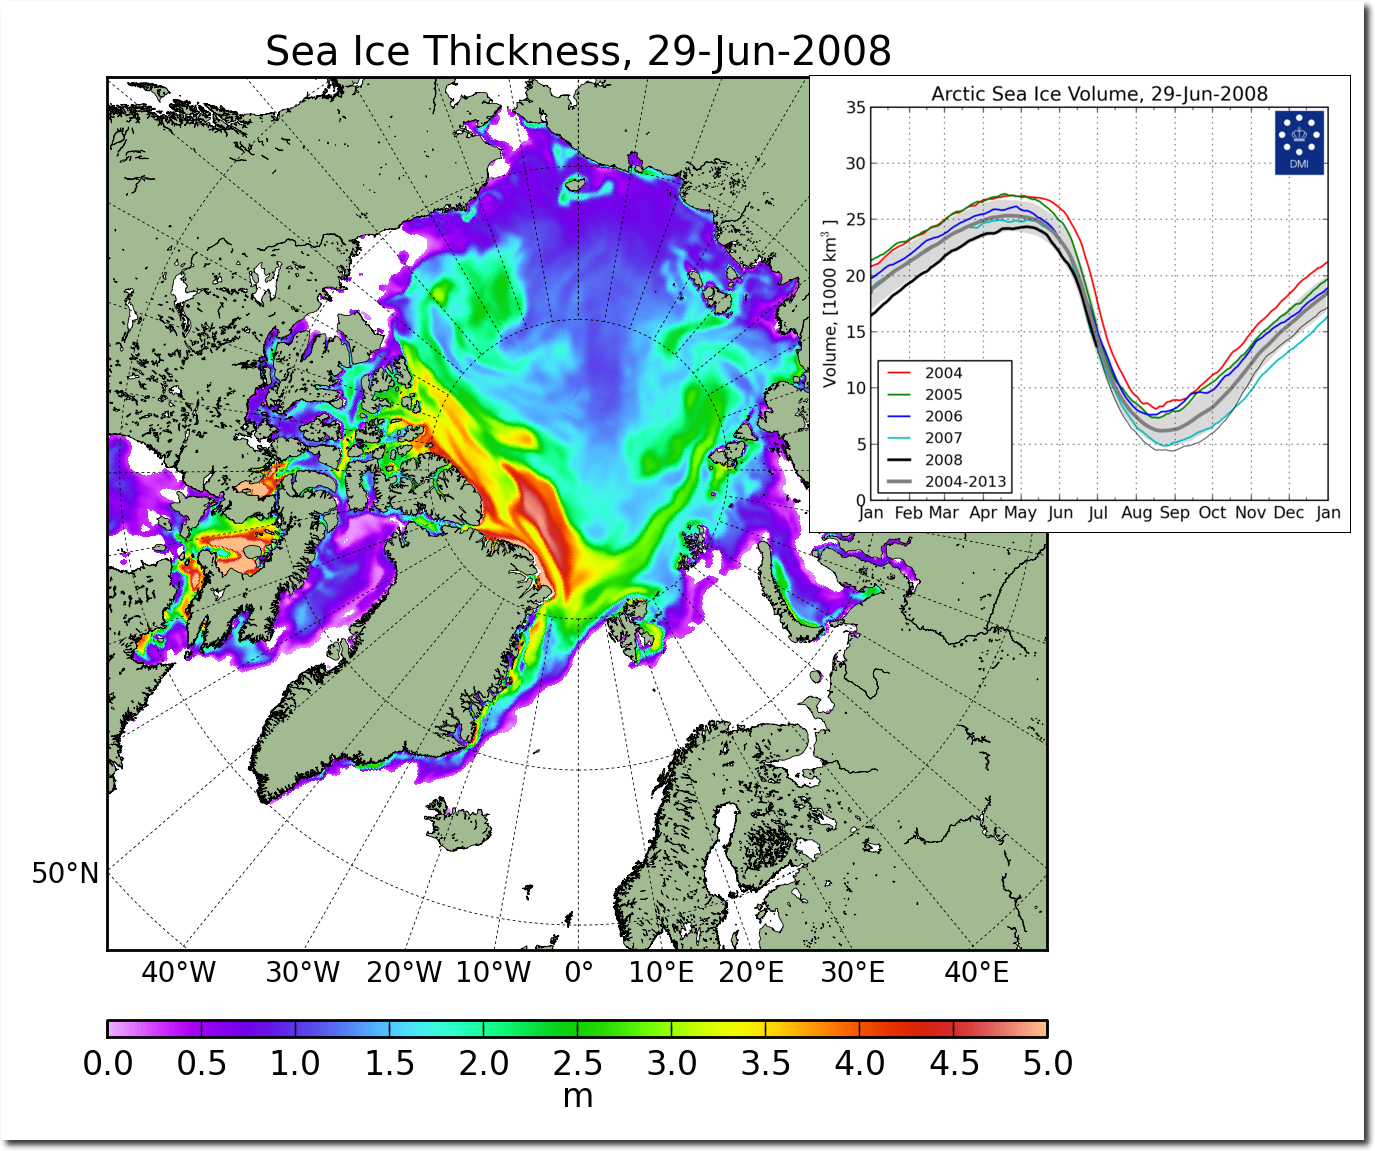
FullSize_CICE_combine_thick_SM_EN_20080629.png (1337×1113)

According to this New York Times article from 1958, Central Arctic ice thickness is about the same as it was 60 years ago.

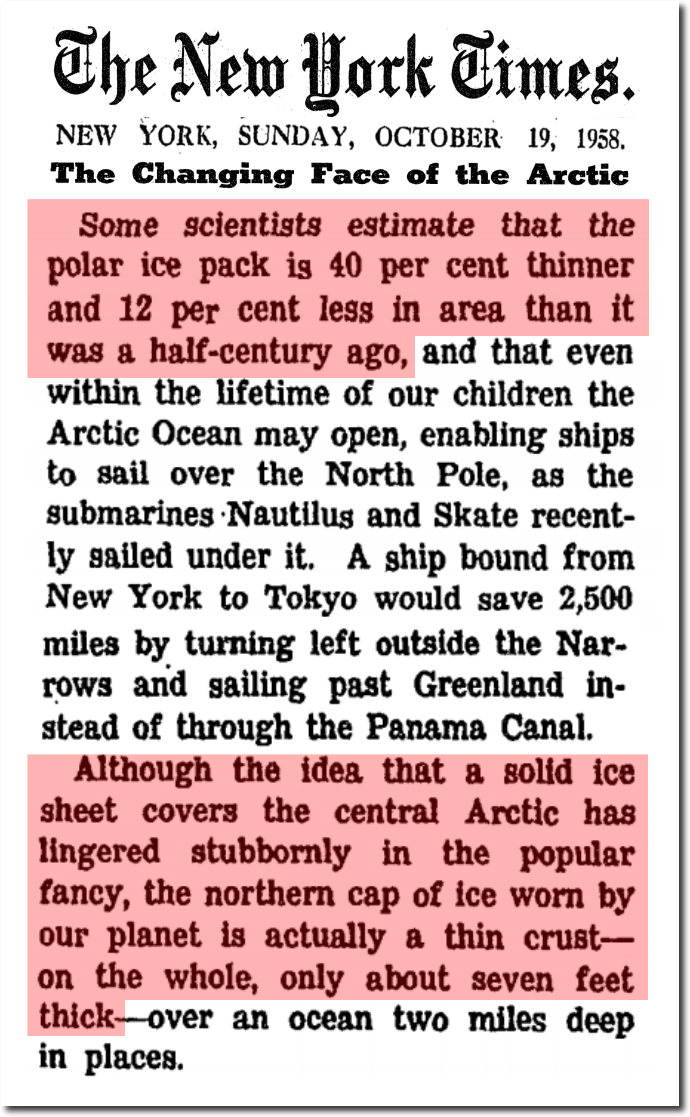
The Changing Face of the Arctic; The Changing Face of the Arctic – The New York Times

Yesterday, the fake news New York Times and Mark Serreze quite predictably conflated Arctic sea ice thickness with extent, and declared their Arctic melting scam to still be alive.  Apparently no one at the New York Times actually reads the New York Times.

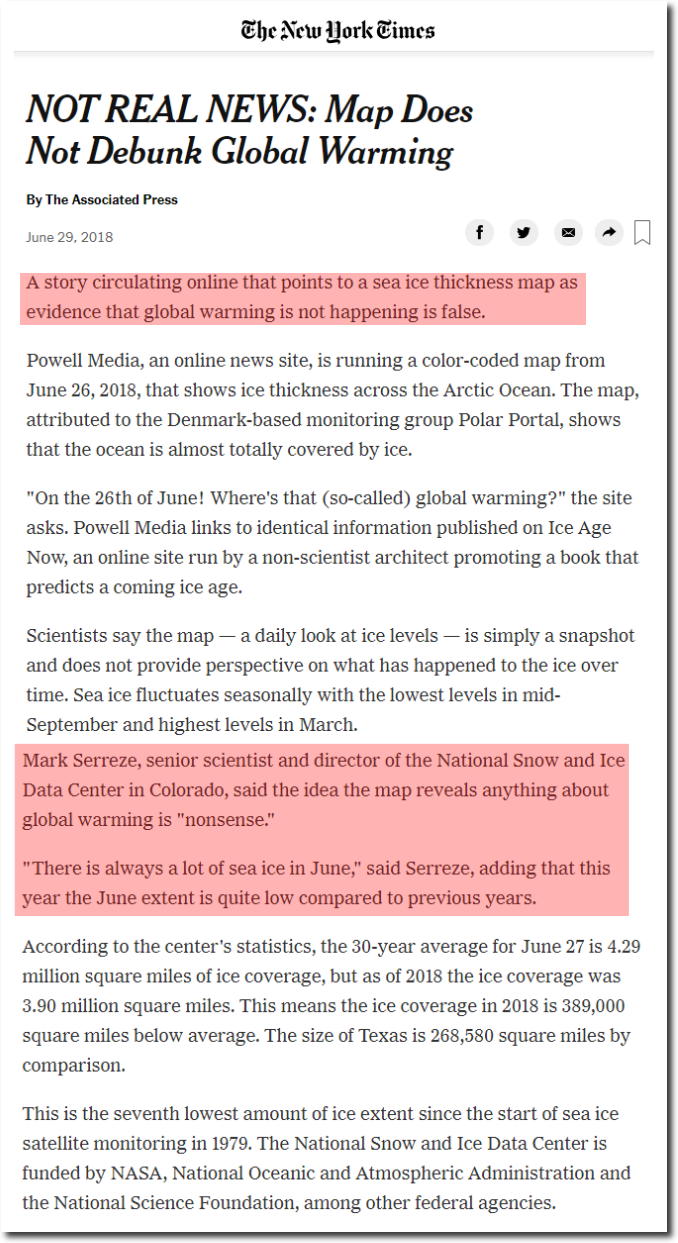
NOT REAL NEWS: Map Does Not Debunk Global Warming – The New York Times

That is the same Mark Serreze who predicted the North Pole would be ice-free ten years ago, and declared the Arctic to be screaming.

North Pole could be ice free in 2008 | New Scientist

Star-News – Google News Archive Search

My forecast that NSIDC would rapidly ramp up the junk science and BS, is coming true however.

This entry was posted in Uncategorized. Bookmark the permalink.

26 Responses to Truth In Labeling At The New York Times : “NOT REAL NEWS”

  1. Gator says:

    Well Marky Mark is right about one thing, ice, or lack thereof in the Arctic reveals nothing about the climate.

    Glad we settled that science.

  2. Steven Fraser says:

    There are several subtle (or not-so) insufficiencies in the NYT Article:

    1) The ‘polar portal’ is not correctly identified as belonging to the Danish Meteorological Institute. The wording of the article trivializes the source material, by describing who linked to it, not those responsible for providing the content. By contract, the National Snow and Ice Data Center is mentioned by its full name two times, and its funding source within the Government mentioned.

    2) As you mention, Tony, Mark Serreze conflates sea ice extent and sea ice volume. He mentions that this year is ‘Seventh Lowest’, without actually mentioning the current trending, the values, or the context, other than how much below average it is.

    This comment on the National Center’s numbers, though, does reveal something interesting. There have been 6 lower years previous to this year. I wonder when they were, and what the trend has been since.

    3) The article puts the beginning of Satellite monitoring at 1979, as we know, not when it started, but a convenient high point for comparison if you want to denegrate the current values.

    4) In the middle of the article one paragraph begins ‘Scientists say…’ without mentioning those being referenced, and then goes on to trivialize what the DMI report is, by calling it ‘simply a snapshot’. The article, and Mark, completely ignore the situation depicted by the DMI diagram… that this year’s sea ice volume is high for this time of year, and try to deflect by mentioning that sea ice varies seasonally, and by saying that ‘sea ice is always high in June’, ignoring completely the month-long situation where Sea ice volume has been uncharacteristically high, and as we know from our ongoing discussion, DMI Sea Ice volume this year has been above average the entire month of June… every day, and progressively so.

    The article does not answer the question posed by the Blogger who pointed out the chart… ‘Where is the (so called) global warming?’

    • Steven Fraser says:

      …and forgot to say… 2008 was #13 for DMI Sea Ice volume, at 91.93% of the 16-year average for the day.

    • Colorado Wellington says:

      Scientists say the map — a daily look at ice levels — is simply a snapshot and does not provide perspective on what has happened …

      The photograph below is a simple snapshot that provides a very good perspective on what has happened …

      • Ken Allen says:

        Isn’t that Cologne, Germany? See Cologne Cathedral in the upper middle- it’s still standing today. The RAF purposely avoided hitting it, but obliterated all the rest.

    • kyle_fouro says:

      1) I thought that was strange I actually didn’t really think anything of it until you pointed it out. I wonder if thats just to save word count or if they don’t want to give proper attribution.

  3. Disillusioned says:

    We are hit by propaganda from so many fronts, I really get weary. Basically intelligent people fall for it, because MSM propaganda is the only ‘news’ they see. It is scary sad that the same people own the ‘news’ and also social sites. Their motto: ‘Make the lie really big and repeat it often.’

    Thank you Tony, for countering the constant river of disinformation with facts.

  4. Eric Simpson says:

    Interesting report about (record?) -144°F temperatures in Antarctica:
    Ultralow Surface Temperatures in East Antarctica From Satellite Thermal Infrared Mapping: The Cold https://agupubs.onlinelibrary.wiley.com/doi/full/10.1029/2018GL078133

    From Breitbart:
    Scientists Observe Coldest Temperatures Ever on Earth’s Surface (-144°F) http://www.breitbart.com/big-government/2018/06/30/scientists-observe-coldest-temperatures-ever-on-earths-surface/

  5. Buck Turgidson says:

    Serreze needs to get his story straight, he is all over the place. If it sounds like junk science, looks like junk science…..

    • arn says:

      In scientific fields where people are promoted for thinking the “right” things and parroting the right things junk science is the rule.

      The real problem is-once a place is infested by the mafia(no matter wether it is the cosa nostra,religious institutions,lobbyists,child molesters or scientists)
      it becomes an “exclusive” self perpetuating systems
      where noone is allowed to enter the exclusive club who does not follow their mind set.
      Such a system is even self cleaning.
      As soon as they reach a certain strength and corruption is the rule
      people with integrity tend to leave because they can no longer tolerate the evil.

    • Louis Hooffstetter says:

      Yep. Mark Series is no scientist, he’s just a Global Warming propagandist. And he has also proven on numerous occasions that he is an idiot as well.

  6. RAH says:

    Some more BS that pisses this trucker off.
    http://www.breitbart.com/2018-elections/2018/06/29/washpo-rising-trucker-wages-are-economic-threat/

    First off no trucker gets out of training and makes $70,000 his/her first year on the road. $40 to 45,000 would be closer to the average of what a hard charging live in the truck first year trucker would make these days. Wages go up with experience and seniority. Let’s take a driving job for WalMart for example. One of the most desirable and highest paid non teamsters driving jobs out there. One has to have at least 5 years or more experience with a very clean record to drive for them. You can expect to make $70,000 the first year and it will go up from there. But we’re talking top of the line wages.

    Now they are right about some of it. It is a tough life for an OTR (Over the Road) trucker. My first year of driving was 2005. I would stay out 2 weeks minimum and get two days home. On average I was out 4 weeks and once stayed out for 6 weeks. No matter how long I was out I never stayed home more than 3 days before hitting the road again. I drove over 146,000 miles that first year and by the 10th month had driven a big truck in every one of the lower 48 states. For half of that year I teamed which means that even when I wasn’t driving I was bouncing down the road. That was driving for Schneider National. I made a little over $37,ooo that year because my pay was reduced by 2 cents a mile to pay for the training.

    During the recession we got no raises and in fact lost some pay because the company had to cut back on bonuses and layover pay to stay afloat. I refused to take the lay off and lived off savings without unemployment. I have never drawn unemployment and never will. One month I got a total of 130 pay miles. That was it!

    And now because there is a shortage of 30,ooo to 35,000 Class A drivers nationally wages and bonuses are going up for drivers these guys are complaining. It’s simple. Supply and demand. Until wages raise to the place that people are willing to give up a huge chunk of their lives for the work or the economy slows down, there will be a shortage of drivers. To be honest I figure $70,000 a year plus per diem for a job that keeps one away from home more than 300 days of the year is not enough. Especially when one considers that a Class A driver must take a physical once every 2 years at a minimum and if he/she has a HazMat certification/endorsement must go through the BS of making an appointment and going to some facility and getting fingerprinted every 4 years to prove they are who they say they are and then must take the HazMat test and gets no pay for doing any of that. Then there is the quarterly safety meetings and training that many companies, like mine require. Yesterday morning I got online and spent 45 minutes of my time watching a video of the last meeting. Sometimes your tested on the content.

    • Johansen says:

      The Washington Post just wants open borders, that’s all. The person that runs Amazon owns the Wash Post. Fuel, not labor, drives the cost of trucking/transportation.

      • RAH says:

        That’s a fact. Fuel is the largest single operating expense in trucking. The fact is what we are is a 100% service industry. That’s all we sell. Get the right stuff where it’s supposed to be intact and on time. Leftists put our nuts in a vice with ever more restrictive regulations on hours of service and ever more stringent safety regulations and ever heavier consequences for violations and then complain about the results of such measures. You wanna know how to increase the flow of freight without increasing the number of drivers? Go back to paper log books. I took this salary drivers job five years ago because I saw the writing on the wall. My goal when I was running the board and being paid by the mile was always to average a minimum of 3000 pay miles per week. I knew the way things were going that it was going to be very tough to do that once we were forced onto E-logs. And that is exactly what has happened. Now days a driver can expect to make maybe 2,500 miles per week running the board.

  7. John of Cloverdale, WA, Australia says:

    ‘Extraordinary’ Arctic changes’
    “Jeremy Mathis, director of the Arctic Research Program for NOAA, told CNN in October (2017) that he had witnessed an “extraordinary transition” in the Arctic environment since 2003, during which time he has made 14 trips to the region.
    “When I started going to the Arctic in 2003, it was very different environment that it is today,” he said. “Back in 2003, we were breaking ice everywhere we went, from pretty much starting in the Bering Strait moving all the way up into the study areas north of Alaska and into the central Arctic basin. There was ice that was very thick and it was very extensive.
    “This year in 2017, during a 25-day cruise in the Arctic, we didn’t see a single piece of ice. We were sailing around on a coast guard icebreaker in blue water that could have been anywhere in the world. And it certainly didn’t look like the Arctic.””
    https://edition.cnn.com/2017/12/13/world/arctic-report-climate-change-intl/index.html
    I cannot see much difference between 2003 and 2018 (image below).
    Either CNN is telling porkies (although they were referring to 2017) or the DMI models are wrong. Certainly doesn’t look like that a bunsen burner is being applied to the Arctic. BTW, I went to the first year (2003) referenced by DMI as the start of their modelling through the years from 2003 to 2018.

    • Steven Fraser says:

      John,

      For sea ice, it depends on where you go, and when.

      First thing to say is that this year, 2018, was (as of yesterday’s DMI Sea Ice Volume,) not too far from the 2003 numbers, 1,131 cu km difference, and narrowing daily. data at
      http://ocean.dmi.dk/arctic/icethickness/txt/IceVol.txt

      Then, as to whether there is sea ice in a given year, it definitely varies based on sea ice movement and melt as the summer progresses, and the timing of a trip.
      For a given year, there is variety as to when the low point is, and the ice-free areas are not always in the same places.

      For comparison, check out the DMI charts for 2014, which are quite like this year’s ice at this time. Look in the Bering, and along the North coast of Alaska, and then toward the Canadian Archipelago. See what you think.

  8. John of Cloverdale, WA, Australia says:

    ‘OUR’ (Global Warming) ABC weather report. It may be the coldest weather recorded but they still hold onto their ‘BELIEF’. Rowan Dean of SKY News exposing the groupthink at Australia’s taxpayer-funded ABC.
    https://www.facebook.com/SkyNewsAustralia/videos/10155596610581728/

    • Steven Fraser says:

      John,

      Do you know about the nullschool.net weather simulation model? It’s really helpful to visualize the wind and temp patterns, especially when Antarctic influences are high. I find its useful to track how weather systems will drive precip patterns, too.

    • Steven Fraser says:

      One final thought… it might be useful to compare the low ice volume time of the year. For 2003 it was Sep 1, for 2014 it was Sep 11.

      I think you’ll find in both cases that the area he says he went (Bering sea, AK north shore, etc) were in pretty much the same condition.
      However, 2003 went below average before growth resumed, and 2014 did not. 2014 was higher ice volume through that entire period.

      The specifics of where the ice was did vary between the years. If you compare them, you can see that that distribution was different, and changed dramatically as the recoveries occurred.

  9. Andy says:

    As an aside this is rather amusing…

    Jaxa are off air since last week, reason being

    http://www.zen141854.zen.co.uk/jaxa.jpg

    They got the authorities in to do the electrical check and now their system will not boot up again! Oh dear.

    Best to keep things running and not let the authorities just do some fiddling to put a 2018 PASS sticker on it.

    Andy

  10. mwhite says:

    https://climategen.maps.arcgis.com/apps/MapTour/index.html?appid=a31a3b7758f64a72ad91147fc7d2545c

    “Will cached his canoe this week as he will be unable to make it to Baker Lake because of the intense and unseasonable winter weather he experienced early in the expedition”

    “he will return to this grove of trees next spring to continue his expedition to the arctic ocean”

    (Plan B)

    • gregole says:

      Is “intense and unseasonable winter weather…” consistent with a warming world? And with Mann-Made CO2 at a high of over 400 ppm you’d think it would be overheating the Arctic. Guess not.

Leave a Reply

Your email address will not be published. Required fields are marked *