“Who controls the past controls the future. Who controls the present controls the past.”
― George Orwell, 1984
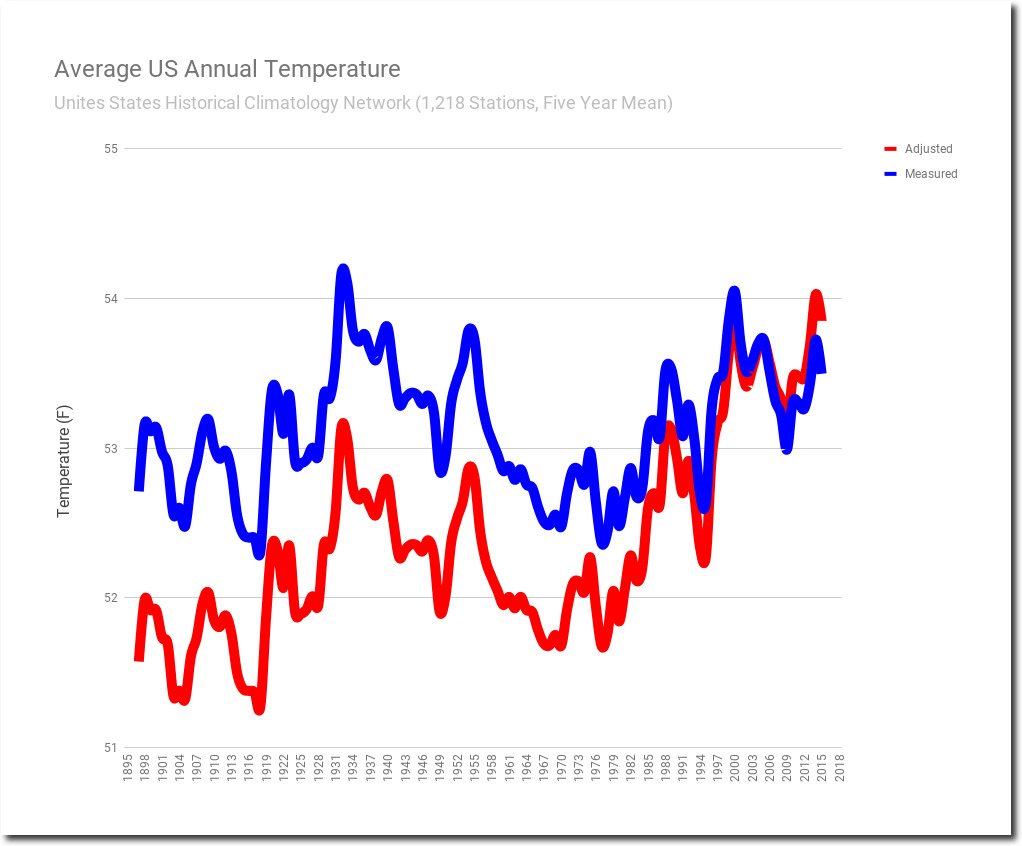
I frequently post these graphs showing how NOAA and NASA have erased America’s hot past, and particularly how they made the incredibly hot year of 1934 disappear.
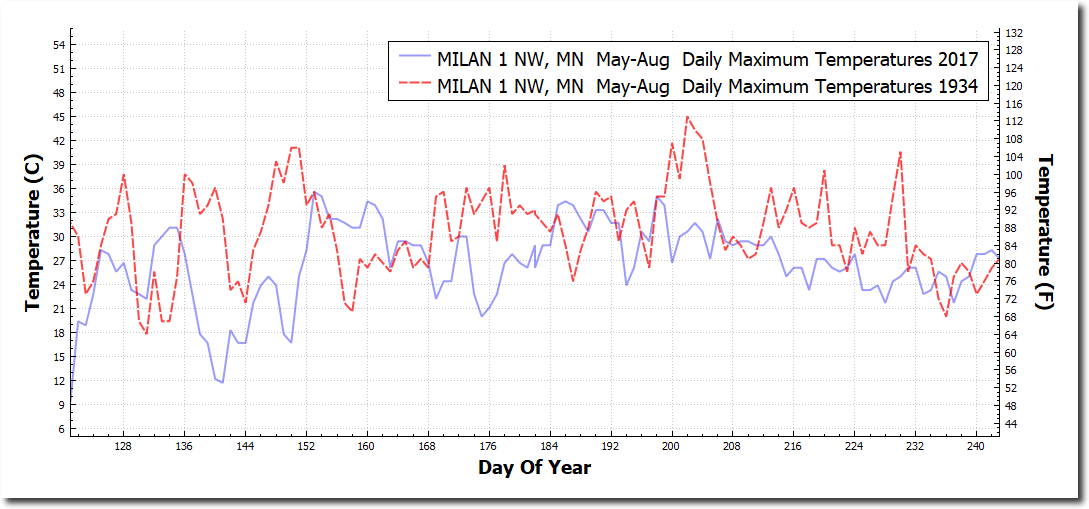
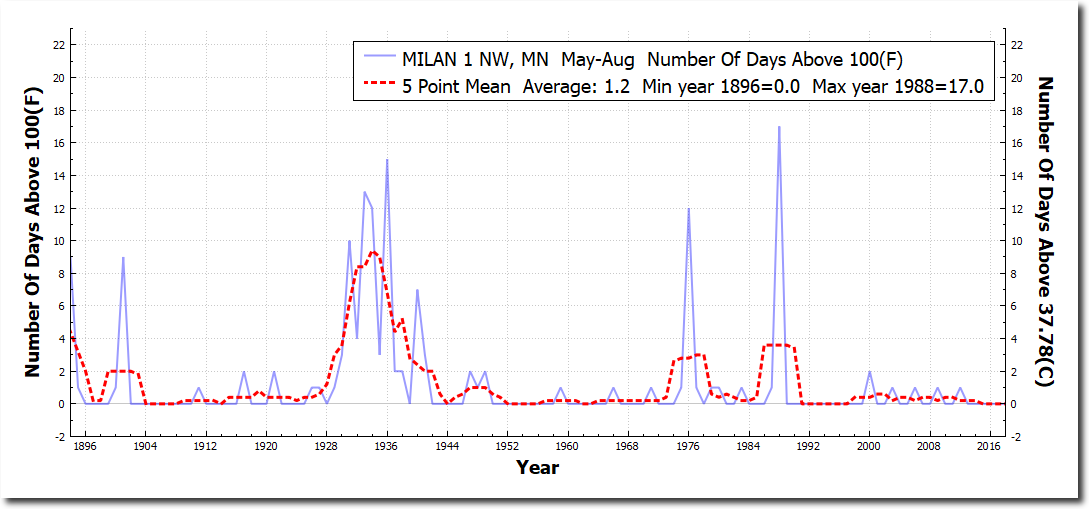
Let’s look at what they are erasing. The summer of 1934 had ten massive heat waves east of the Rockies. Minnesota had a record cold spring this year, but in 1934 Minnesota was an extremely hot place – with many days over 100 degrees. Milan, Minnesota reached 113 degrees in 1934, compared to a maximum of 96 degrees last year.
Minnesota had many hot summers when CO2 was below 350 PPM, but none since CO2 reached James Hansen’s deadly threshold. The last hot summer in Minnesota was 1988, when Hansen warned Congress that the Midwest was going to burn up and dry up.
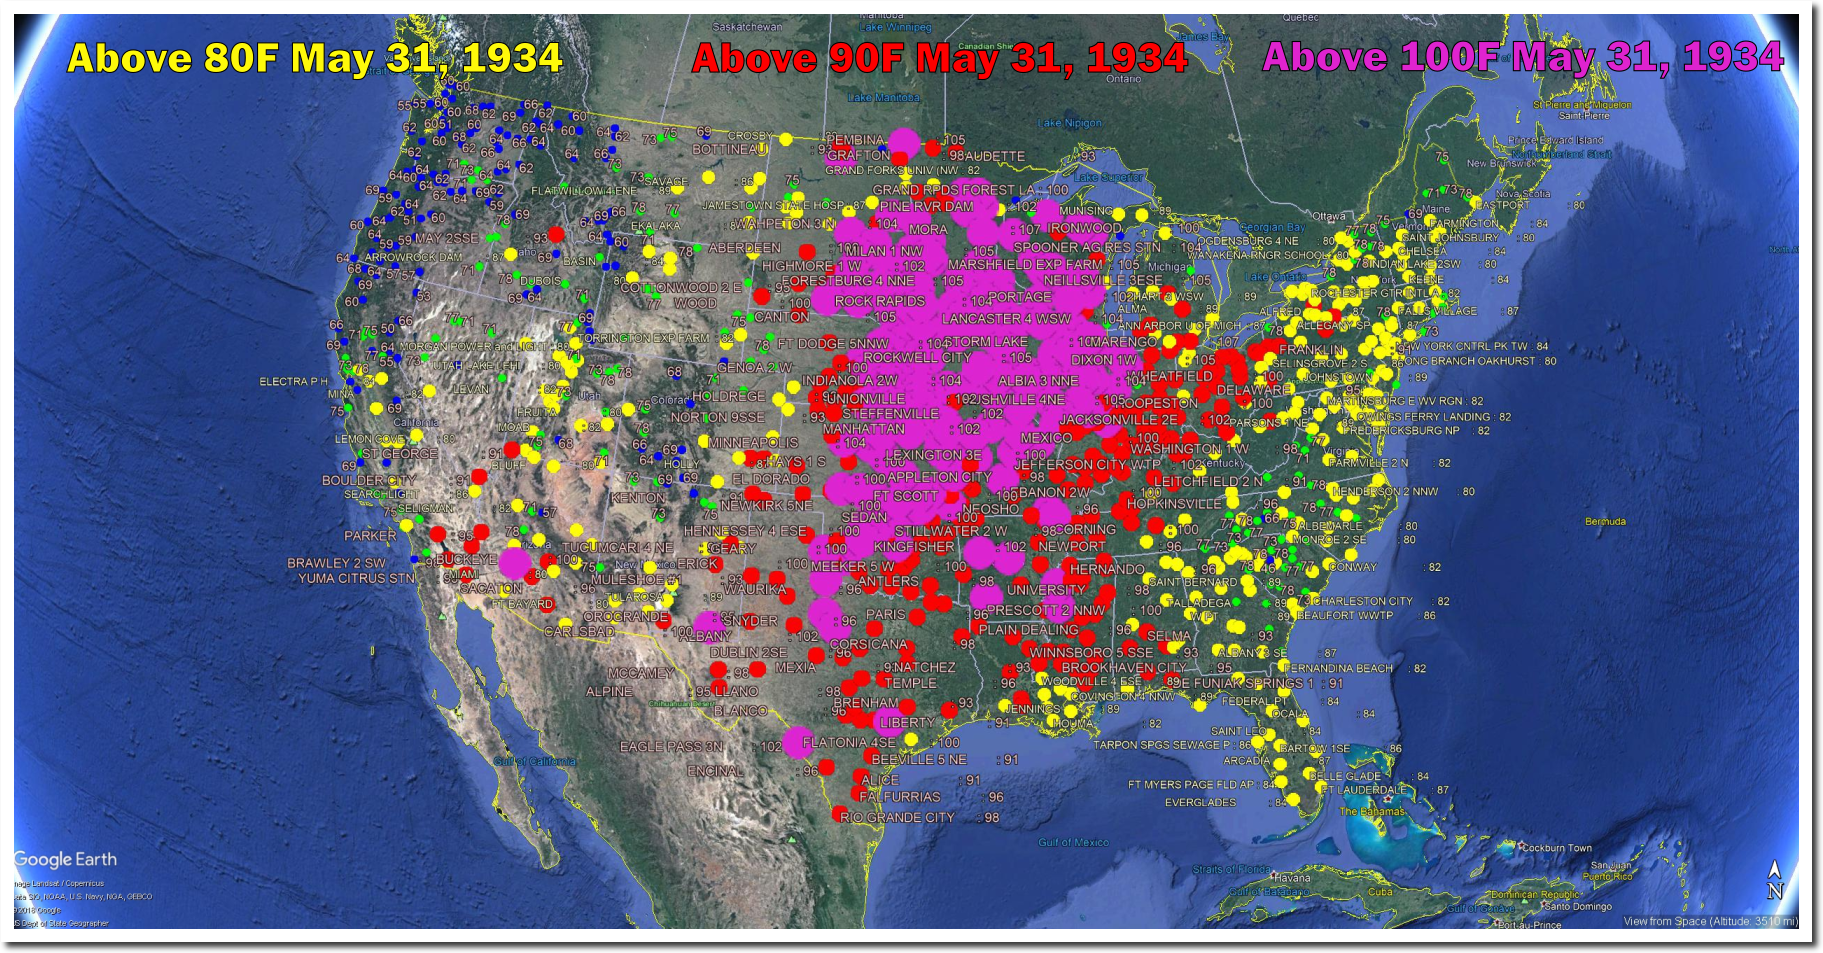
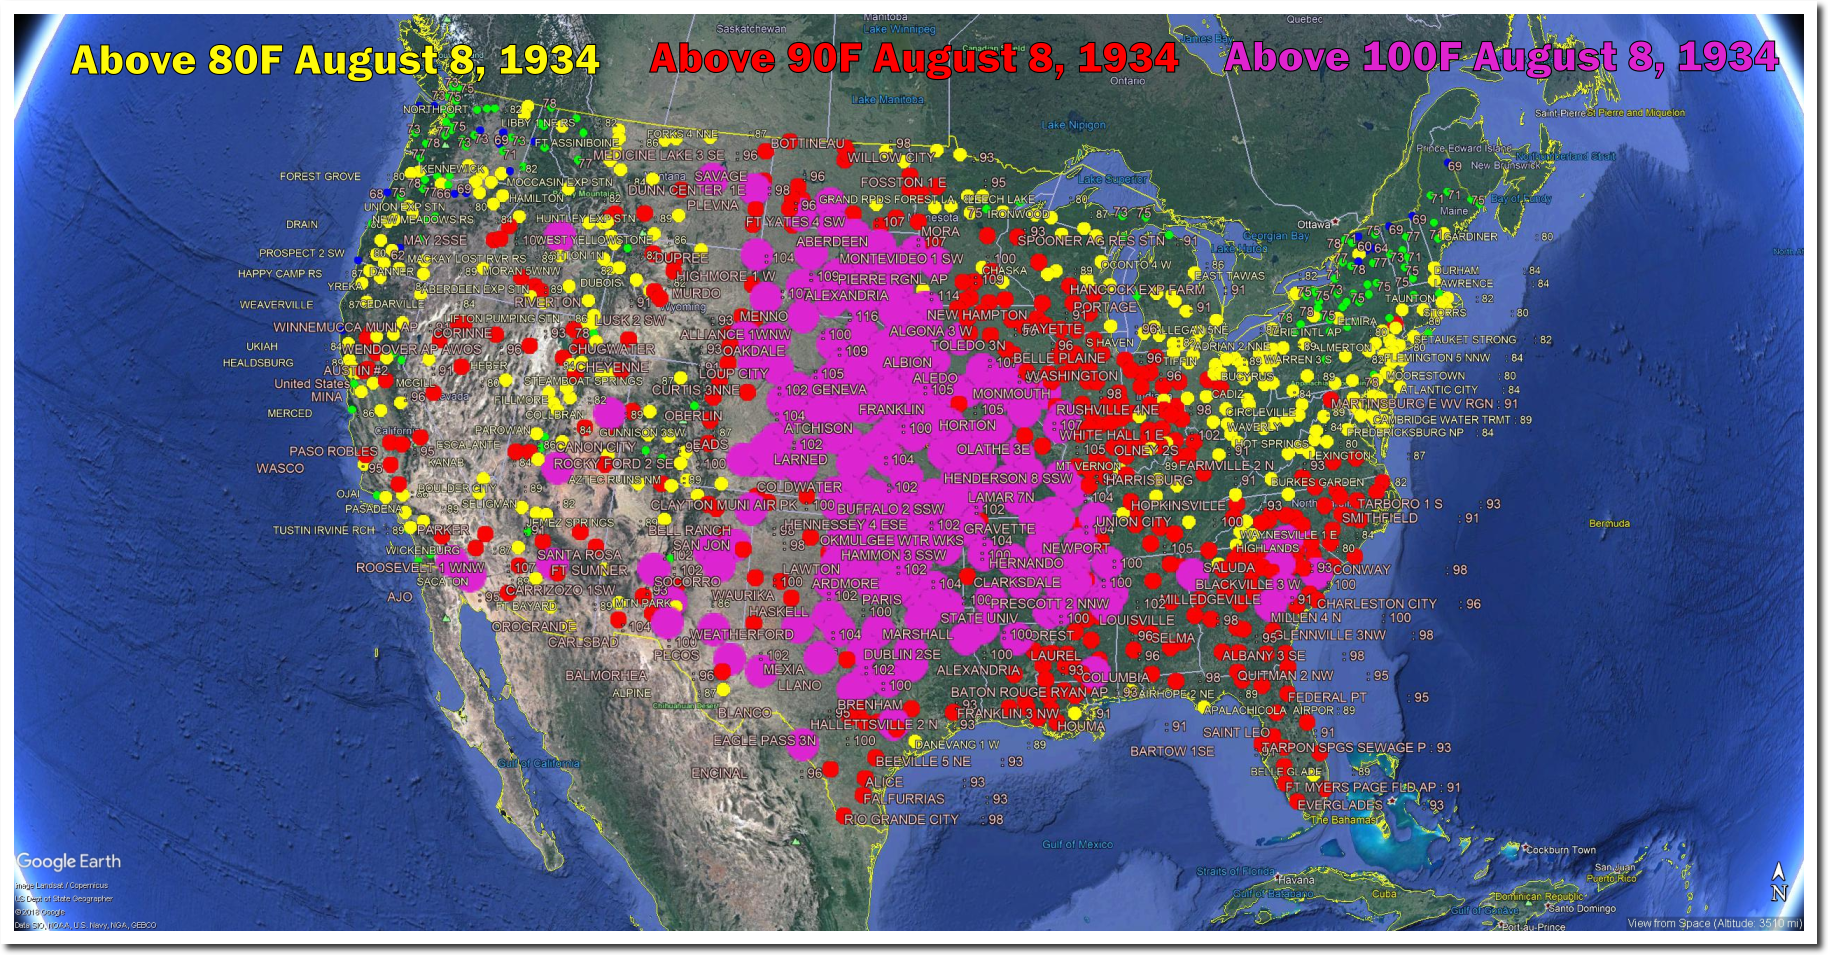
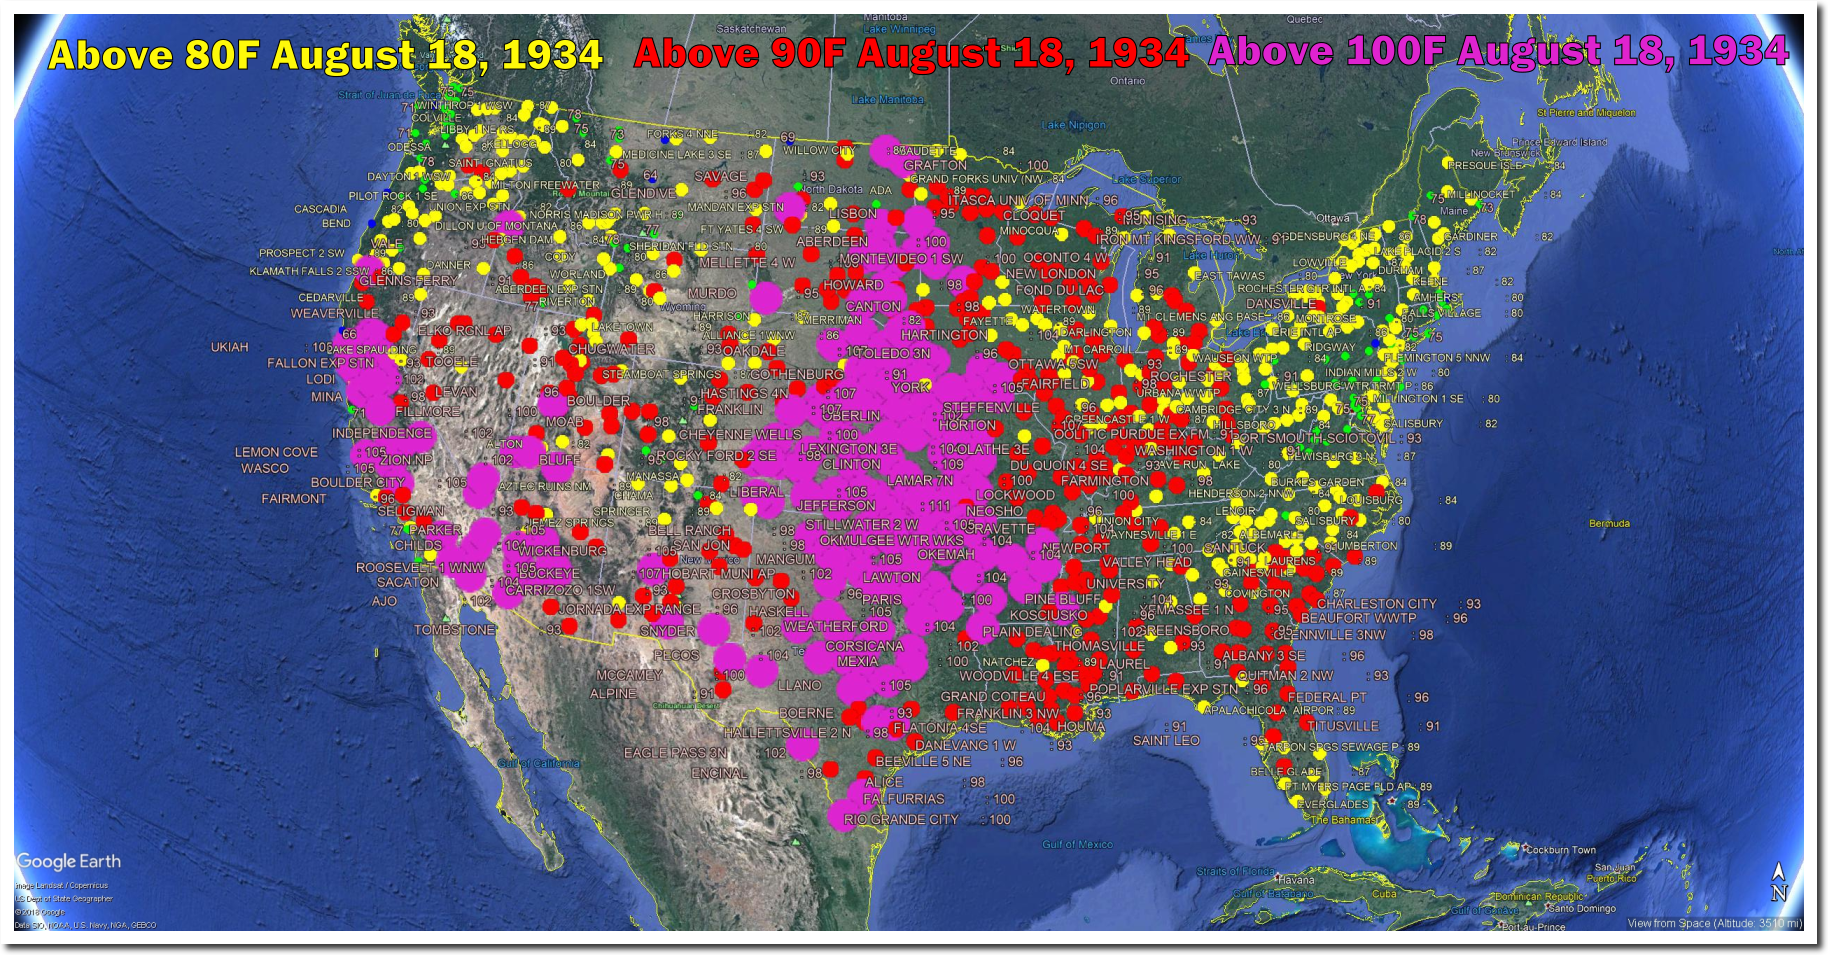
Here are some of the heatwaves of 1934 which Hansen et al erased via data tampering.
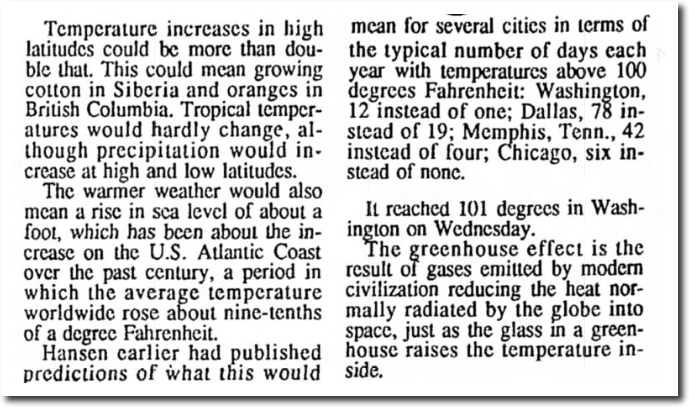
But what NASA and NOAA are really erasing is their failed predictions. Thirty years ago this month, NASA’s James Hansen warned Congress of increased heatwaves and droughts in the Midwest. He had it exactly backwards.
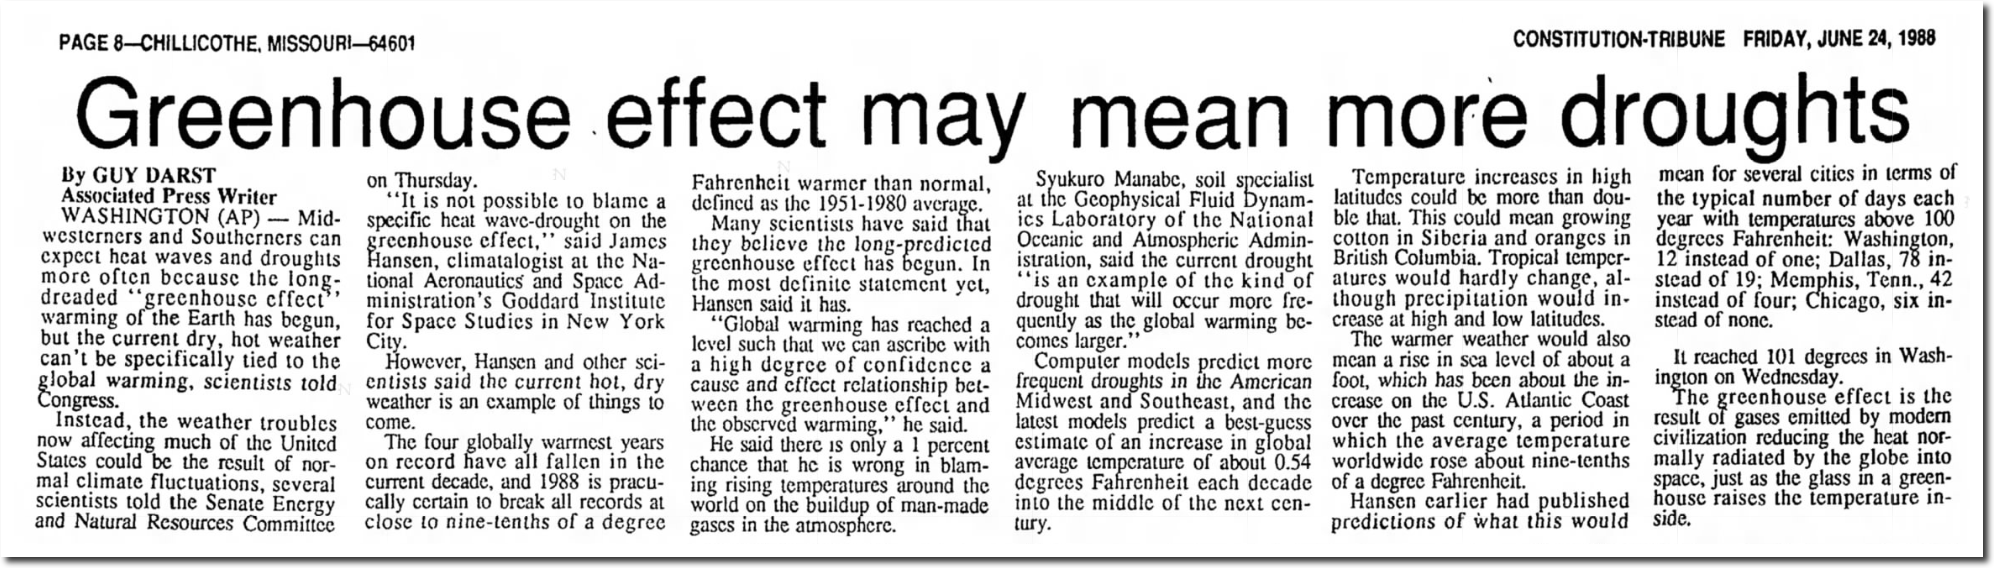
24 Jun 1988, Page 8 – The Chillicothe Constitution-Tribune at Newspapers.com
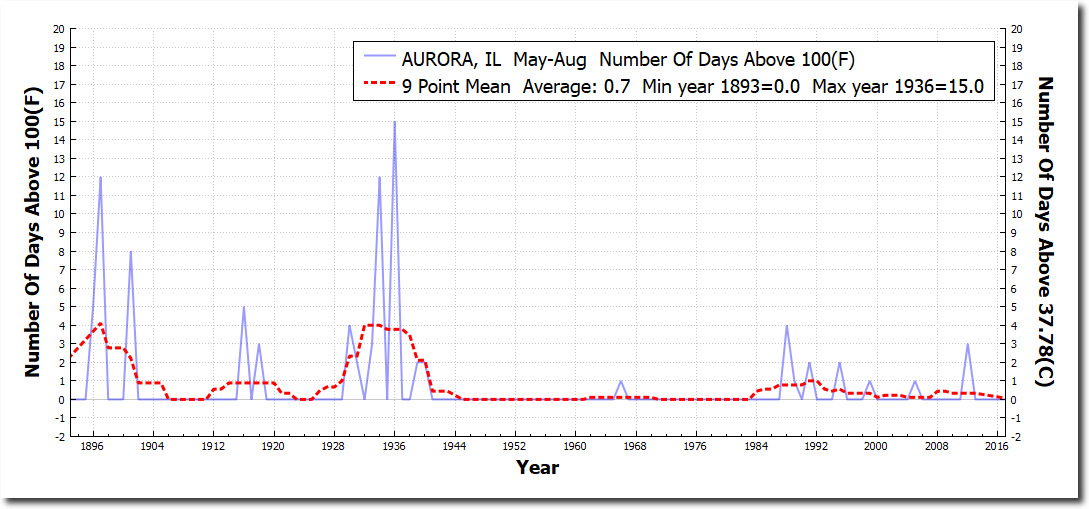
Hansen made specific predictions about the number of 100 degree days skyrocketing in several cities around the US, and growing cotton in Siberia.
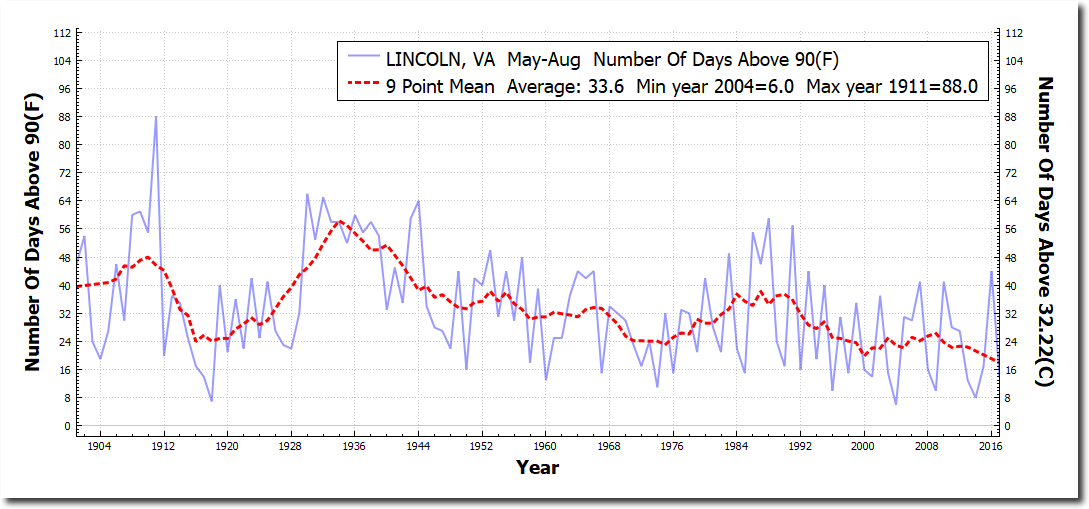
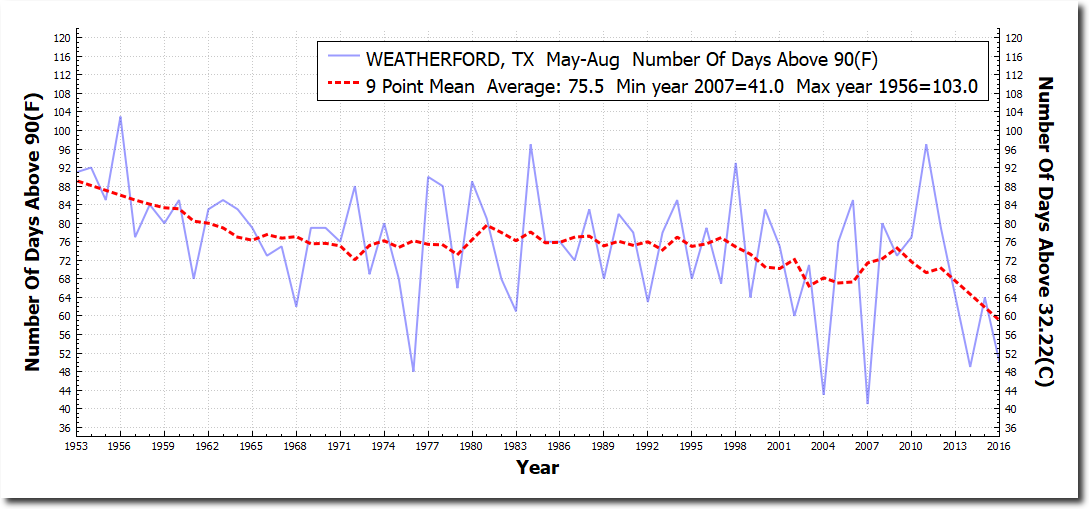
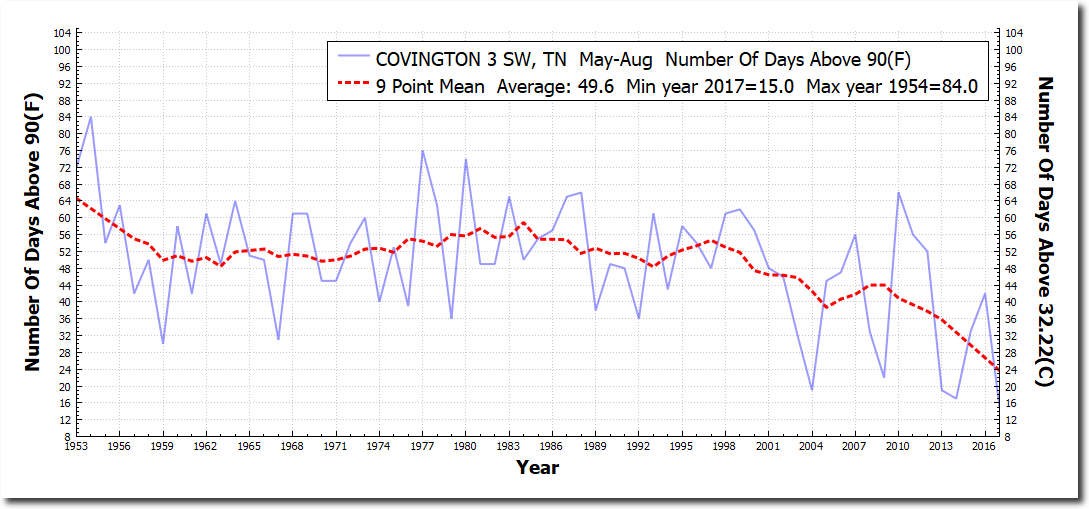
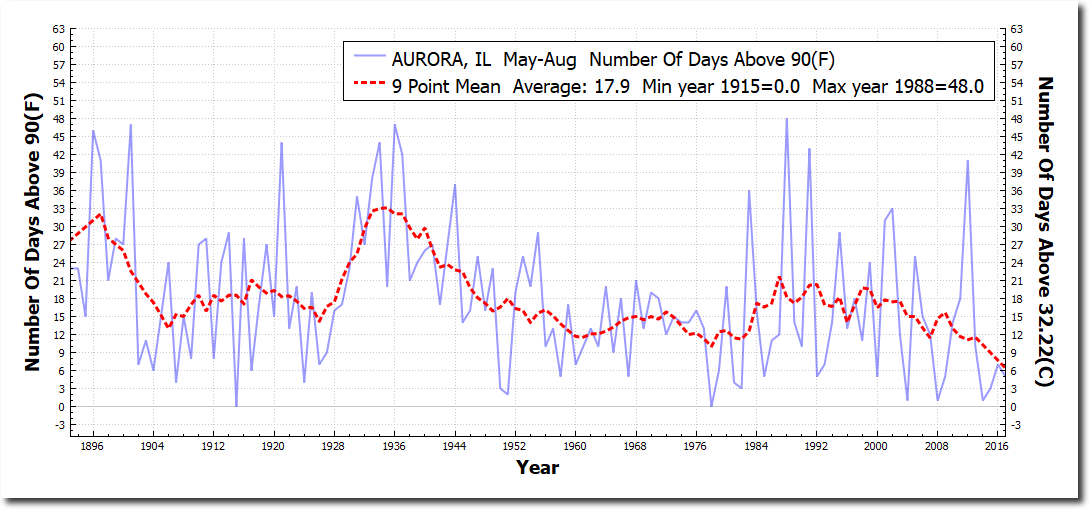
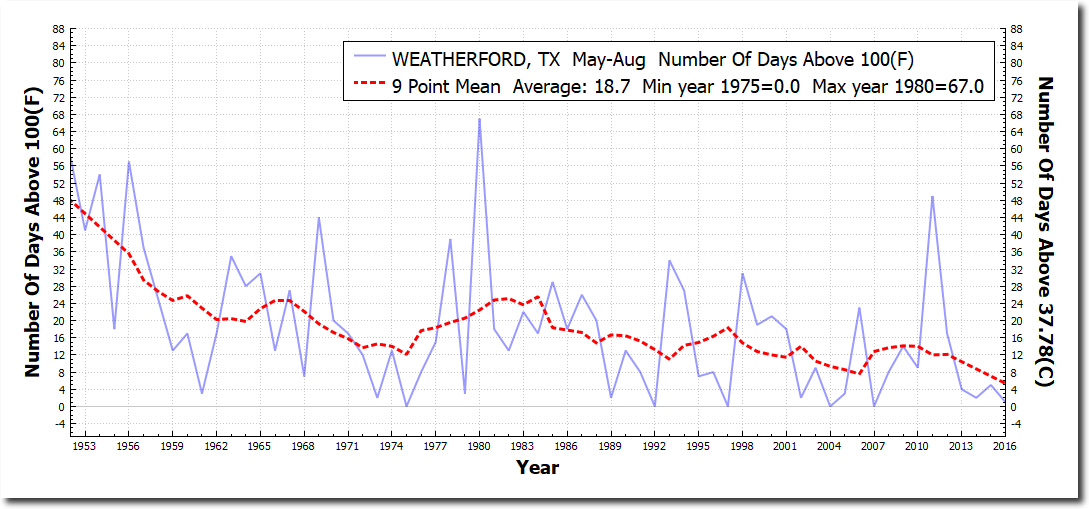
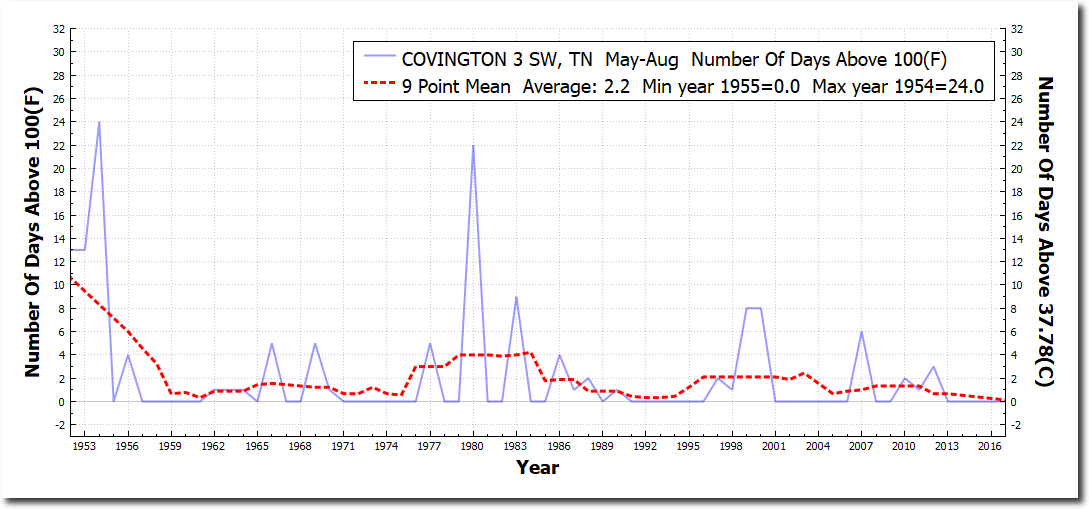
Every one of his predictions was backwards. The frequency 90 and 100 degree days has plummeted in the US.
Closest Virginia USHCN station to Washington DC
Closest USHCN station to Dallas.
Closest USHCN station to Memphis.
Closest USHCN station to Chicago.
All of Hansen’s temperature forecasts were wrong, as were his drought forecasts. Both the US and the Midwest have gotten much wetter over the past century, exact opposite of Hansen’s forecasts.
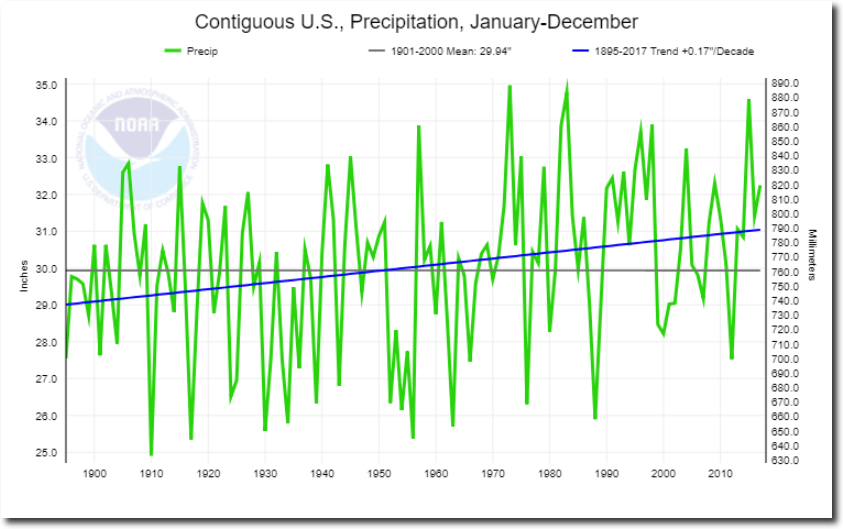
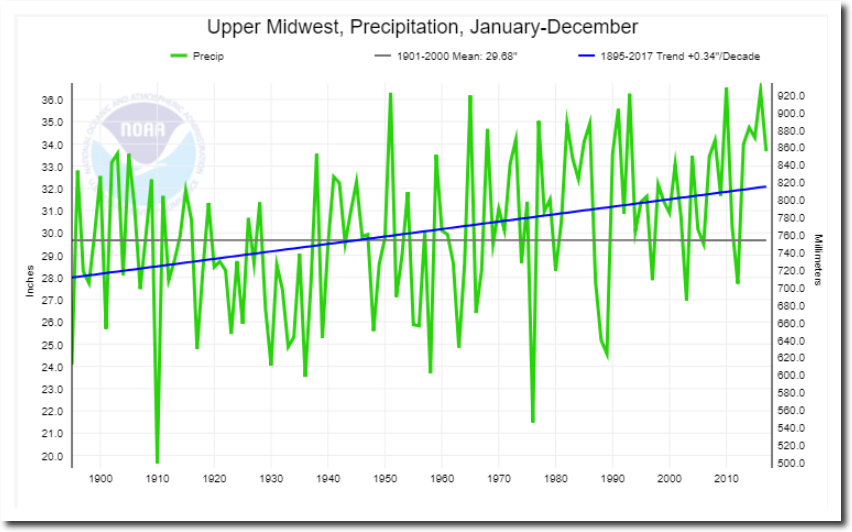
Climate at a Glance | National Centers for Environmental Information (NCEI)
And what about the predictions of growing cotton in Siberia? Scientists got this idiocy from Arrhenius over 100 years ago.
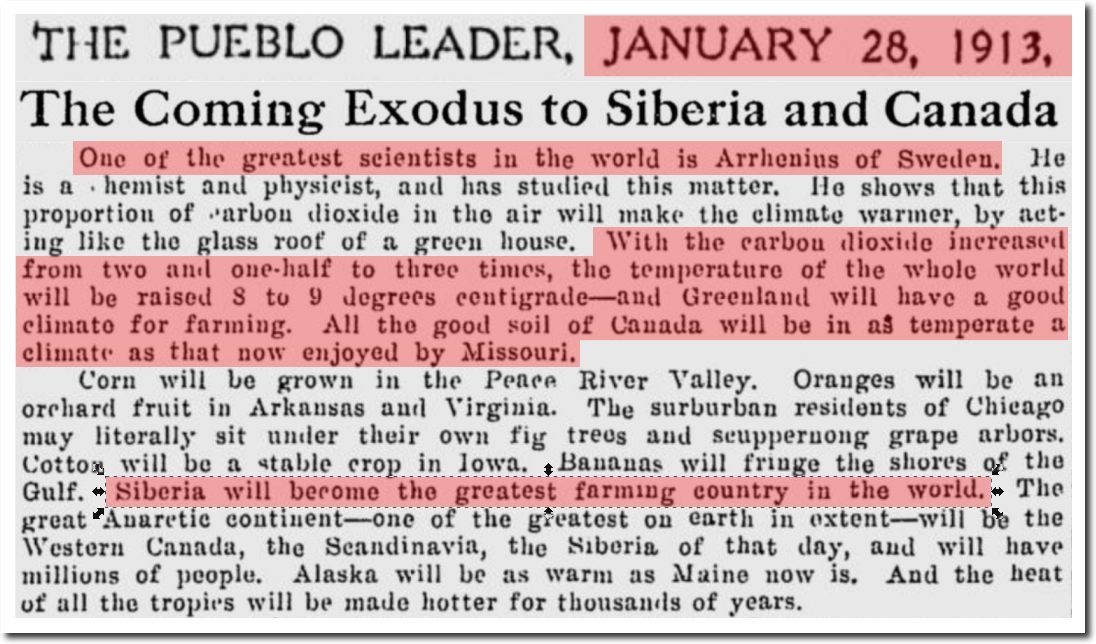
The Pueblo Leader – Google News Archive Search
Siberia broke the Northern Hemisphere record for cold this year. Cotton doesn’t grow at -62C.
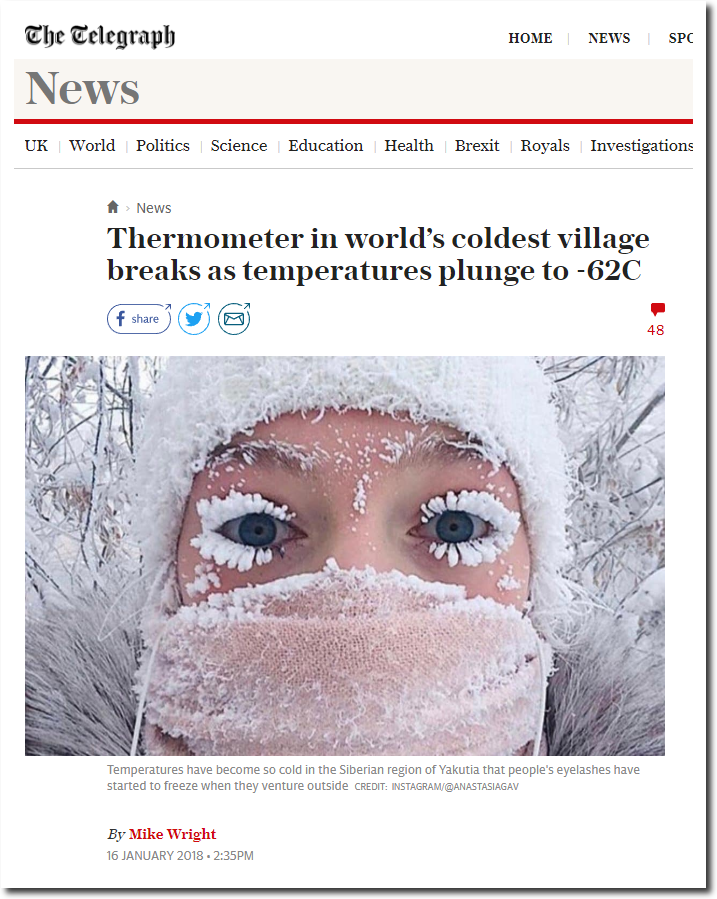
Thermometer in world’s coldest village breaks as temperatures plunge to -62C
Hansen “echoing the work of other scientists” predicted the Arctic would be ice-free no later than 2018. Democrats declared him a prophet over that prediction.
The Argus-Press – Google News Archive Search
Instead, we are seeing the highest volume of sea ice in several years, very slow melt, and ice volume almost reaching the “normal line.”
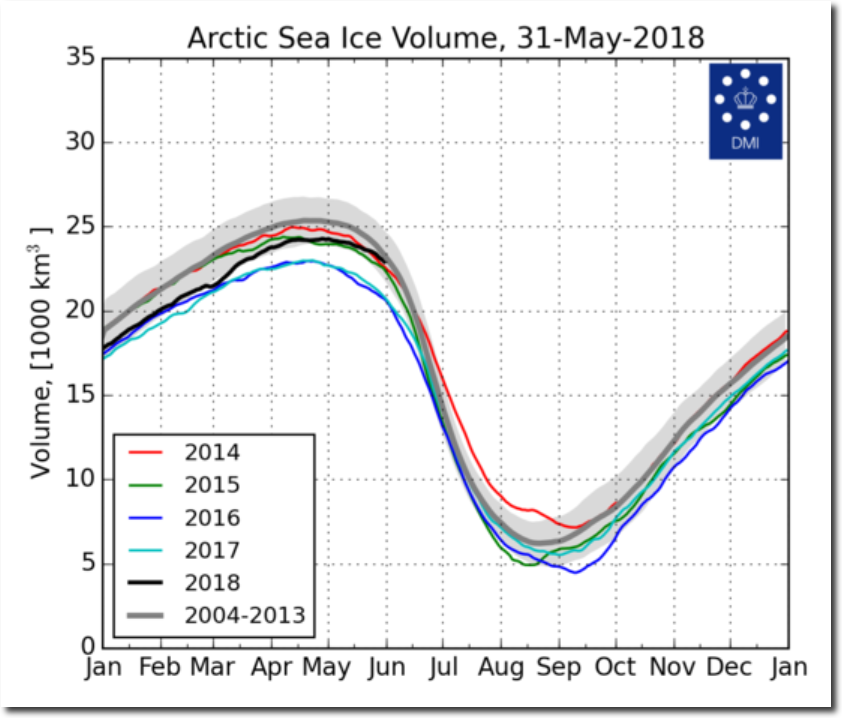
FullSize_CICE_combine_thick_SM_EN_20180531.png (1337×1113)
Climate scientists have been pushing junk global warming theory on and off for over a century. But the real hysteria started with James Hansen in June, 1988. As his predictions failed, he began to tamper with the data to cover his tracks, and now all that climate science is left with is failed models, fraud and data tampering. It is a criminal venture in collapse.
We have our own Hansen in Manitoba.
See:
http://www.cbc.ca/news/canada/manitoba/climate-change-prairies-website-1.3581495
Still waiting for all the rapid accelerations, tipping points, death spirals etc. of the climate system as promised by the supposed experts.
Where is this “runaway greenhouse effect” ???
I swear, when I first heard of such a thing I nearly broke a rib laughing so hard.
Seems like a sensible ice assessment by the Japanese (not that Griff will agree!).
http://notrickszone.com/2018/06/01/japanese-meteorological-agency-corrects-antarctics-long-term-sea-ice-growth-trend-upwards/
I expect Ms Griff—the Arctic’s most celebrated virtual resident—to echo other scientists and predict that Far North’s cotton harvest will be huge this year.
Yes, and cruise ships will go through the NW passage. The passengers in bathing suits and flip flops playing shuffle board, swimming in the pool, or stretched out on the loungers on deck being served Mint Juleps and Pina Coladas while they watch the few stranded, starving polar bears looking at them from the shores of the passing dry and snow free land. The only ice the passengers will see is in their drinks.
There is so much cotton in the far north-
so much that everything turned white there.
“Beware of false prophets, who come to you in sheep’s clothing but inwardly are ravenous wolves”… perhaps there is a parallel, here
The hardcore socialists “Fabian Society” has a wolve in sheeps clothing as symbol.
The fabian Bertrand Russel suggested to use the media&music to programm people(sounds familiar?).
HG Wells,a former member who left the fabians because of their obvious fascist tendencies wrote a book:”A shape of things to come”
where in the end an eco fascist progressive dictatorship of superior apparatchicks rules over the primitive humanity by using ‘peacegas’
“Beware of false prophets, who come to you in sheep’s clothing but inwardly are ravenous wolves”…. perhaps there is a parallel, here
DMI ice volume for the 31sr: gap between #7 2018 and #6 2010 has narrowed in the last 3 days. 2018 is just above average for the 16-year span, and just below the average of the 2004-2013 graphed reference years.
Stay tuned!
Great presentation, Tony! Slam dunk, case closed! Now for the news to get out.
OT, UK wind provide 0.2% of demand !
https://notalotofpeopleknowthat.wordpress.com/2018/06/01/wind-power-drops-to-2-year-low/
Thank goodness they have all that Norway and Russia gas.
2018. Arctic ice is fine. Manhattan isn’t flooding.
Mann-Made Global warming is so 1980’s. Just another passing fad.
But Ellicott City, MD did flood! We are doomed!
Weird that they never built a city in The Narrows at Zion.
https://earth.nullschool.net/#current/wind/surface/level/overlay=temp/orthographic=-323.49,96.90,389/loc=-103.760,89.769
Today according to earth.nullschool.net the temperature of the North Pole was minus 9,6 C. Summer has begun, but the North Pole is still freezing.
UAH just out. Slight drop to 0.18C anomaly (1981-2000)
Anomalies are a lie, part of the Big Lie.
DMI June 1 ice volume: still #7. BUT, value has crossed above the average of the charted years 2004-2013, now 100.67% of it, and 100.83% of the 16-year ice volume average for the date.
With the 7-day decline rate 2nd lowest, and yesterday’s decline lowest for the date, it liiks like 2018 will surpass 2010, and become #6. After that, next highest year is 2007, which is declining more rapidly than 2018.
Stay tuned!
Correction to my earlier post:
Due a spreadsheet error, including an incorrect year in the average, 2018 did not exceed the average. It is now at 99.83% of the average for the 2004-2013 years.
Nope! Got that one wrong too! There was another mistake in the spreadsheet, and with that corrected, 2018 returns to 100.26% of the average of the 2004 to 2013 years.