
Arctic sea ice volume last spring was the highest of the past decade, and this year is well ahead of last year.

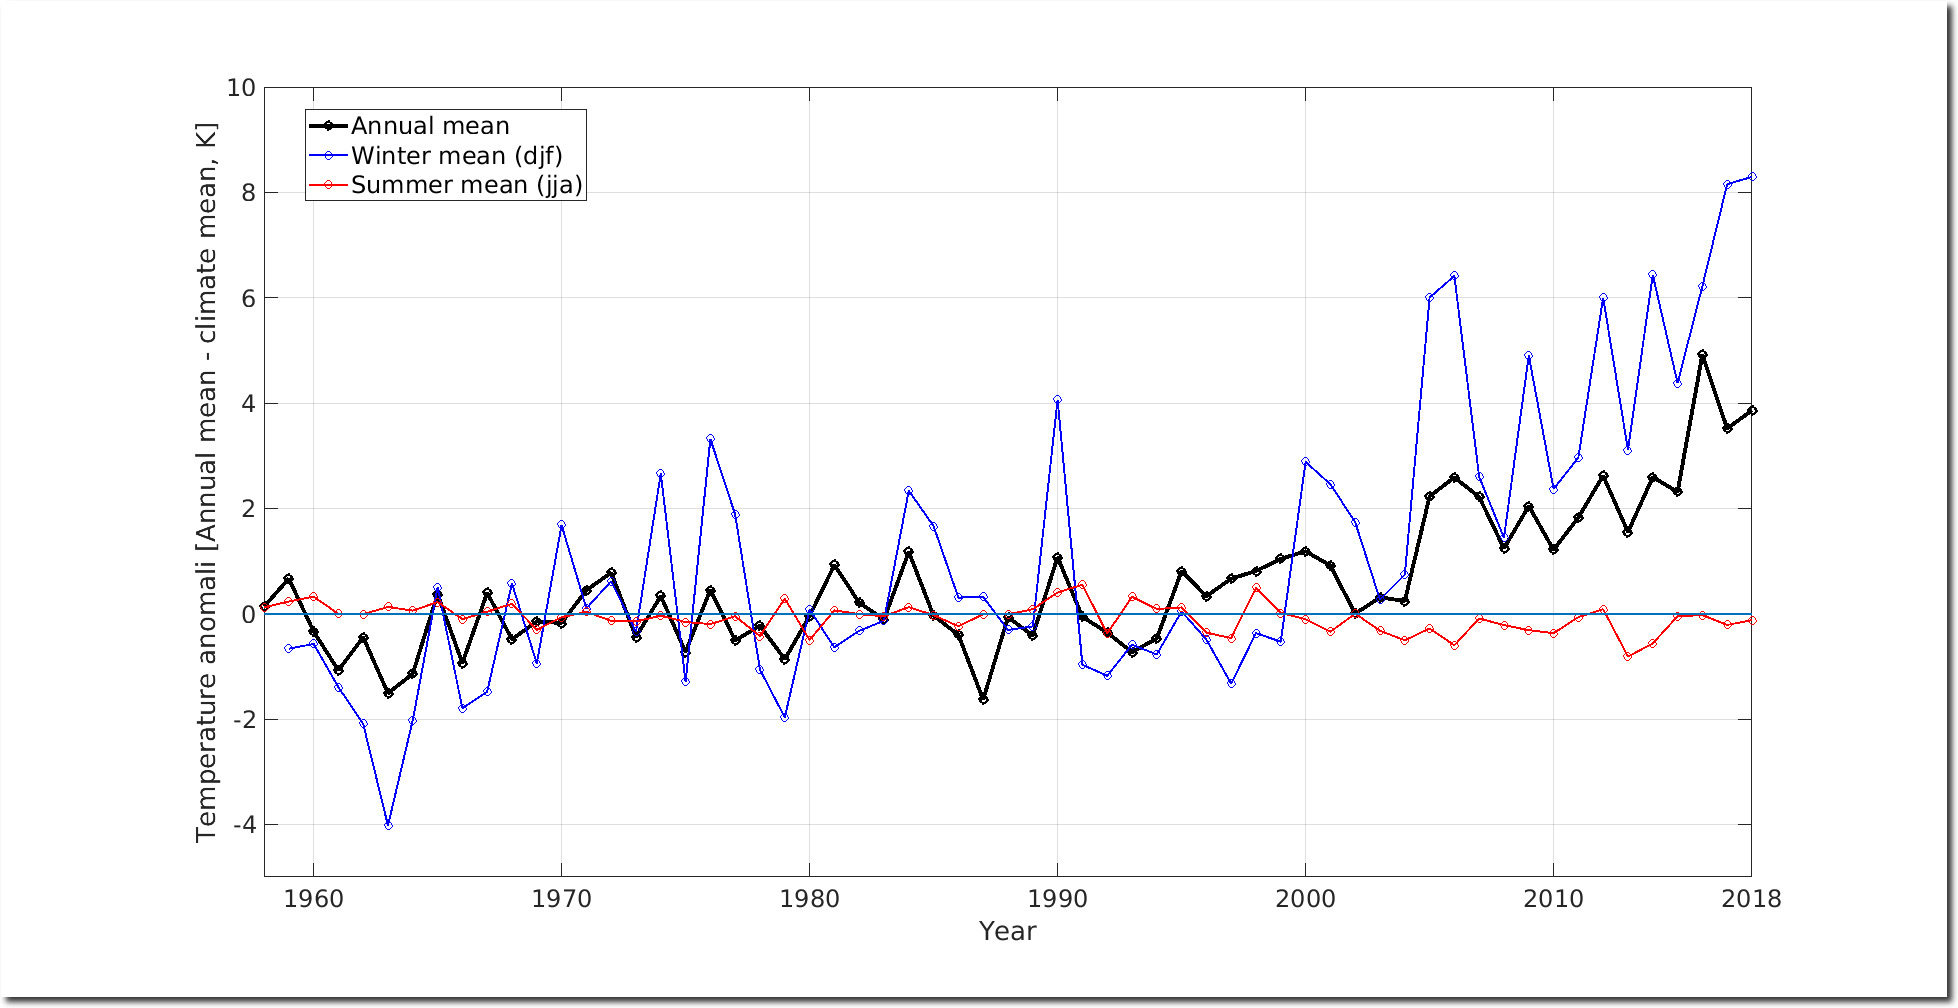
There are only about 90 days a year when ice can melt near the pole, and summer temperatures near the pole have been consistently below normal for the past 20 years.
Ocean and Ice Services | Danmarks Meteorologiske Institut
The really bad news for climate alarmists is that Arctic winter temperatures have also turned cold.
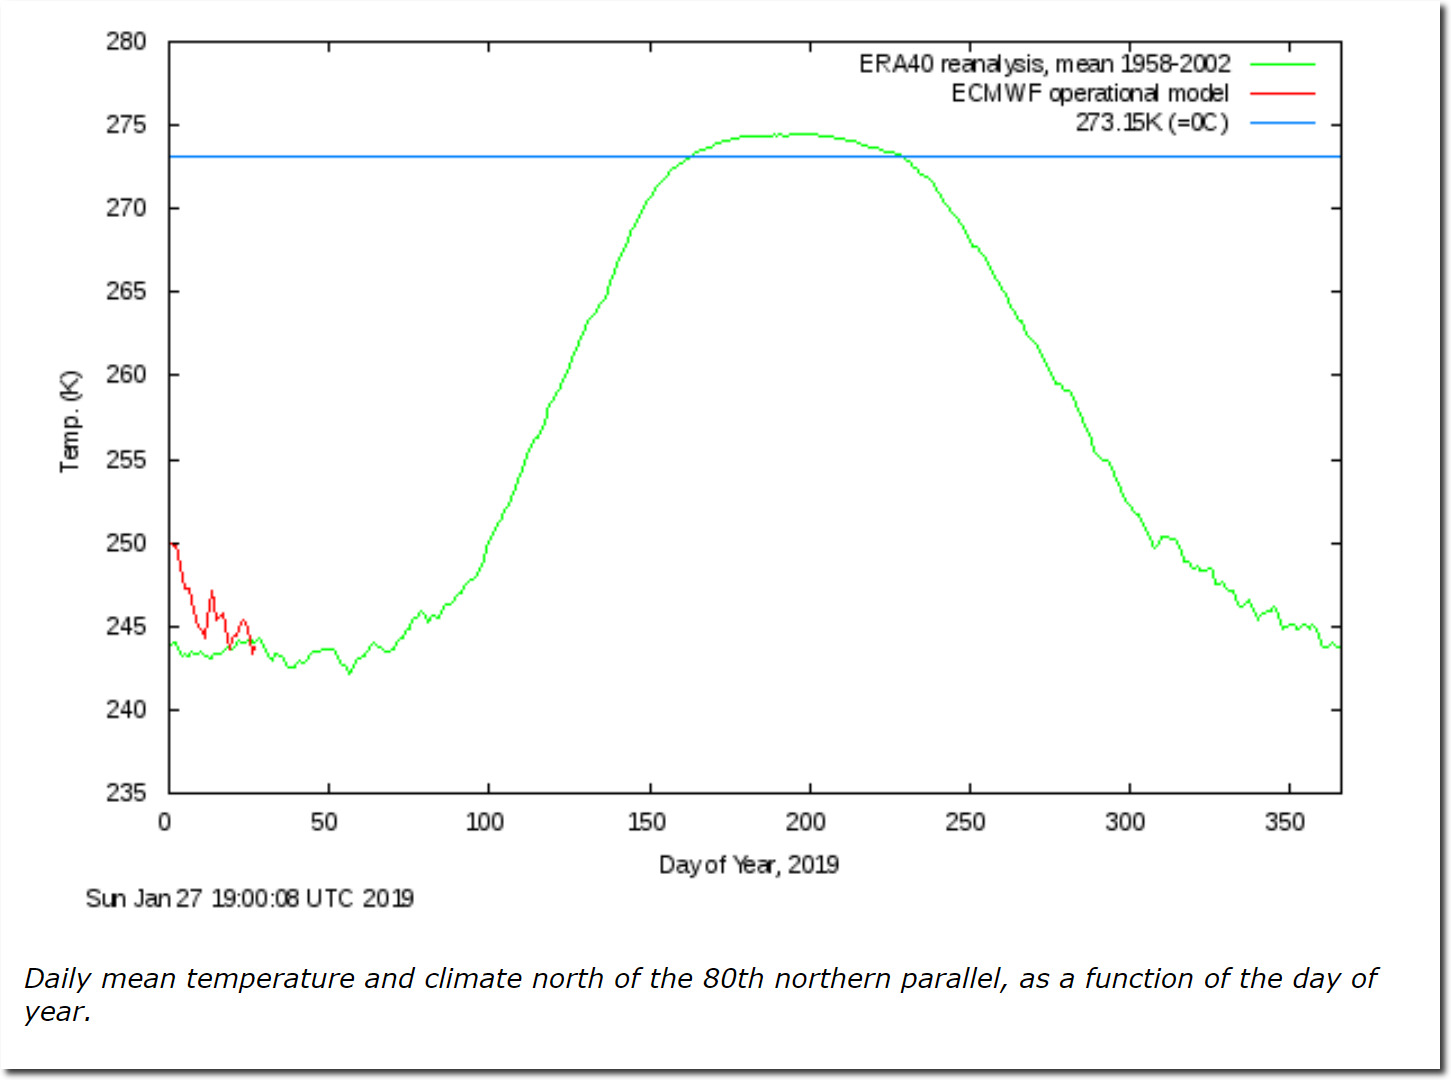
Ocean and Ice Services | Danmarks Meteorologiske Institut
Meanwhile, in Antarctica it is the hottest month of the year – and temperatures are below freezing across almost the entire continent. How is ice supposed to melt below freezing?

