Arctic Sea Ice Volume Increasing For 12 Years

Arctic sea ice volume has been trending upwards for the past twelve years.

Spreadsheet   Data

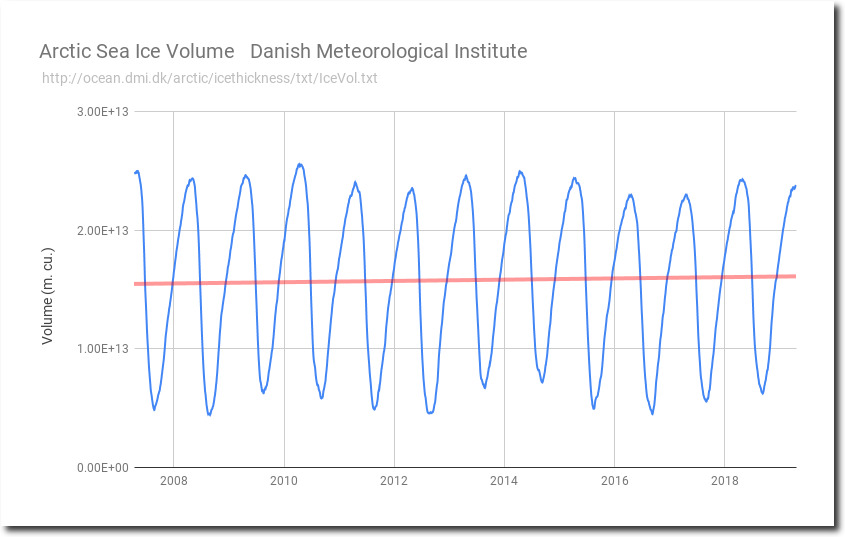
But reality has no place in the climate debate, as alarmists continue to spread lies about essentially everything.

This entry was posted in Uncategorized. Bookmark the permalink.

52 Responses to Arctic Sea Ice Volume Increasing For 12 Years

    • tonyheller says:

      With ice in the Chukchi Sea thickest in years, you are in for another very rough summer of disappointment Griff.

      • John Diamond says:

        Well, this didn’t age very well, did it? There is, today, open water between the pacific and the Canadian Archipelago.

        • tonyheller says:

          Where do these clowns come from?

          • Colorado Wellington says:

            There is, today, open water between Antarctica and Iceland.

          • rah says:

            A very dark and smelly place.

          • John Diamond says:

            It’s really not particularly complicated but is, apparently, for you. It is in no way inconsistent that the volume of ice mid-winter would be increasing while the volume of ice mid-summer is decreasing. What is happening today, in terms of modern history, is, in fact, unprecedented. I know it’s hard for you to understand that the arctic can be warming and yet mid-winter ice is increasing.

          • John Diamond says:

            I guess some you don’t understand that to get from the Pacific to the Canadian Archipelago by water requires the Chuchki to have open water but, I guess geography, like climate science is not your strong suit.

          • Colorado Wellington says:

            John Diamond,

            What period do you consider “modern history”?

          • Gator says:

            Modern history. Is that anything like giant midgets?

    • rah says:

      Yes, everything you post Griff is “utter nonsense”. BTW, why don’t you challenge DMI since it’s their data.

    • Gator says:

      Yes, your link is indeed utter nonsense.

      Why do you hate poor brown people Ms Griff?

    • spike55 says:

      Poor griff, still working from a base of CLIMATE CHANGE DENIAL.

      Did you know that the late 1970s had the highest levels of sea ice since the Little Ice Age, griff?

      Did you know that current level are higher than for some 90%+ of the last 10,000 years?

      Why do you keep exposing your continued IGNORANCE, griff ??

      Did you know that Tony is absolutely correct using DMI data.

    • retired sci says:

      Why would griff use actual observations when he can use model output instead/sarc.

      Sea Ice Volume is calculated using the Pan-Arctic Ice Ocean Modeling and Assimilation System (PIOMAS, Zhang and Rothrock, 2003) developed at APL/PSC.

      • Phil. says:

        And the DMI Volume is calculated using their model.

        “The map, animation and graph illustrate the sea ice thickness in the Northern Hemisphere, excluding the Baltic Sea and the Pacific. The data is based on DMI’s model calculations.”

    • GCSquared says:

      I’m frankly confused. I know that Griff is more-or-less persona non grata on this site, but IMHO, the data he cited should be either refuted or respected. Here’s my impression:
      a) The DMI data runs from about 2007 to present.
      b) The PIOMAS data that Griff cited runs from 1978 to present.
      c) Both data sets roughly agree: the PIOMAS decline from 2007 to now isn’t very pronounced at all, and may well be consistent with the DMI plot, which shows little or slightly positive ice change over the term of its measurements.
      d) Earth’s climate (or at least the West’s) has been recovering from notoriously cold conditions from the early ’70’s. Tony has published historical newspaper reports of scientists predicting a new ice age beginning at that time. Of course, no ice age actually materialized. However, while the climate naturally recovers from this “glacial threat”, it shouldn’t be surprising that data from 1978, e.g. PIOMAS, should be indicating melting along with the expected warming.
      e) Finally, fully expecting rocks (ice balls?) to come down on my head, I ask, is Griff’s PIOMAS data credible? Regardless of interpretation, has arctic ice mass been consistently decreasing or not since the late ’70’s?

      Whether it happened is one thing; what it means is another.

      • Disillusioned says:

        Good post. Two points:

        a) I think DMI dataset begins 2003.

        e) I think the answer may be in the post immediately above yours (retired sci).

        • GCSquared says:

          Actually, the DMI data is modelled as well; after all, sending a longboat fleet out to take direct ice soundings would be a bit impractical. So, in the absence of contrary data, we can accept Griff’s PIOMAS as legit, no? But before yelling that the “record” ice decline from the 70’s is now permitting northwest passage, we should recall Amudsen’s 1903 passage.
          IMHO, trying to discern trends from climate data shorter than a century or 2 is a fool’s errand. (For instance, one Charvatova cycle is 180 years or so).
          I don’t know which is dumber, the panic over 10-50 year trends, or expecting that starving our economy of energy will affect those outcomes.

      • Jason Calley says:

        Hey GCSquared! Good questions, and well worth asking. I admit that I am too lazy at present to dig really deep, but consider this response as just off the top of my head. Are we looking at a cyclic phenomenon or not? My answer is that yes, historical records show that there are probably several overlapping cycles, including one of roughly 60 or 70 years. The peak of that cycle was somewhere in the late 1970s. Keep that in mind and look at griff’s chart again. The trend of the first ten years or so is roughly flat. The same with the last ten years or so. Most of the consistent trend downward is in the middle section. This fits really well with the idea that we are seeing a long cycle of about 60 or 70 years, and are looking at a chart which starts at the high peak and is now passing through the low point. The main mistake in the chart is in applying a linear trend to a data set which is only half a cycle long. Very few things in life are truly linear, and historical records indicate that ice coverage in the Arctic is NOT one of those linear things.

        I would only add just a last word that the CAGW crowd were using the linear trend to predict that the Arctic would be ice free years ago. Their predictions have already failed. Sceptics were predicting that the ice would stop its decline and start to increase. So far, the sceptics have a better track record than the alarmists. The next five or ten years should be definitive one way or the other. Personally, I see a lot more evidence in favor of cyclic variations than I see of the alarmist’s linear extrapolations.

        • Disillusioned says:

          It looks like we have approximately 11-12 years before the AMO trend goes negative. That beginning of the cold half of the AMO cycle is coincidentally aligned with the stooge AOC’s deadline to save the world from out-of-control warming. The leaders at the top of the UN IPCC and other global government AGW hoax propagandists are keenly aware of this – they know there is only one more decade of scapegoating this warm side of a natural cycle.

          If the global communists can enact totalitarian climate ‘fixes’ to this imaginary emergency by then, they may actually be able to convince the terminally gullible that it was their Big Global Gov tyranny that saved the planet (instead of it simply being the return of the cold half of a very natural ~65-yr cycle.

    • Dr. Ramon de Torres says:

      That was 2010, what about 9 years later, today?

    • Redford says:

      Your inability to read your own graph is noted. It also shows a hiatus during the last decade.

    • Pica says:

      Indeed. The Link to the data under the chart
      http://ocean.dmi.dk/arctic/icethickness/txt/IceVol.txt
      does not go anywhere.

  1. GW Smith says:

    Cut down at such a young age! SUV drivers are heartless!

  2. Samuel Prentice says:

    Baby sea ice is now dying off. Oh, the humanity!

  3. Boston Blorp says:

    I couldn’t figure out why your trendline headed upwards when mine pointed down! Then I looked closer and saw you deliberately clipped the first four years of the data you DISINGENUOUSLY linked to as if it were the source of the graph. Sneaky, sneaky!

    • tonyheller says:

      What part of “12 years” is it difficult for you to understand?
      Don’t blame others for your reading comprehension problems.

    • Disillusioned says:

      I couldn’t figure out why…. Then I looked closer….

      Right. He told you upfront what has occurred over the last 12 years. And he gave you the dataset to check his work.

      You already admitted to your lazy mistake. So, why did you then turn it around and DISINGENUOUSLY blame Tony for being sneaky?

    • spike55 says:

      You should be called Boston Blooper.

      You faceplanted big time, fool . :-)

    • Gator says:

      Yeah, describing the length of the graph up front and in the headline is really sneaky, if you are a drooling moron. So now we know what you are.

  4. says:

    Data: your data goes back to 2003. What is your objective, unbiased, scientific reasoning for starting in 2007? Using your data, the trend is negative if you start from 2003, 2004, 2005, or 2006. cherry-picking your data to support your hypothesis is academically dishonest.
    Statistics: First, you are running a trend across data from across the whole season which is nonsensical. You have to compare the trend based on time of the year. If you look at maximum ice concentration (in your cherry-picked period of 2007-2019), it shows a negative trend https://docs.google.com/spreadsheets/d/1SAxunOY7mVuCSQbY2lbAlH1u5tUdwSbLMHfs4l793ho/edit?usp=sharing.
    Comparison to other literature: An important component of scientific research is to relate your findings to what others have found and place your work in the context of the rest of the literature. You will find that other sources similarly find no negative trend since 2007. eg. http://psc.apl.uw.edu/wordpress/wp-content/uploads/schweiger/ice_volume/BPIOMASIceVolumeAnomalyCurrentV2.1.png
    Meaning your work does not contradict the conclusions of other research, which explicitly show the exact same pattern you show. Though they do not misleadingly cherry-pick a subset that supports a biased political hypothesis.

    • says:

      Forgot to mention regarding your statistics that the positive trend you show is not statistically significant. The most you can actually conclude with your cherry-picked data with poor statistics is “ignoring the effect of season on ice volume, there is no significant trend in sea ice volume since 2007-04-20.”

      • tonyheller says:

        Where do these clowns come from?

        • says:

          What specific issue do you have with my comment? I am open to respectful discussion if you are.
          1. What is the reasoning of starting in 2007 and not 2006 or earlier?
          2. what do you say about the negative trend during that period in maximum sea ice volume?
          in addition to the previous comment, I conducted STL decomposition analyses on the data since 2007. this takes into account natural seasonal variation without throwing out data: the patterns in the data presented here align with other data.
          https://imgur.com/a/gpob3LU

          • R Shearer says:

            The satellite record for extent actually goes back to 1972. The data prior to 1979 is inconvenient, as so far 2019 is running ahead of 1974 (Parkinson, et. al.).

          • Jason Calley says:

            Studies of ancient beach profiles along the Arctic Ocean show that it was truly ice free during summers only five or six thousand years ago. Why don’t we start the chart at zero and plot a linear trend forward to today? Hurrah! The ice is growing! Crisis averted!

        • says:

          This “clown” is an Arctic Biologist that works with this data every single day. Where are you from?

          • tonyheller says:

            Then the clown should know that Arctic ice has been increasing for the past 12 years.

          • spike55 says:

            and the clown should know that the current Arctic sea ice level is FAR higher than for most of the last 10,000 years.

            Seems he is VERY ignorant.

      • spike55 says:

        “there is no significant trend in sea ice volume since 2007”

        Yep, the melting from the anomalous HIGH of the late 1970s has stopped,

        Your point is ?

        The current levels are still in the TOP 10% of the last 10,000 years

        Levels are probably about the same as they were in the 1940s.

  5. Ron says:

    Was my previous comment deleted?
    why does this post limit data to 2007-2019 when the data goes back to 2003?
    Trends since 2003, 2004, 2005, and 2006 are all negative.
    and if you take into account seasonal variation, the trend of maximum sea ice since 2007 is negative too.
    https://docs.google.com/spreadsheets/d/1SAxunOY7mVuCSQbY2lbAlH1u5tUdwSbLMHfs4l793ho/edit
    A more robust robust statistical approach would be something like STL decomposition that incorporates seasonal fluctuations. I ran the stats in R (on the same 12 year period), here are the results:
    https://imgur.com/a/sKCyW1v
    .no long-term positive or negative trend. short-term time-frame only shown inter-annual variation.
    https://imgur.com/a/gpob3LU
    Also, data from other sources that support anthropocentric climate change also show no significant trend in ice volume since 2007. This information is not excluded or hidden; it’s looked at in the context of trends since 1979.

    • tonyheller says:

      Ice volume has increased for the past 12 years. James Hansen predicted it would be gone by 2018. Al Gore predicted it would be gone by 2014. Hopefully climate alarmism will be gone soon too.

    • Gator says:

      “The data” goes back much further than 2003.

      The indoctrinated Borg Doomers just cannot understand a simple concept like, Arctic Sea Ice Volume Increasing For 12 Years. The brainwashing is complete.

      • says:

        Regardless of the data before 2003, why does this post not show the trend from 2003 to 20019? Why does it start in 2007?

        • Gator says:

          BECAUSE IT IS ABOUT THE PAST TWELVE YEARS YOU GENIUS OF A BIOLOGIST!!!

          IF YOU STILL DO NOT UNDERSTAND, ASK A MATHEMATICIAN TO EXLAIN IT TO YOU.

          Really? What is it with these clowns? LOL

          • says:

            Why are we only looking at the last 12 years? Why not 13?

          • Gator says:

            Try rereading the title of the post, and maybe banging your head against something hard. And again, you may need to phone a friend.

            Do biologists have to pass any math classes?

          • says:

            Circular reasoning. Why did they look at 12 years? “because the title of the post is 12 years.” why is the title saying 12 years? “because that’s what they looked at.”
            But why did they look at 12? why do we not care about 13 years? where did the number 12 come from? did they just pull it out of a hat? what was the reasoning?
            “I have 16 years of data. But I will only look at the trend over 12 years because ________.”
            The fact is. The OP chose 12 to push his view and agenda; that is misleading, dishonest, and people who present misleading data should be ignored. You may say you don’t listen to climate scientists because you believe they are misleading; you’d be wrong, but that’s ok. But if you listen to tonyheller at the same time, then you are either a hypocrite or a fool. So which is it?

          • Gator says:

            You really have it bad.

            Why do you not question the alarmist graphs? They only use four decades when we know that we are in a 10,000+ year interglacial?

            Your hypocrisy is showing! LOL

        • spike55 says:

          Or you could look at this graph , which shows that the late 1970 had anomalously HIGH sea ice levels, Up there with the Little Ice Age

          Note the total lack of sea ice off Iceland for most of the years before that coldest of periods.

          Or you can remain an ignorant gullible fool.

  6. spike55 says:

    Talk about a zero trend for 12 years. MASIE .. going nowhere.

    Since the volume has a slight positive trend, it seems the ice is getting THICKER on average over the last 12 years.

    There is still one HECK OF A LOT of sea ice up there. !

Leave a Reply to Dr. Ramon de Torres Cancel reply

Your email address will not be published. Required fields are marked *