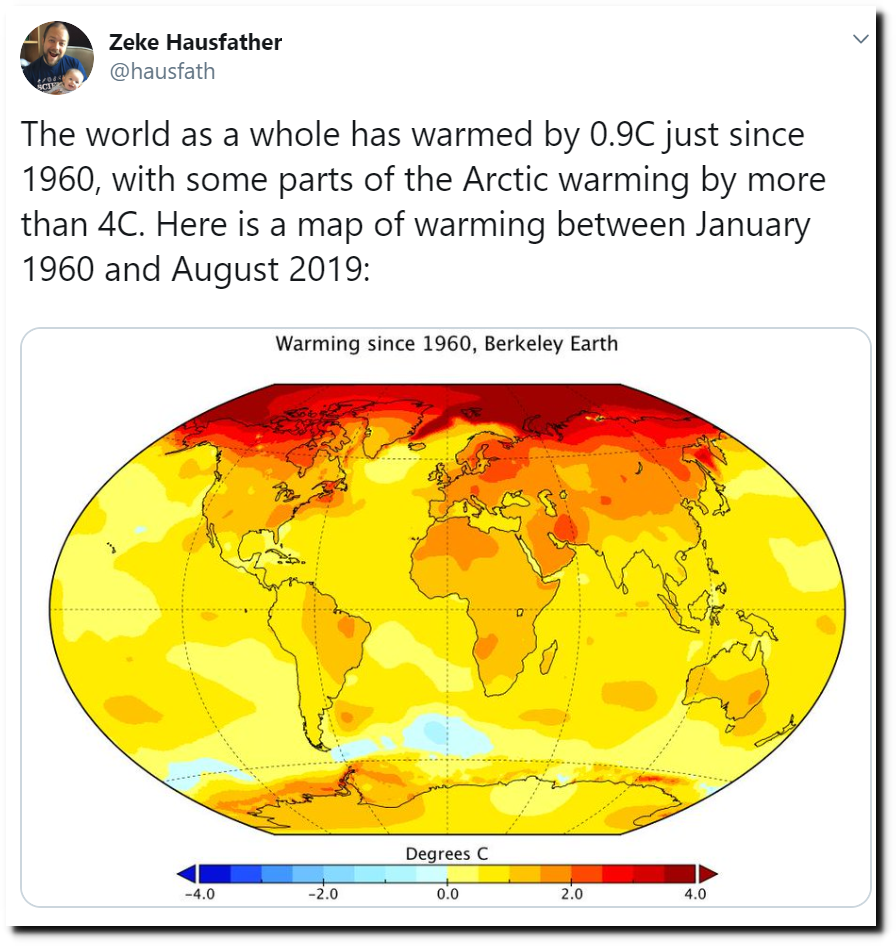
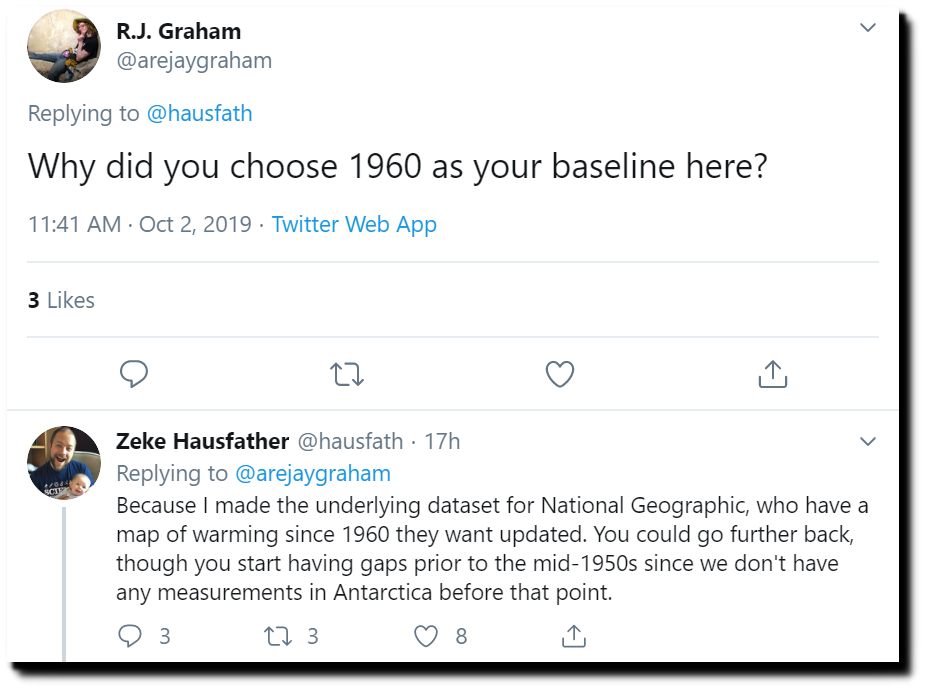
Zeke from Berkeley Earth shows the whole earth burning up since 1960, particularly the Arctic – which has warmed “by more than 4C.
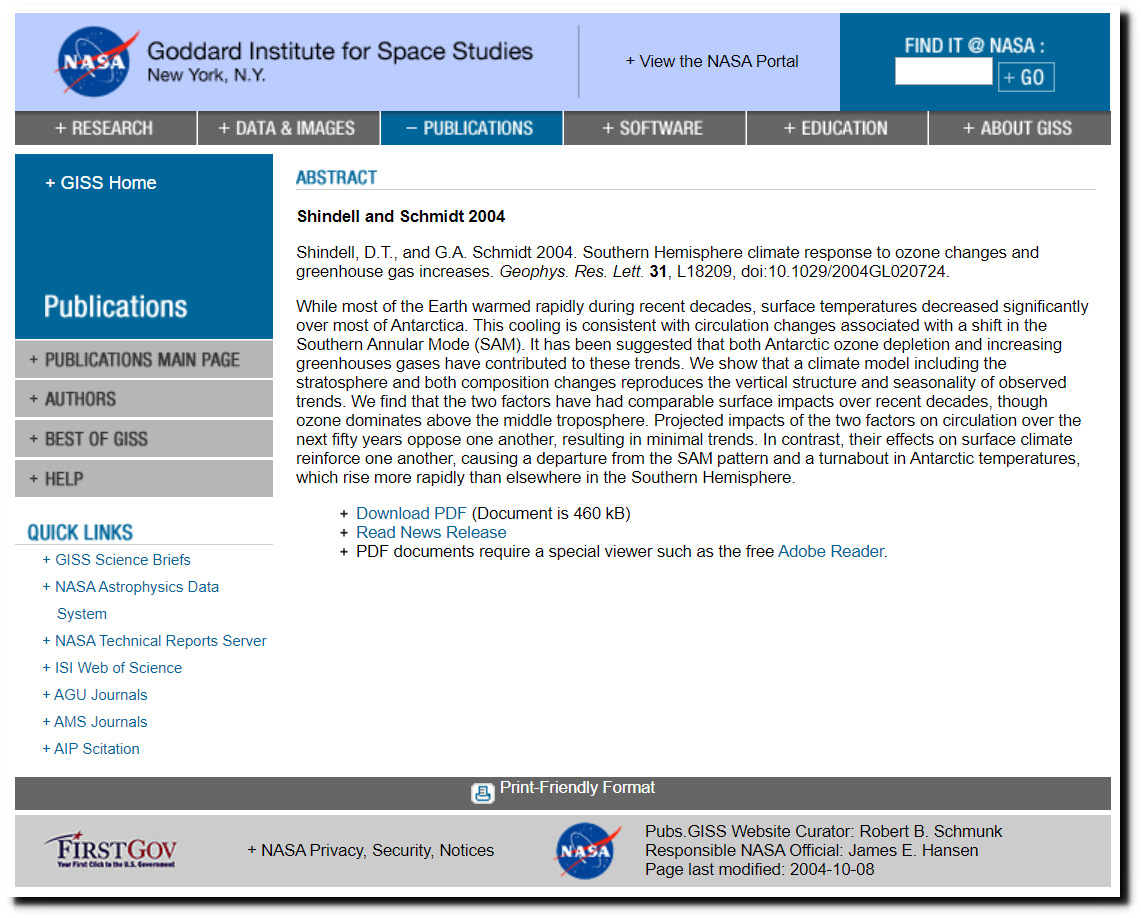
He shows Antarctic warming, which NASA wrote in 2004 had cooled significantly.
Pubs.GISS: Abstract of Shindell and Schmidt 2004
SVS: Antarctic Heating and Cooling Trends
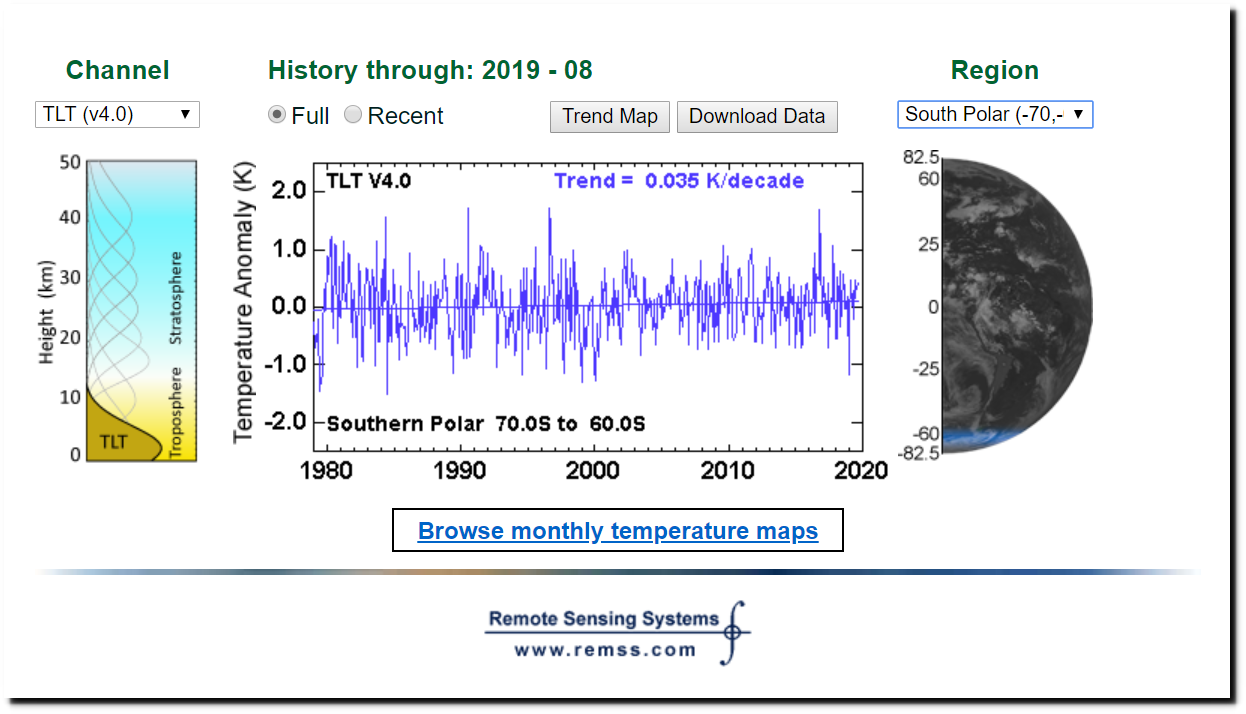
Satellites show no warming in Antarctica, since 2004 – so we can see that the Berkeley earth trends for Antarctica are incorrect.
RSS / MSU and AMSU Data / Time Series Trend Browser
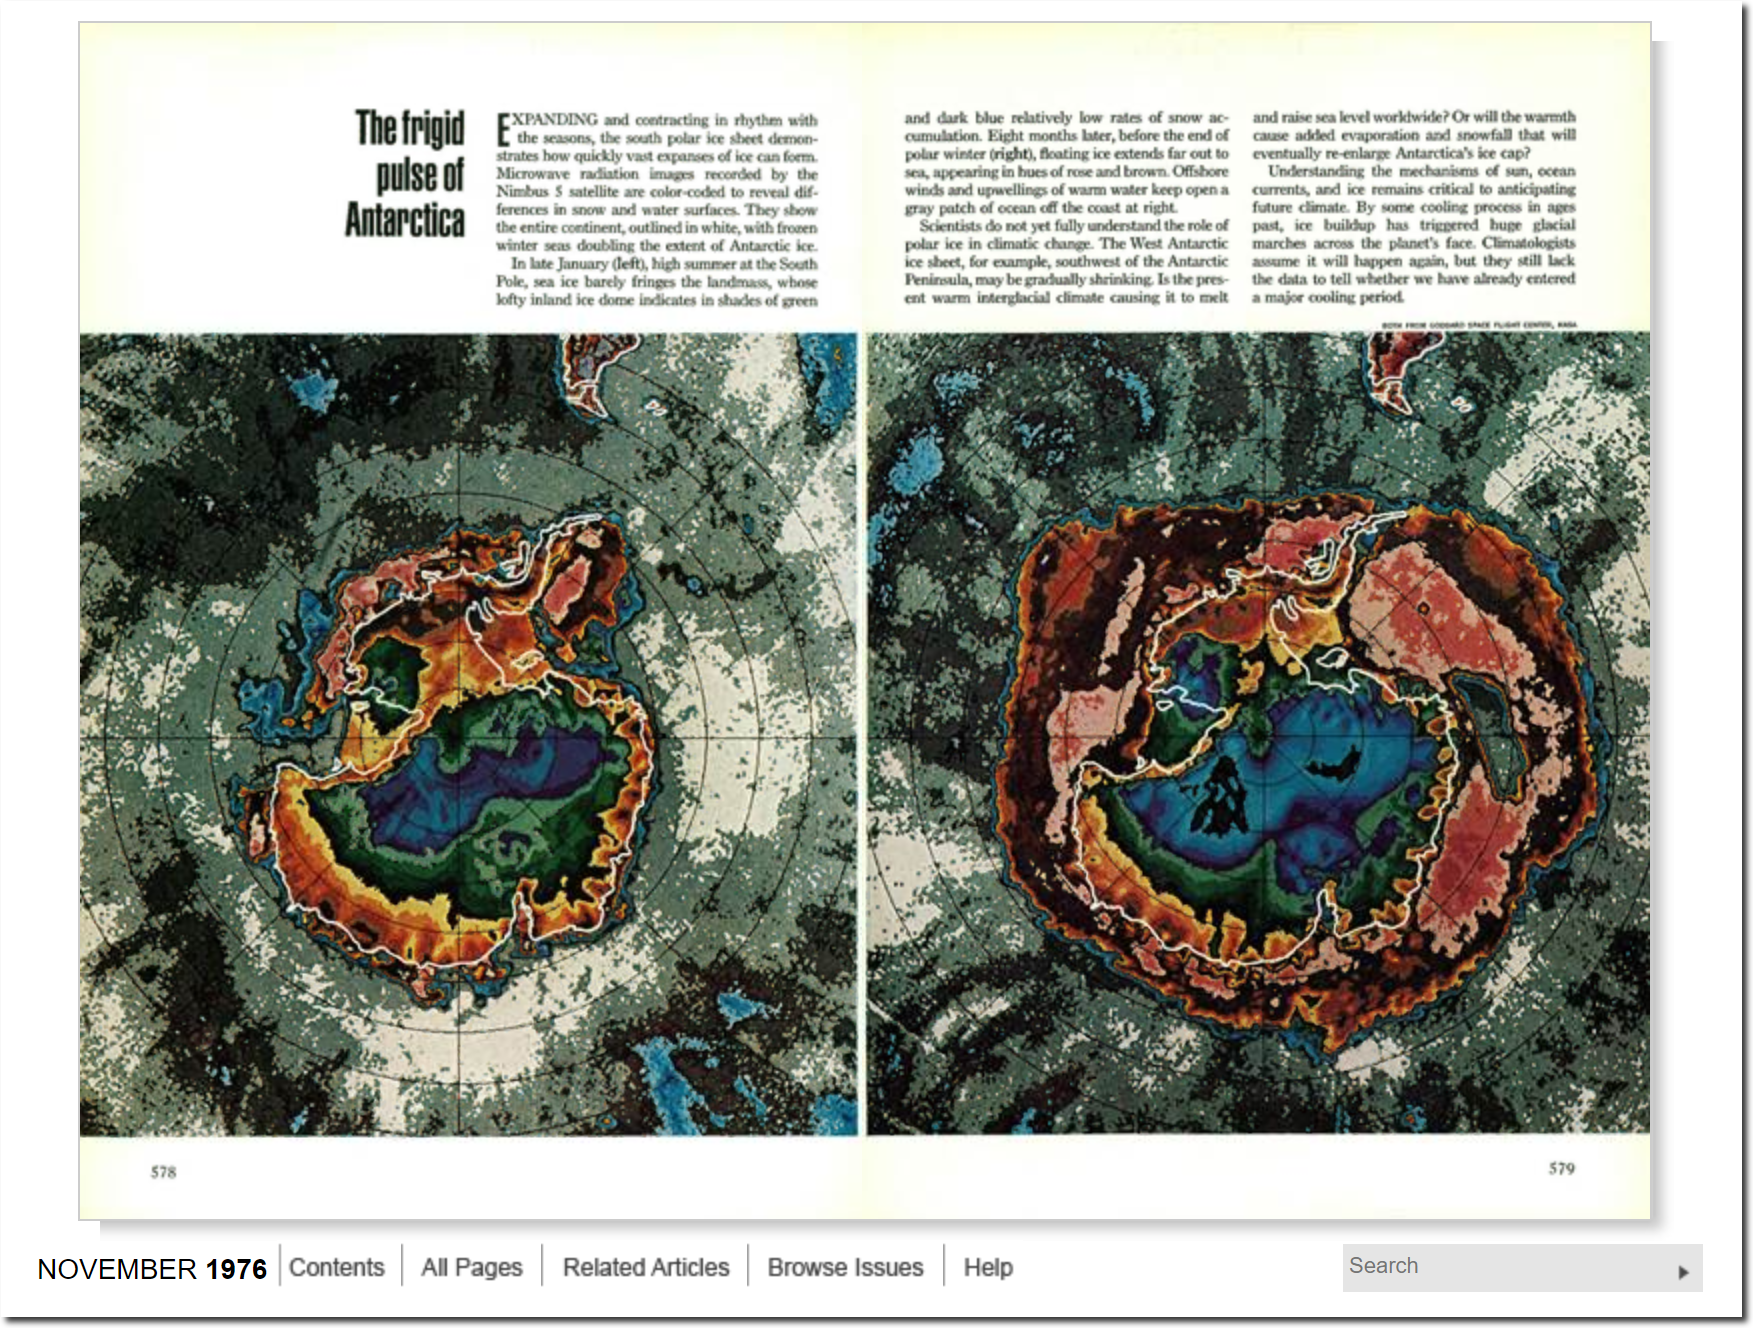
There was almost no sea ice around Antarctica in January 1976
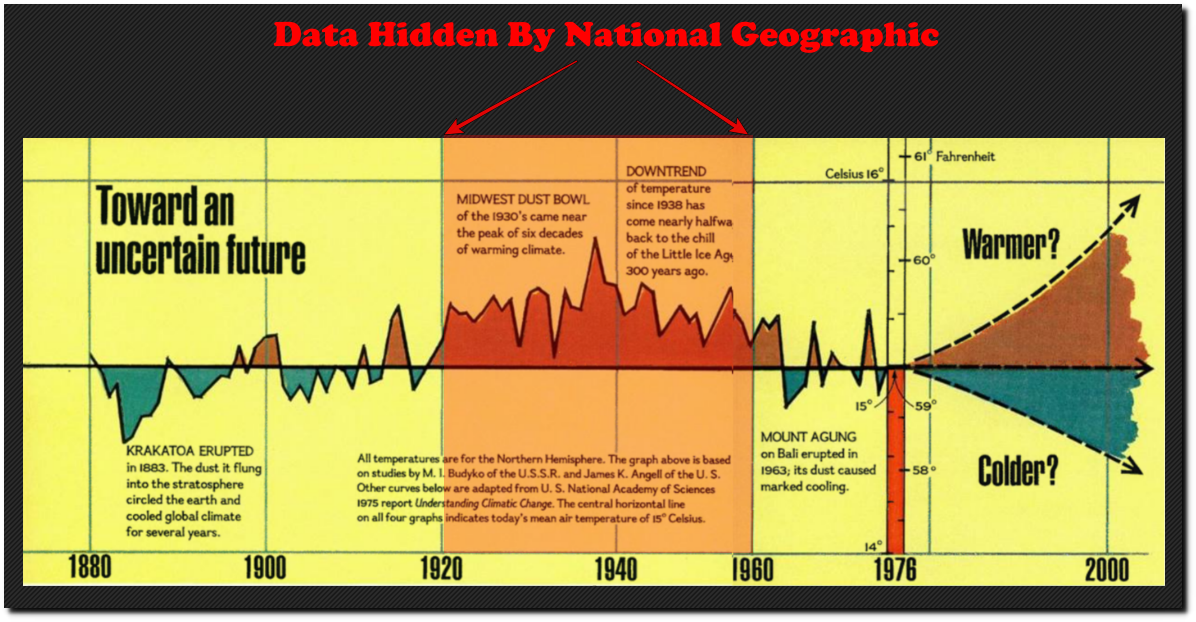
The National Geographic Archive | November 1976 | page 1
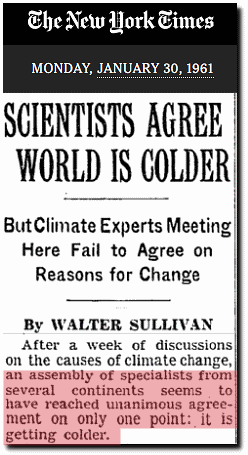
Now let’s look at why Zeke chose 1960 for a start date. There was a unanimous consensus Earth was cooling.
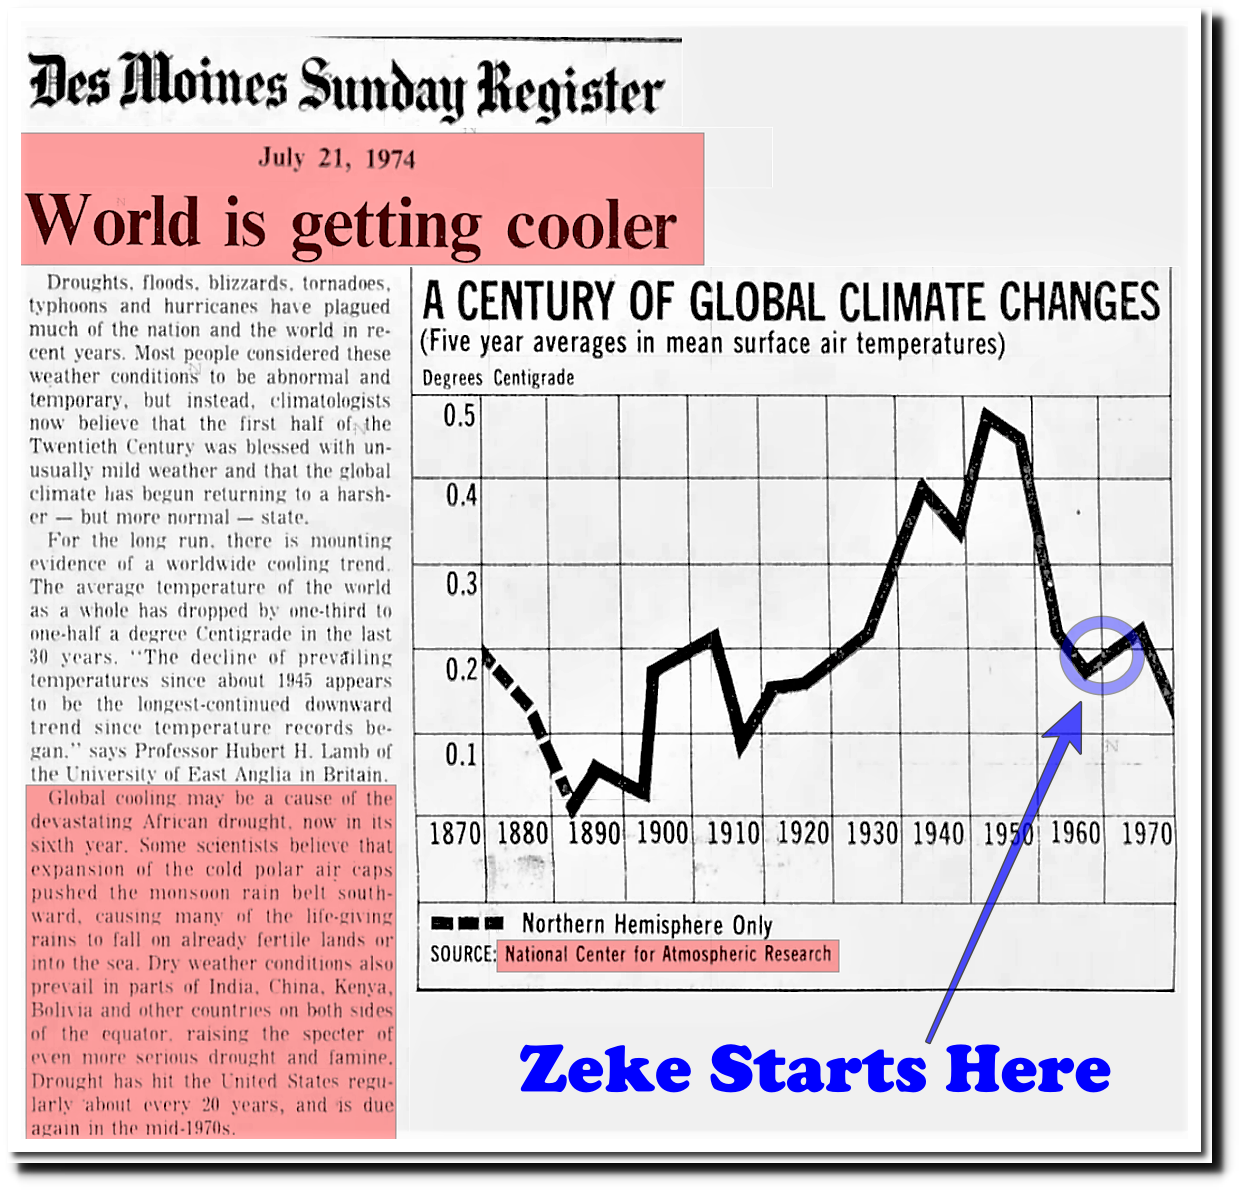
Earth had cooled sharply prior to Zeke’s start date.
21 Jul 1974, 13 – The Des Moines Register at Newspapers.com
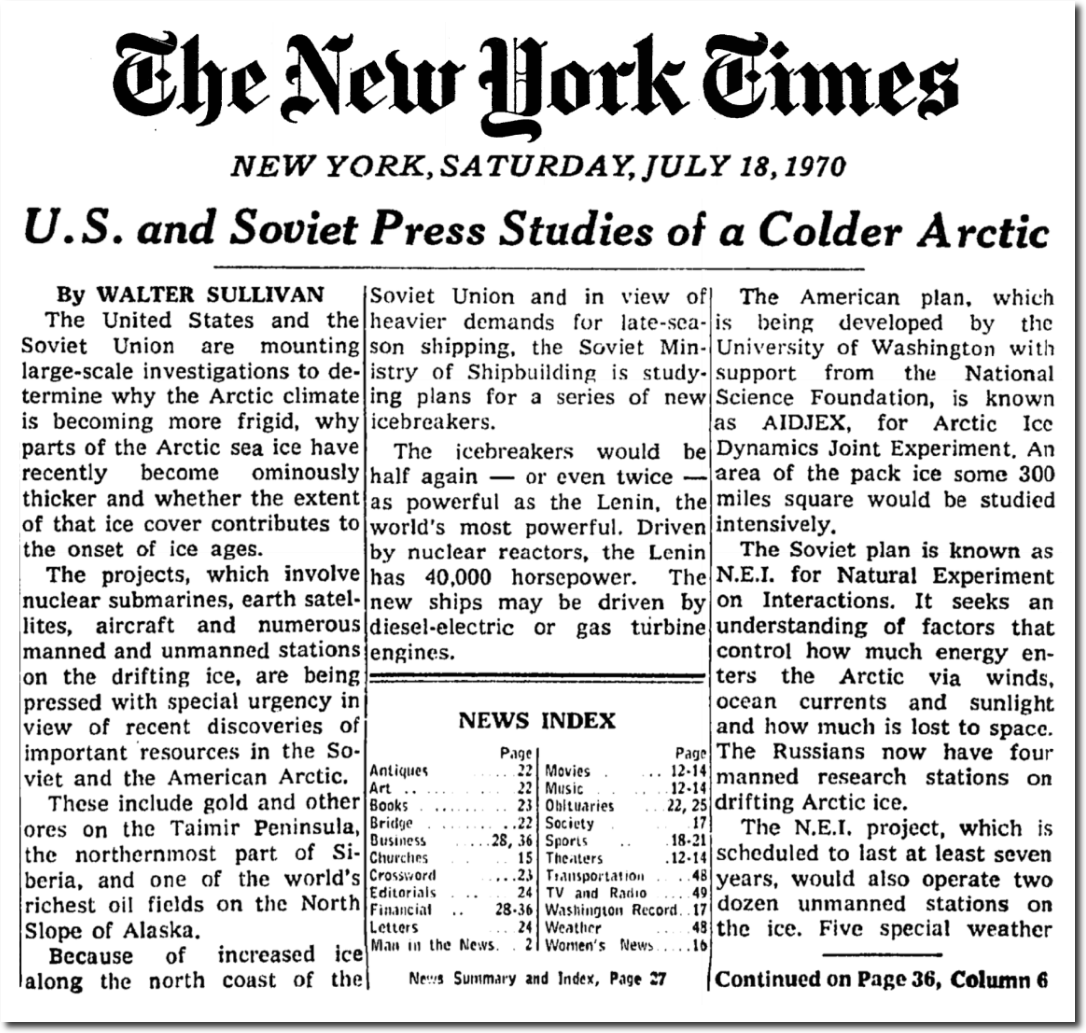
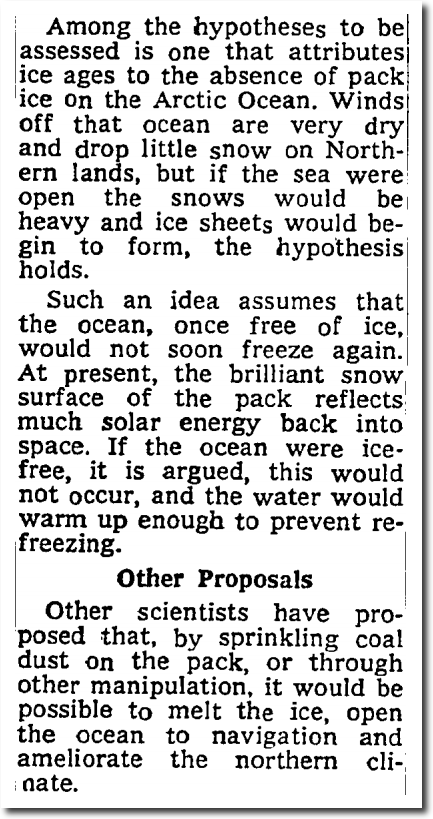
Scientists were talking about a new ice age.
U.S. and Soviet Press Studies of a Colder Arctic – The New York Times
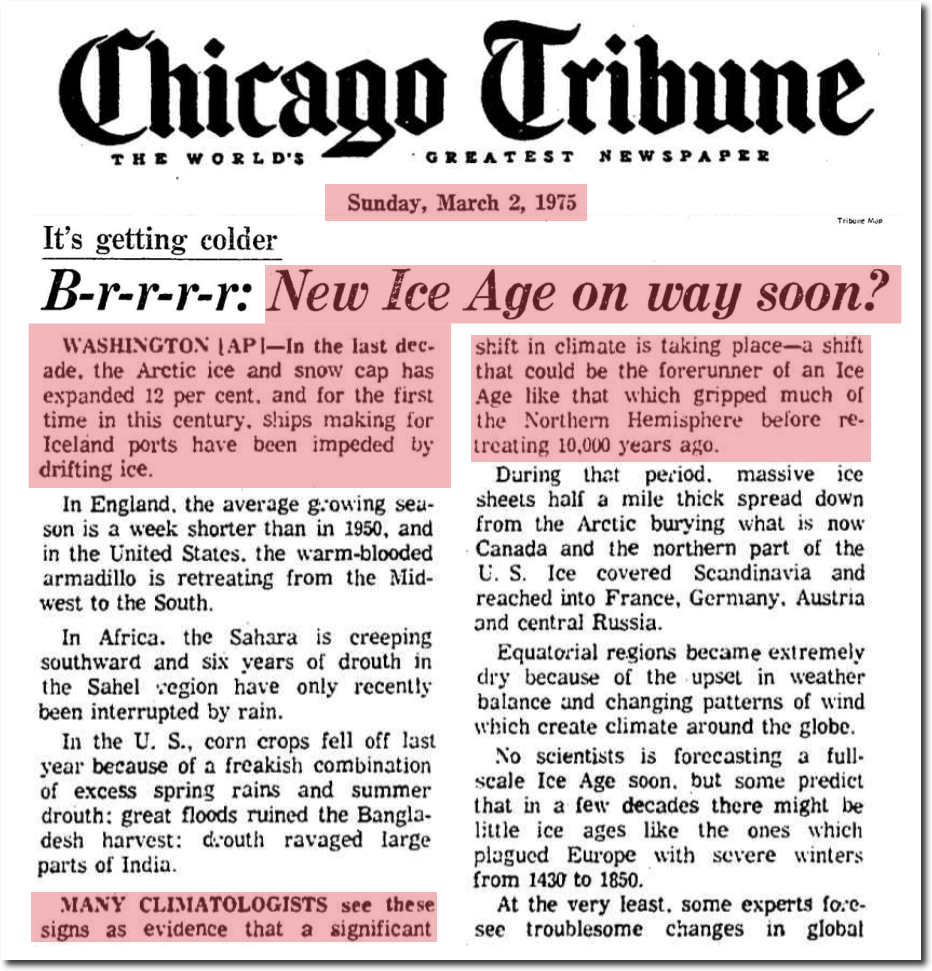
Iceland was blocked by sea ice for the first time in at least 75 years.
March 2, 1975 – B-r-r-r-r: New Ice Age on way soon? | Chicago Tribune Archive
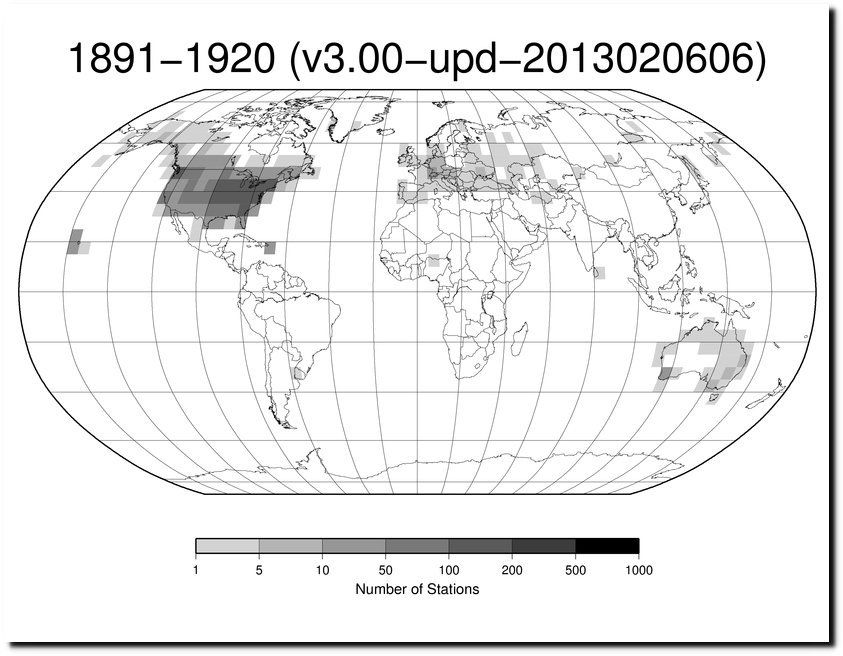
Next let’s look at the US, which is one of the few places on Earth with good historical coverage.
ftp://ftp.ncdc.noaa.gov/pub/data/ghcn/daily/figures/station-counts-1891-1920-temp.png
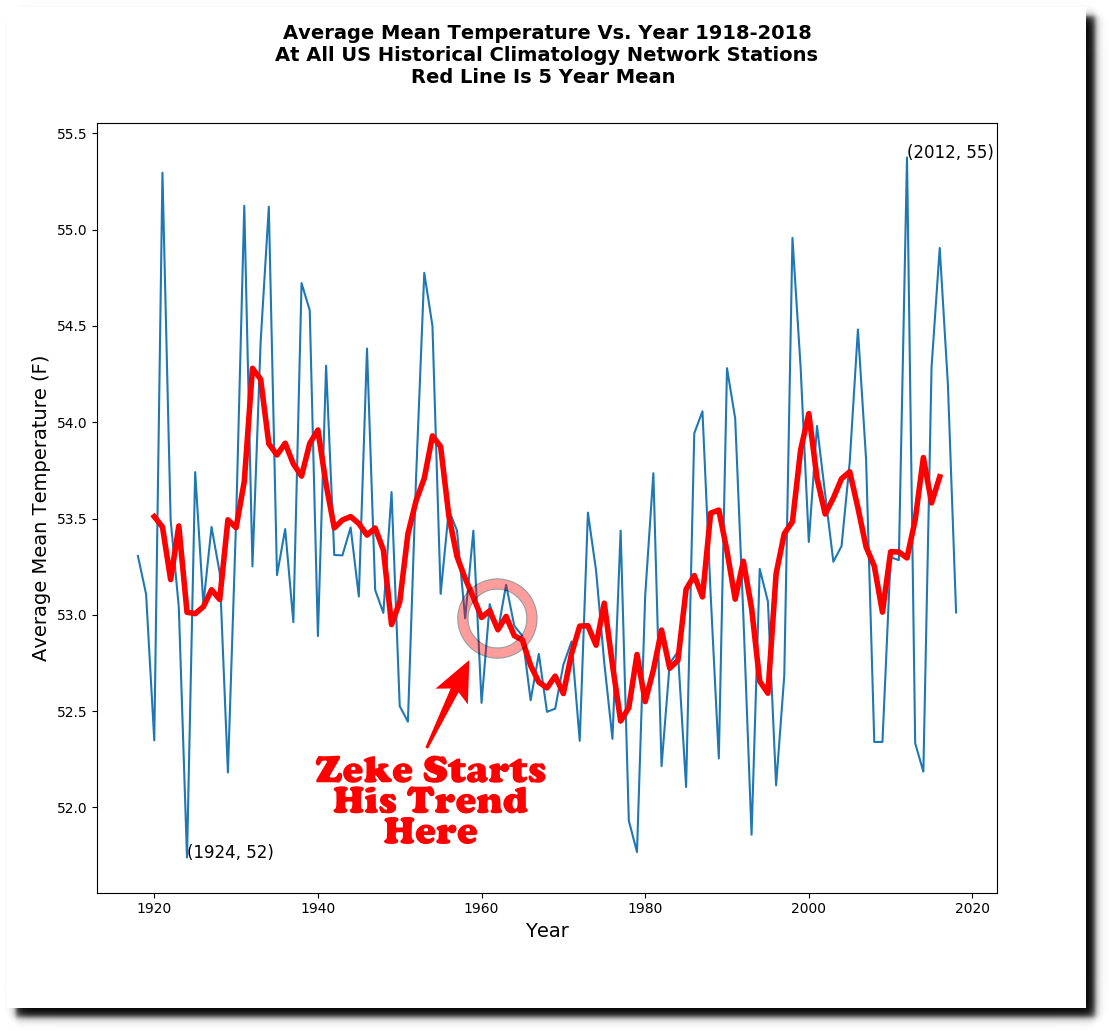
Zeke starts his map near the end of a 30 year cooling trend.
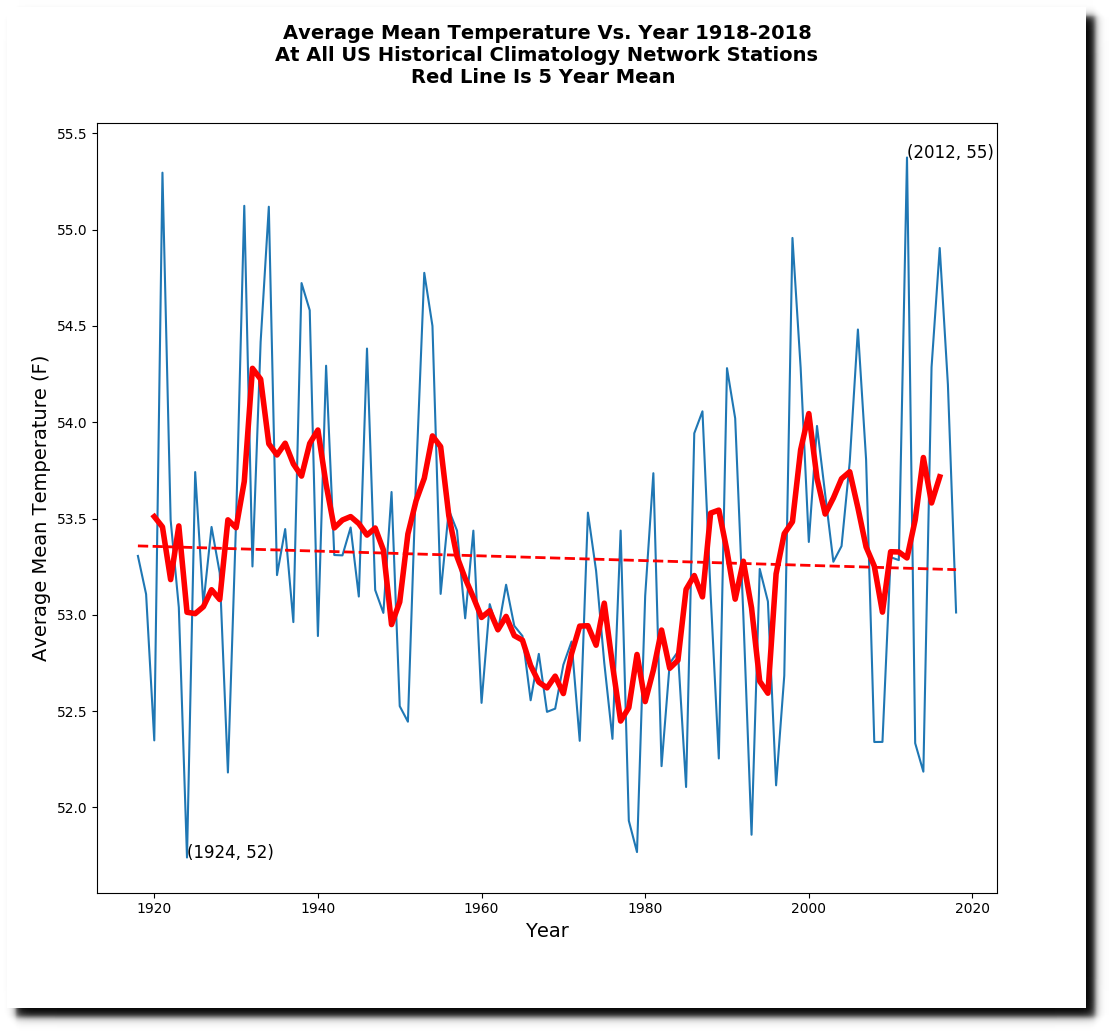
The US has been cooling over the past century.
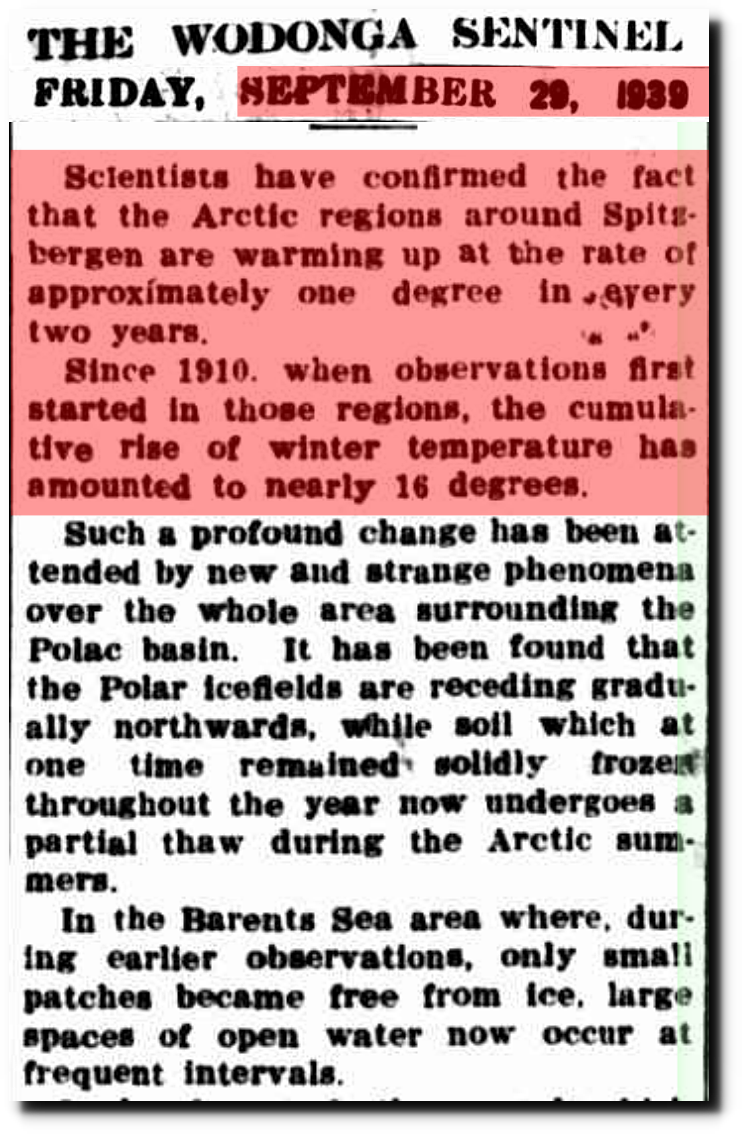
Now let’s look at the Arctic data which is being hidden. There was 9C Arctic warming by 1939, and sea ice was disappearing
29 Sep 1939 – What is The World Coming To? – Trove
Zeke starts his trend map right at the low point for Arctic sea ice.
Projecting the climatic effects of increasing carbon dioxide (Technical Report) | SciTech Connect
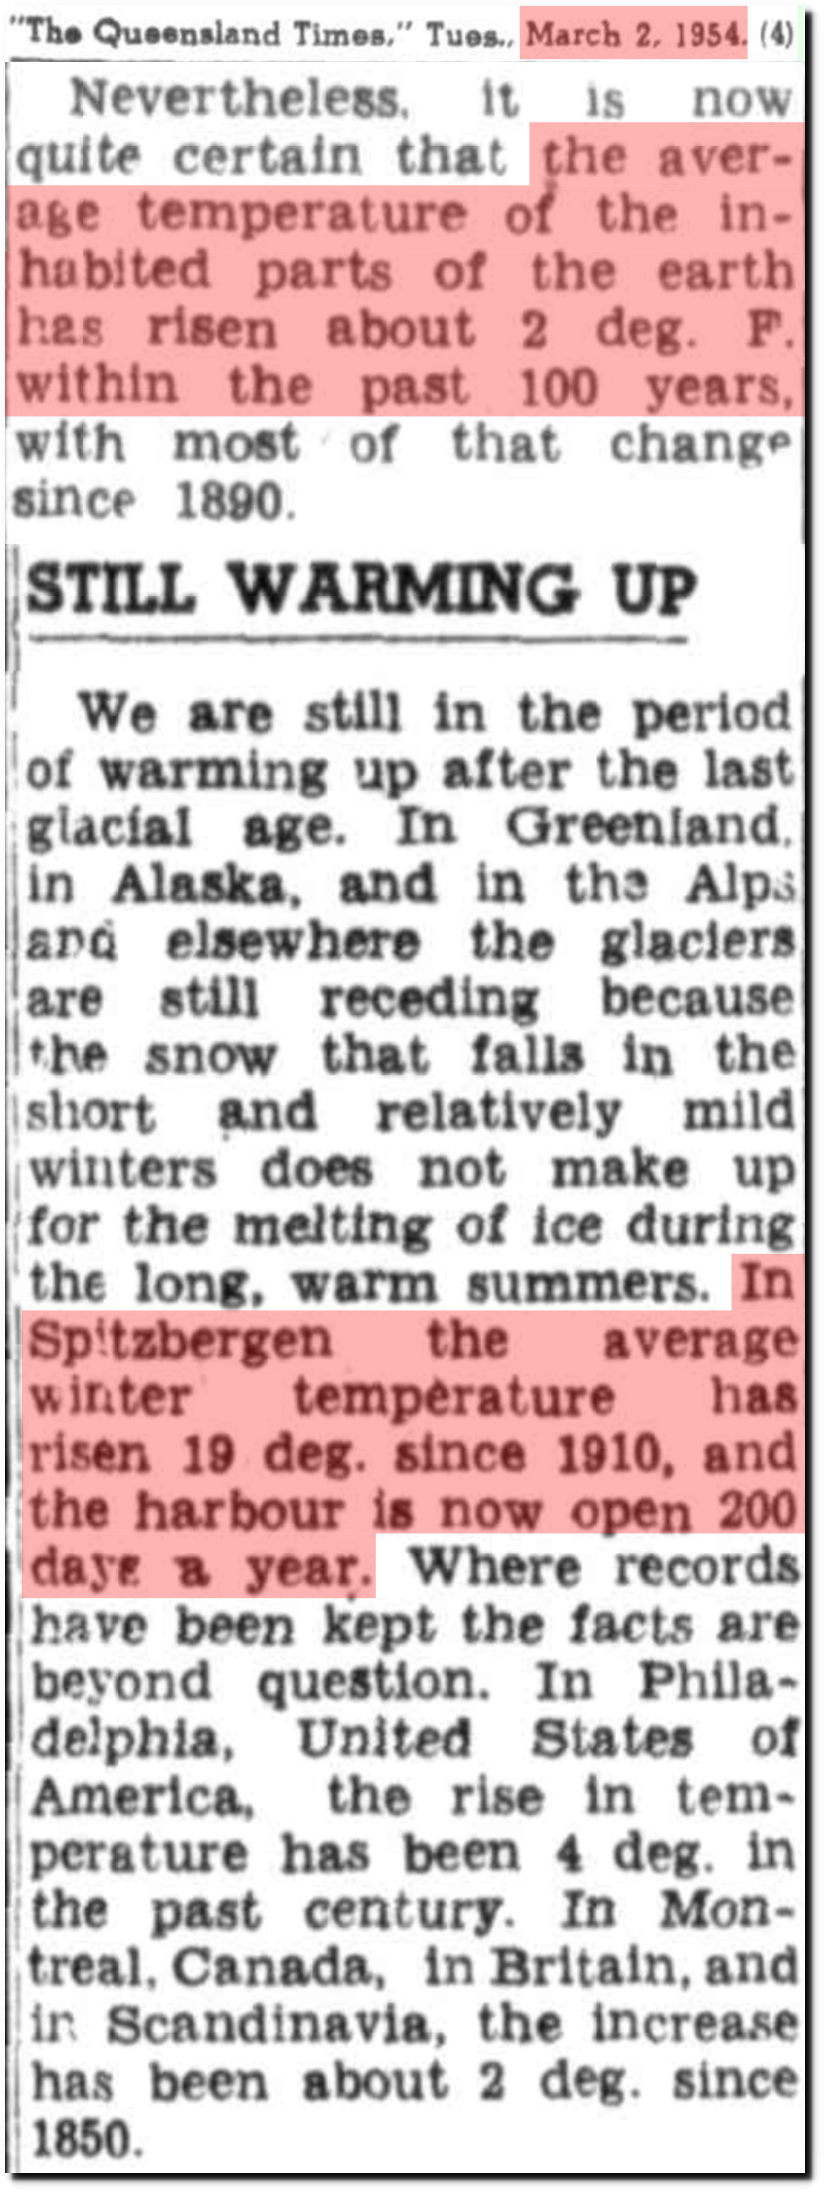
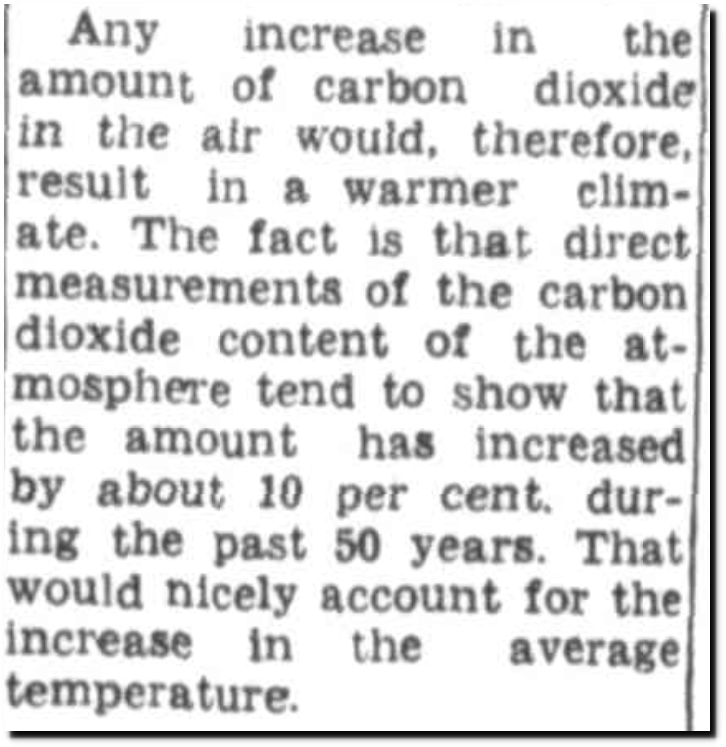
There was 11C Arctic winter warming by 1954, and scientists blamed it on CO2 – right before temperatures plummeted into the ice age scare.
02 Mar 1954 – Canadians to Move Town Threatened by Thaw – Trove
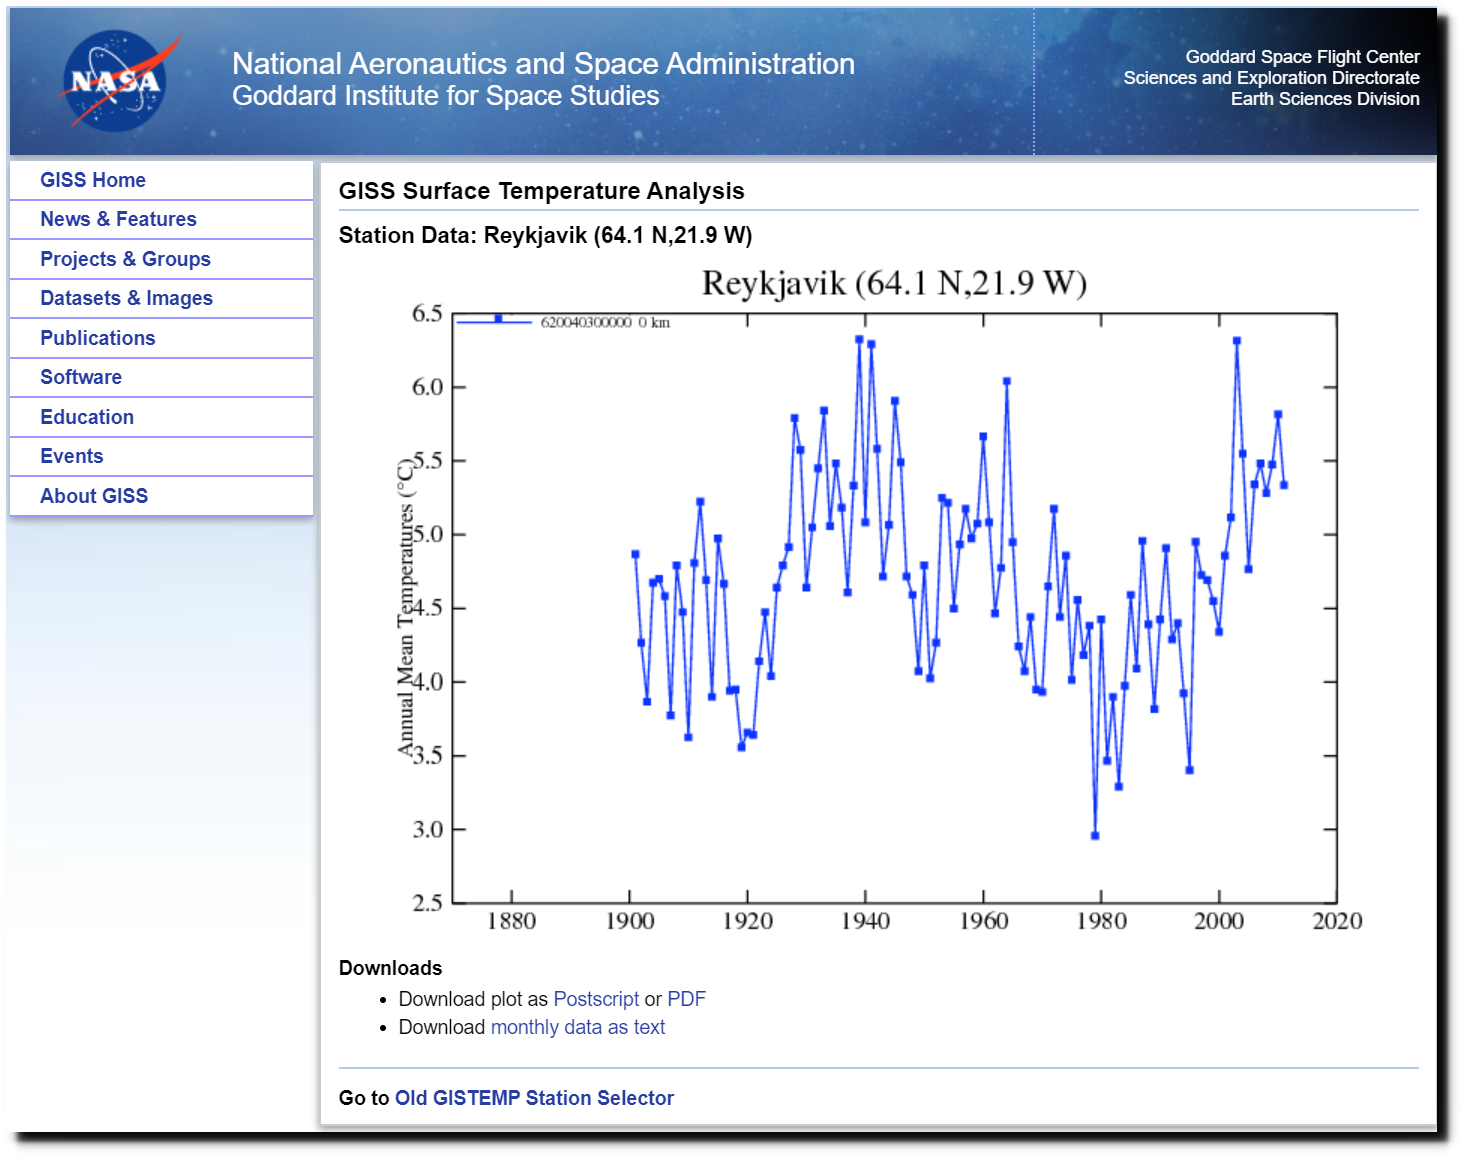
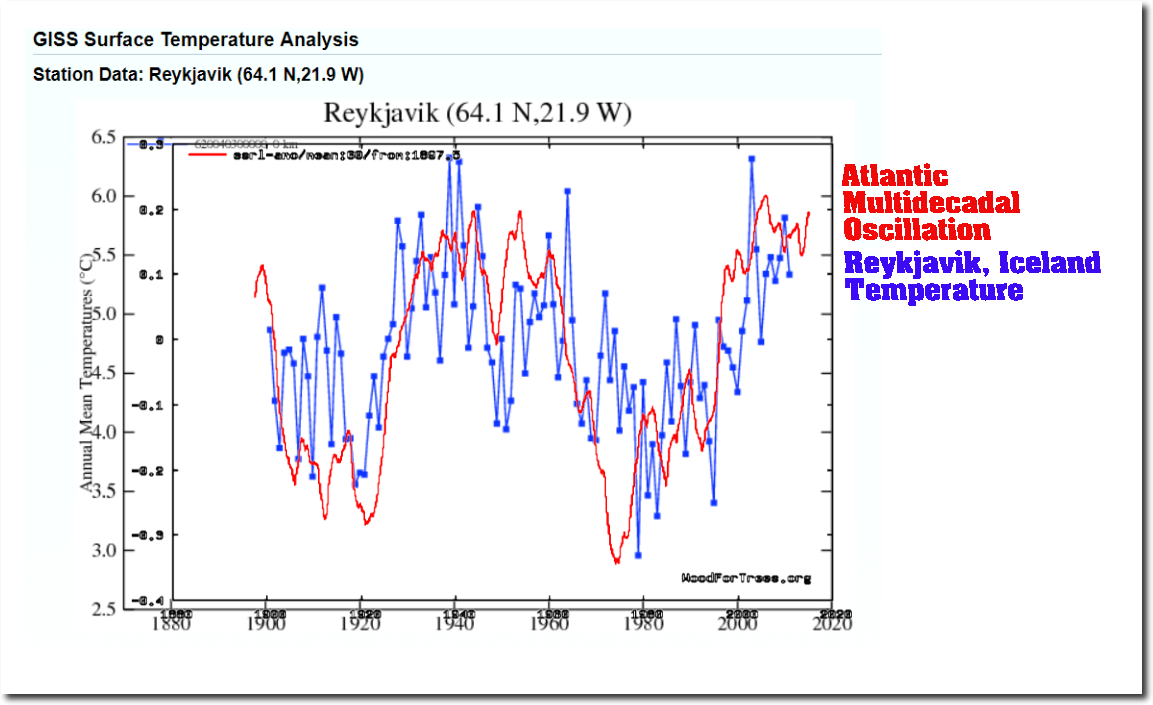
Arctic warming and cooling cycles correlate with an ocean circulation pattern – the AMO – not CO2.
Data.GISS: GISS Surface Temperature Analysis
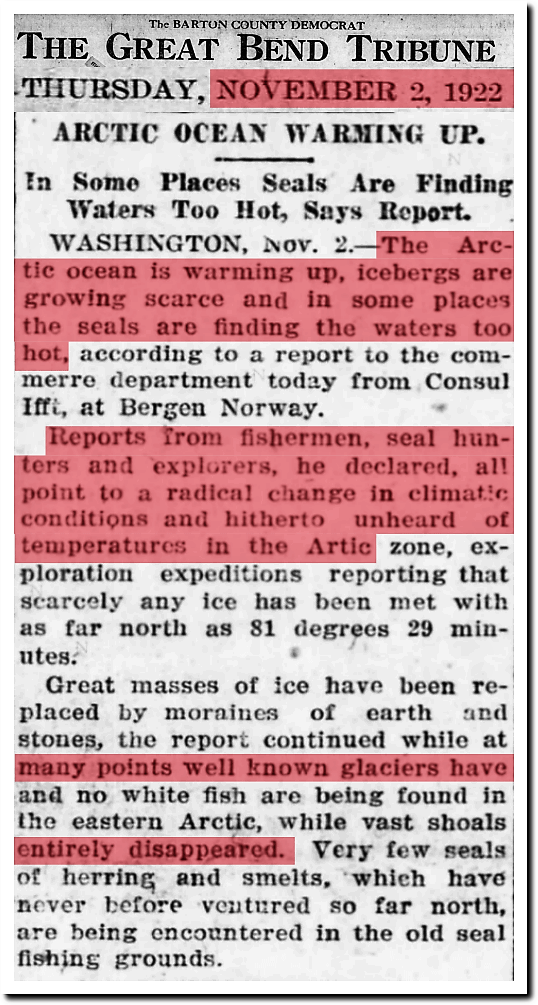
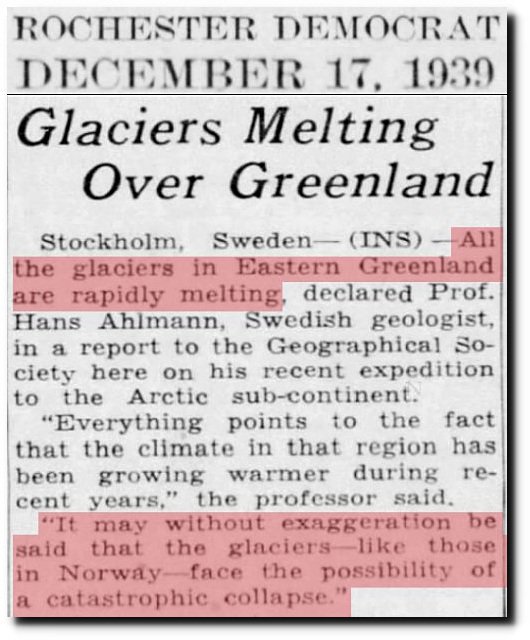
Zeke has good reason to hide the Arctic data before 1960.
31 May 1947 – MELTING ICE CAP DANGER – Trove
10 Mar 1955, Page 3 – Democrat and Chronicle at Newspapers.com
2 Nov 1922, Page 1 – Great Bend Tribune at Newspapers.com
17 Dec 1939, Page 15 – Harrisburg Sunday Courier
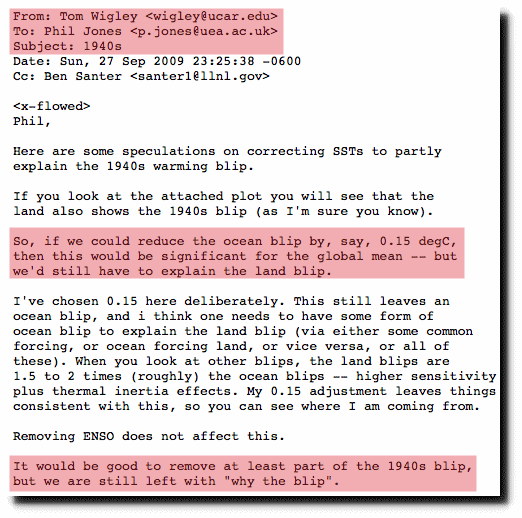
Climate scientists have wanted to hide the warmth of the 1940’s – and that is exactly what they are doing.
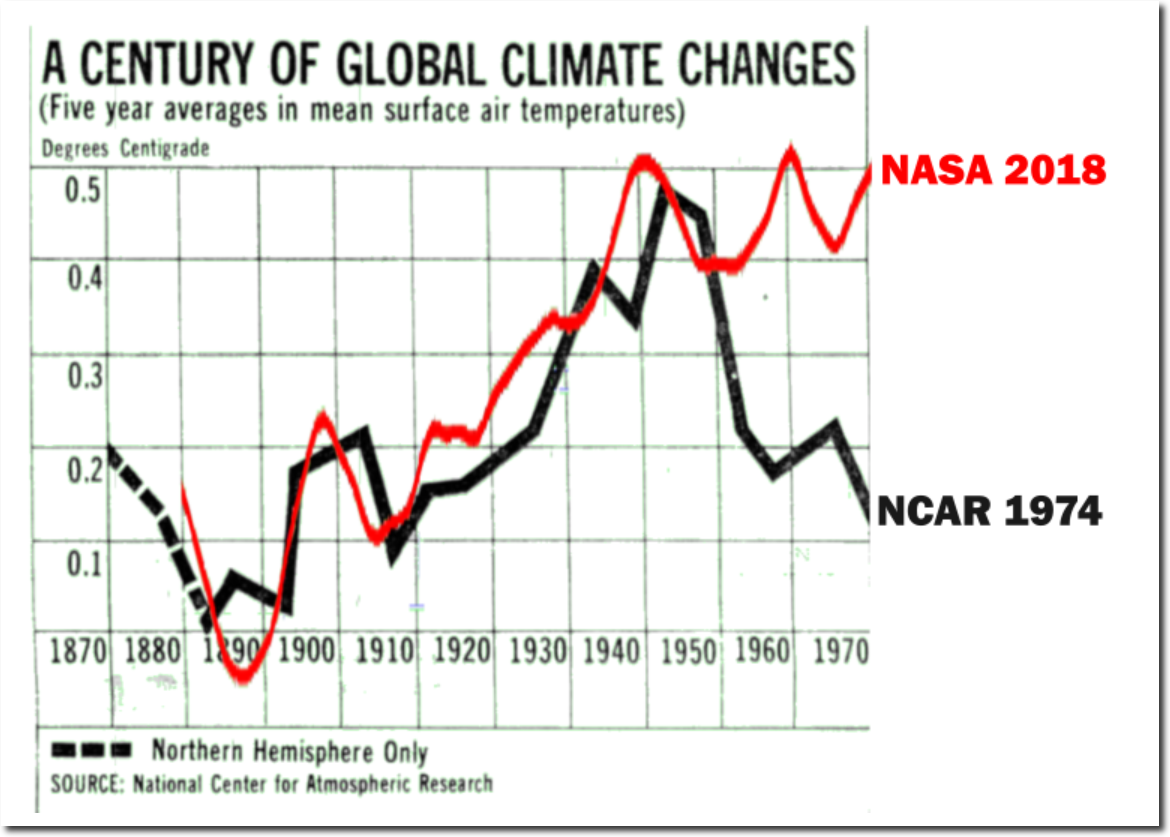
Zeke has now completely erased it. He blames it on National Geographic.
So the next question is – why is National Geographic hiding the warm pre-1960 data from their November 1976 graph?

