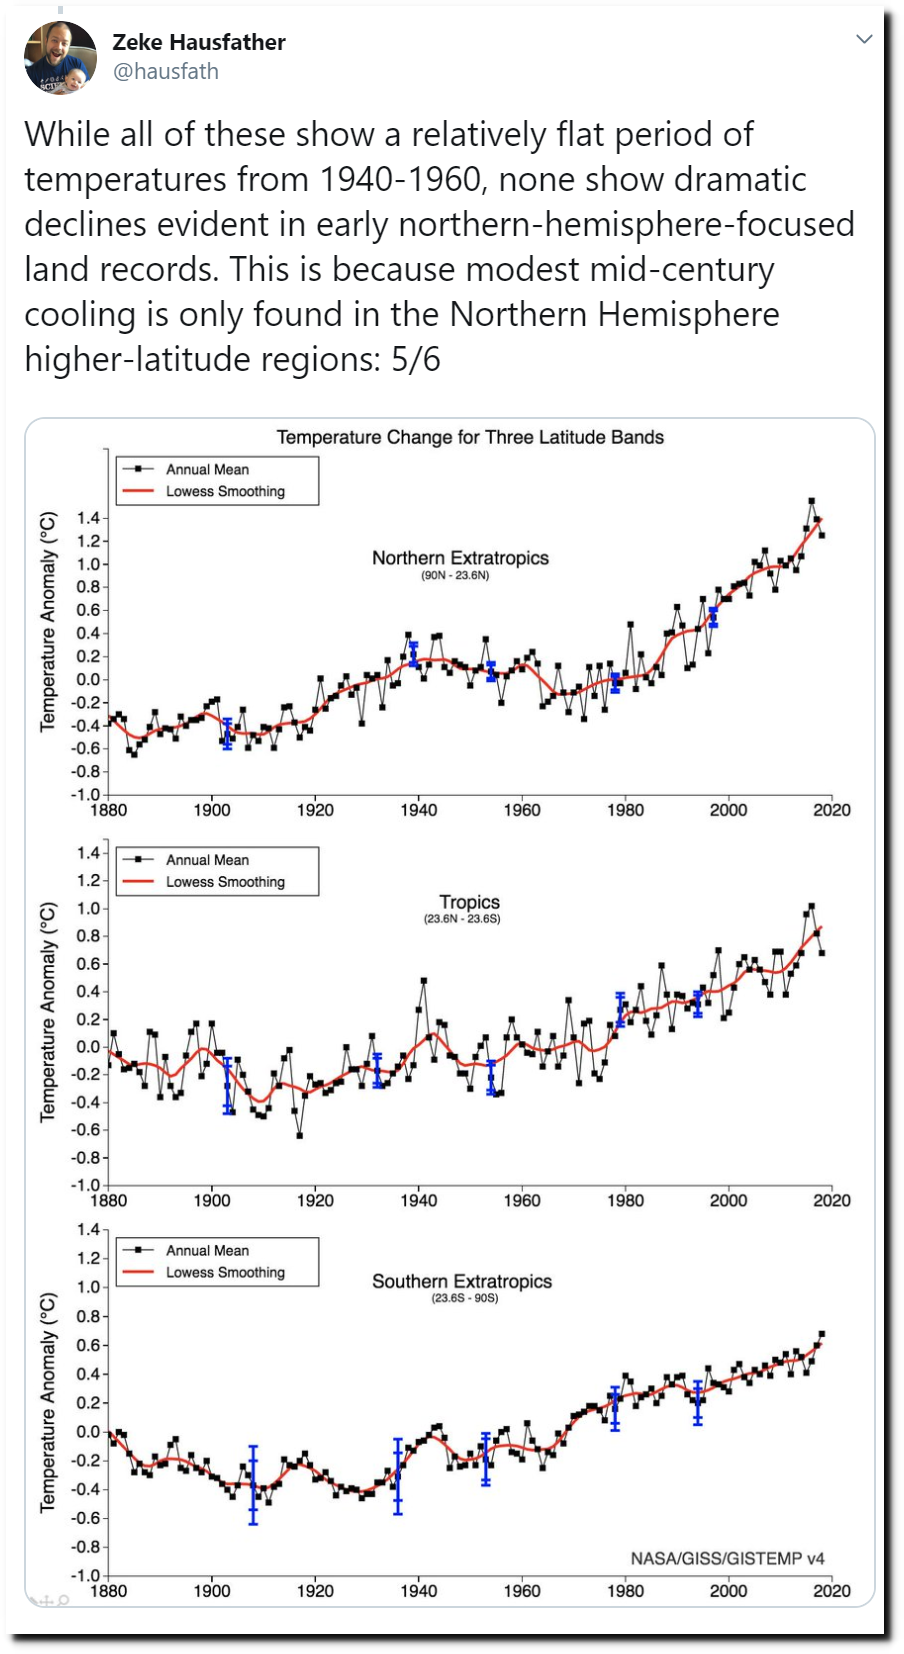
Zeke claims that there was no cooling in the Southern Hemisphere from 1940-1960, and he uses NASA temperature graphs as his evidence.
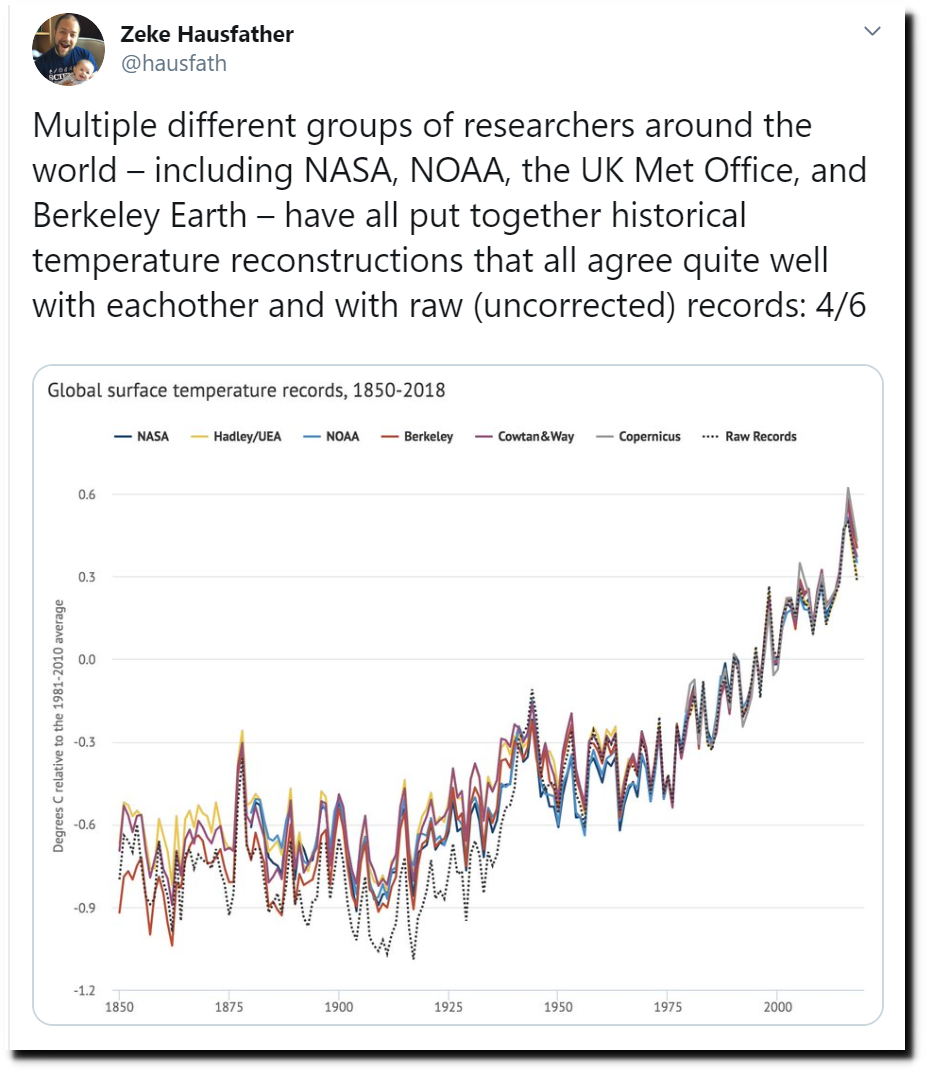
He also says every group of government researchers around the world agrees about this.
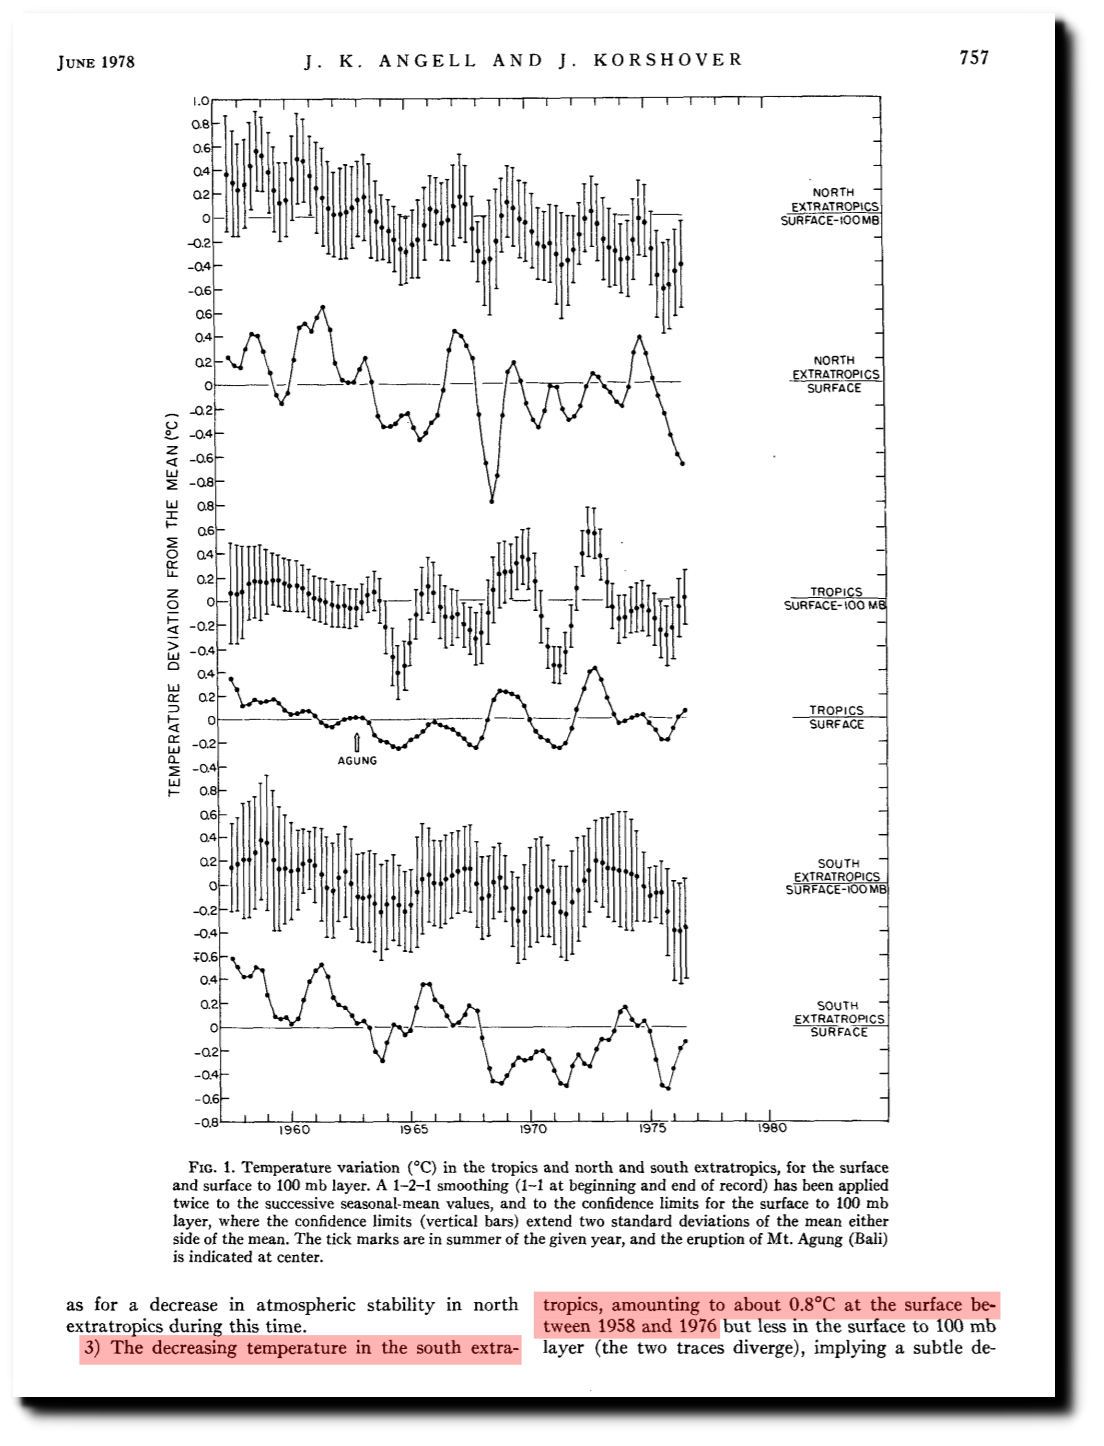
This is in direct contradiction to what NOAA said in 1978, when they showed peak surface cooling in the Southern Hemisphere
1520-0493(1978)106<0755:GTVSMA>2.0.CO;2
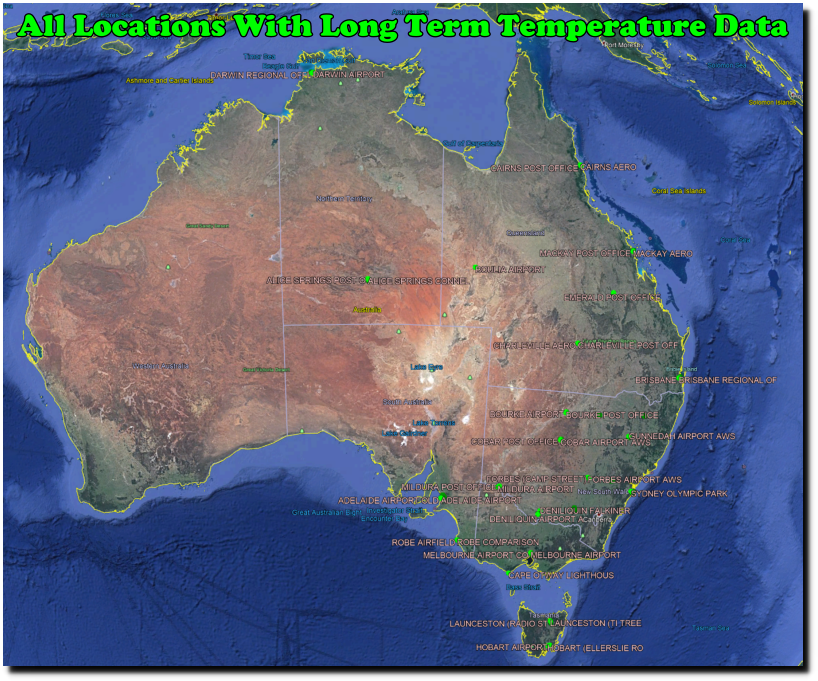
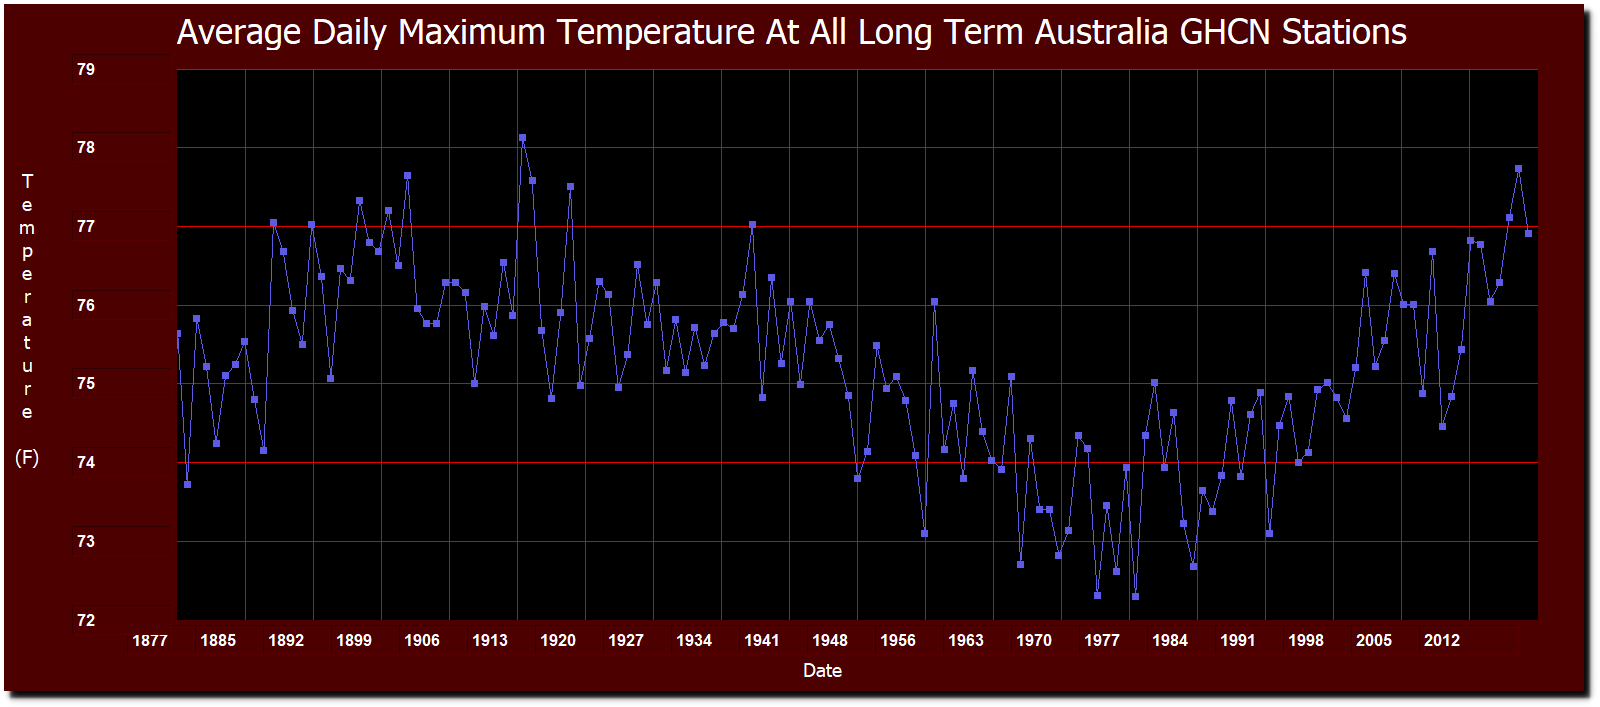
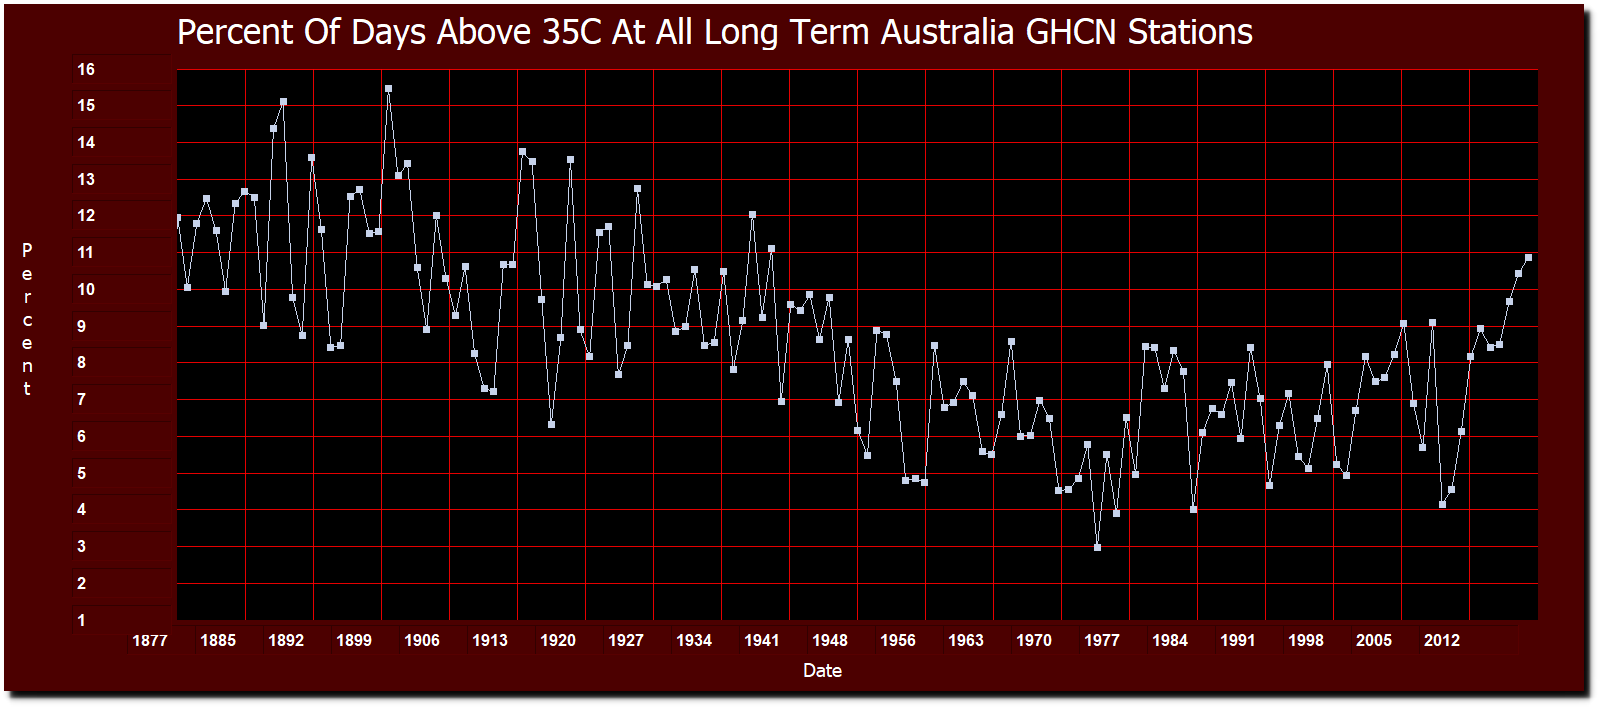
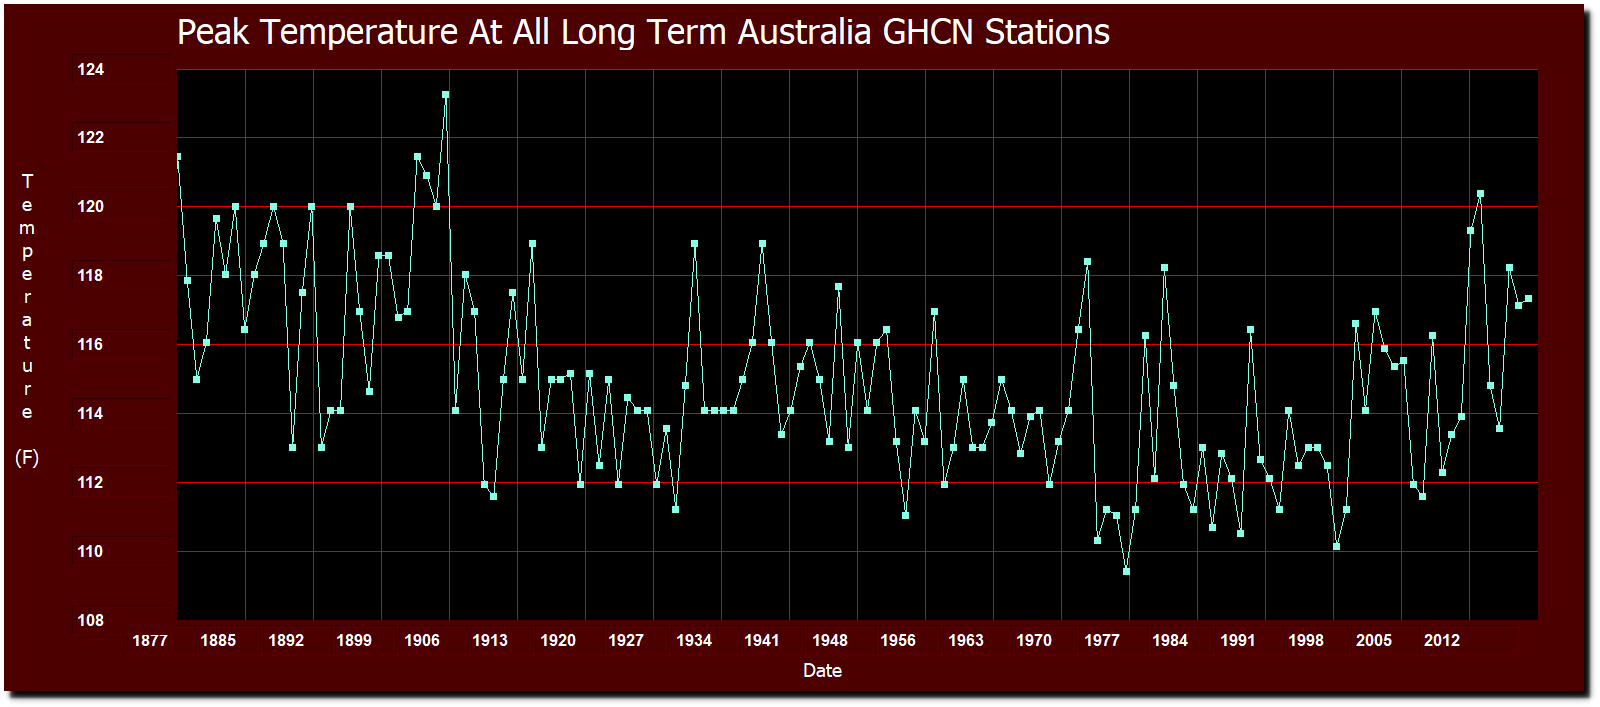
This is easy to test, because there is only one country in the southern hemisphere with coherent long term data. Australia has twenty locations where temperatures have been continuously recorded back to the 1880s.
This group of stations shows that Australian temperatures peaked about a century ago, and reached their minimum during the 1970s. All metrics show the same thing.
Here is the list of stations used in this analysis.
ASN00040842.dly BRISBANE AERO   -27.3917 153.129
ASN00040223.dly BRISBANE AERO   -27.4178 153.114
ASN00040214.dly BRISBANE REGIONAL OFFICE   -27.4778 153.031
ASN00031011.dly CAIRNS AERO   -16.8736 145.746
ASN00031010.dly CAIRNS POST OFFICE   -16.9333 145.783
ASN00090015.dly CAPE OTWAY LIGHTHOUSE   -38.8556 143.513
ASN00044021.dly CHARLEVILLE AERO   -26.4139 146.256
ASN00044221.dly CHARLEVILLE AERO COMPARISON   -26.4147 146.261
ASN00044022.dly CHARLEVILLE POST OFFICE   -26.4025 146.238
ASN00048237.dly COBAR AIRPORT AWS   -31.5389 145.796
ASN00048244.dly COBAR COMPARISON   -31.4861 145.828
ASN00048027.dly COBAR MO   -31.484 145.829
ASN00048030.dly COBAR POST OFFICE   -31.5 145.8
ASN00014015.dly DARWIN AIRPORT   -12.4239 130.893
ASN00014040.dly DARWIN AIRPORT COMPARISON   -12.4227 130.884
ASN00014016.dly DARWIN POST OFFICE   -12.4 130.8
ASN00014161.dly DARWIN REGIONAL OFFICE   -12.4667 130.833
ASN00074128.dly DENILIQUIN (WILKINSON ST)   -35.5269 144.952
ASN00074210.dly DENILIQUIN AERO   -35.5333 144.967
ASN00074258.dly DENILIQUIN AIRPORT AWS   -35.5575 144.946
ASN00074039.dly DENILIQUIN FALKINER MEMORIAL   -35.3667 145.05
ASN00035264.dly EMERALD AIRPORT   -23.5694 148.176
ASN00035027.dly EMERALD POST OFFICE   -23.5267 148.162
ASN00065016.dly FORBES (CAMP STREET)   -33.3892 148.008
ASN00065103.dly FORBES AIRPORT AWS   -33.3627 147.921
ASN00055202.dly GUNNEDAH AIRPORT AWS   -30.9537 150.249
ASN00055023.dly GUNNEDAH POOL   -30.9841 150.254
ASN00055024.dly GUNNEDAH RESOURCE CENTRE   -31.0261 150.269
ASN00094029.dly HOBART (ELLERSLIE ROAD)   -42.8897 147.328
ASN00094008.dly HOBART AIRPORT   -42.8339 147.503
ASN00056242.dly INVERELL (RAGLAN ST)   -29.7796 151.112
ASN00056017.dly INVERELL COMPARISON   -29.7783 151.111
ASN00056018.dly INVERELL RESEARCH CENTRE   -29.7752 151.082
ASN00091218.dly LAUNCESTON (ELPHIN)   -41.45 147.167
ASN00091123.dly LAUNCESTON (MOUNT PLEASANT)   -41.4667 147.15
ASN00091049.dly LAUNCESTON (PUMPING STATION)   -41.5 147.2
ASN00091179.dly LAUNCESTON (RADIO STATION 7EX)   -41.45 147.15
ASN00091237.dly LAUNCESTON (TI TREE BEND)   -41.4194 147.122
ASN00091311.dly LAUNCESTON AIRPORT   -41.5492 147.214
ASN00091104.dly LAUNCESTON AIRPORT COMPARISON   -41.5397 147.203
ASN00033045.dly MACKAY AERO   -21.1706 149.179
ASN00033297.dly MACKAY COMPARISON   -21.1183 149.215
ASN00033119.dly MACKAY M.O   -21.1172 149.217
ASN00033046.dly MACKAY POST OFFICE   -21.15 149.183
ASN00086282.dly MELBOURNE AIRPORT   -37.6655 144.832
ASN00086384.dly MELBOURNE AIRPORT COMPARISON   -37.675 144.842
ASN00086071.dly MELBOURNE REGIONAL OFFICE   -37.8075 144.97
ASN00076031.dly MILDURA AIRPORT   -34.2358 142.087
ASN00076077.dly MILDURA POST OFFICE   -34.1833 142.2
ASN00026105.dly ROBE AIRFIELD   -37.1776 139.805
ASN00026026.dly ROBE COMPARISON   -37.1628 139.756
ASN00066062.dly SYDNEY (OBSERVATORY HILL)   -33.8607 151.205
ASN00066037.dly SYDNEY AIRPORT AMO   -33.9465 151.173
ASN00066196.dly SYDNEY HARBOUR (WEDDING CAKE W   -33.8414 151.263
ASN00066195.dly SYDNEY OLYMPIC PARK (SYDNEY OL   -33.8521 151.065
ASN00072151.dly WAGGA WAGGA (KOORINGAL)   -35.1333 147.367
ASN00073127.dly WAGGA WAGGA AGRICULTURAL INSTI   -35.0517 147.349
ASN00072150.dly WAGGA WAGGA AMO   -35.1583 147.457
ASN00074114.dly WAGGA WAGGA RESEARCH CENTRE   -35.1311 147.309
ASN00052088.dly WALGETT AIRPORT AWS   -30.0372 148.122
ASN00052026.dly WALGETT COUNCIL DEPOT   -30.0236 148.122
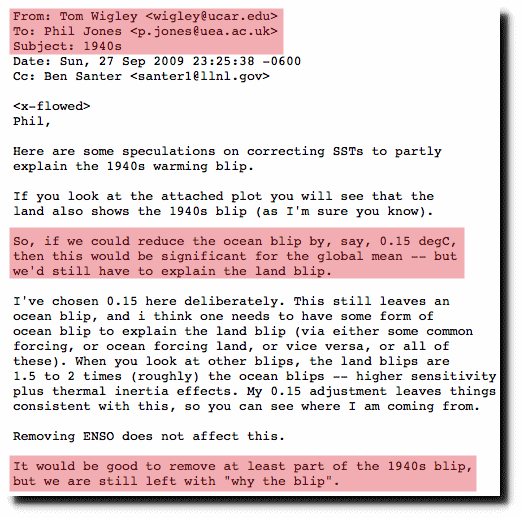
The only plausible explanation for how all the agencies got it wrong, is that they colluded to produce the same graphs – as indicated in this Climategate e-mail
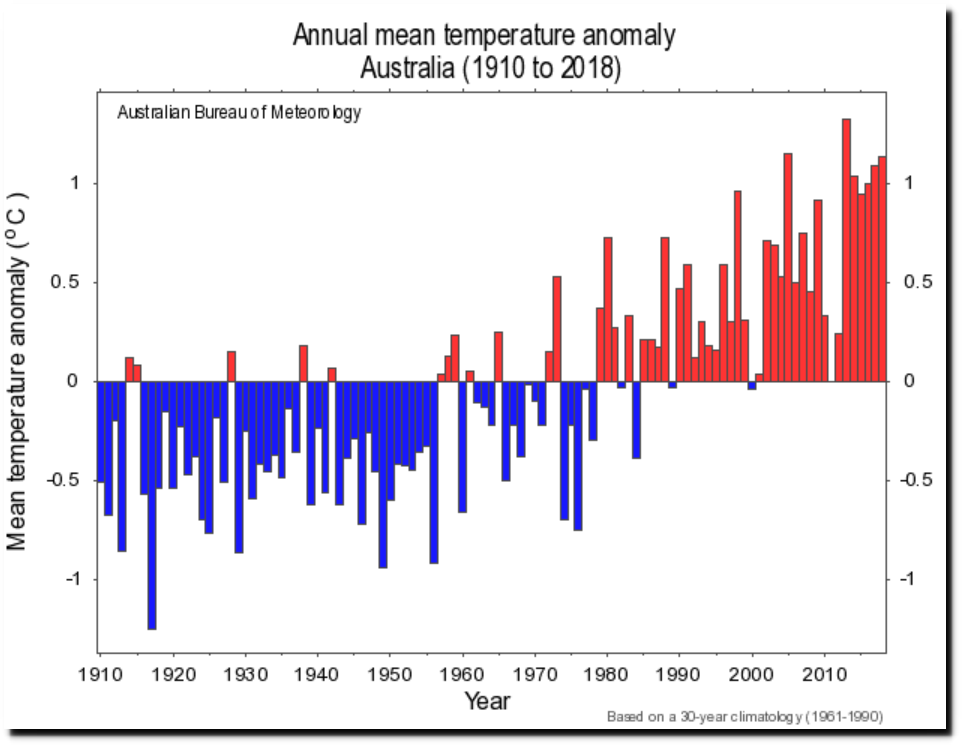
The Australian temperature graph from the Bureau of Meteorology is not only fake, but it hides all of the hot temperatures before 1910. It in no way represents Australia temperatures
Climate change and variability: Tracker: Australian timeseries graphs
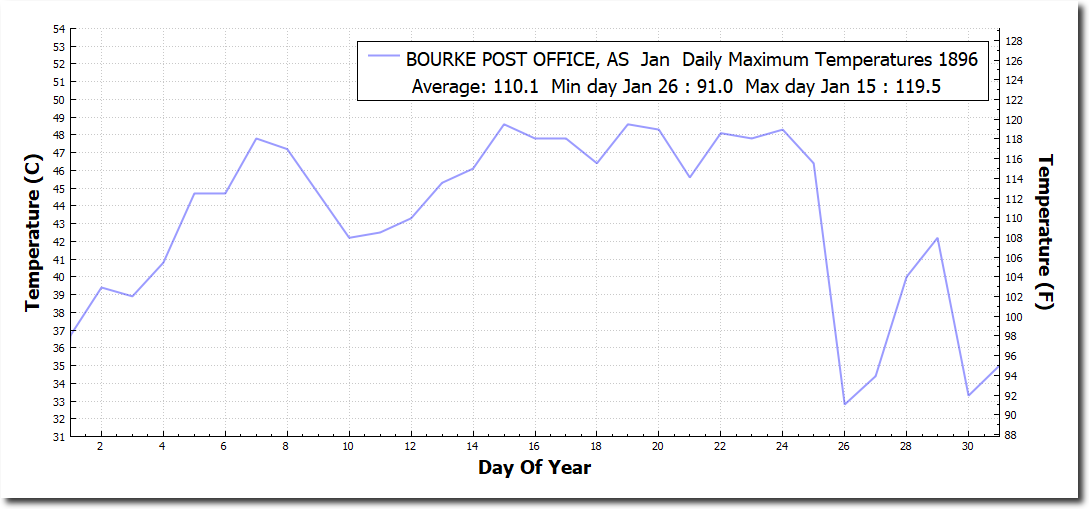
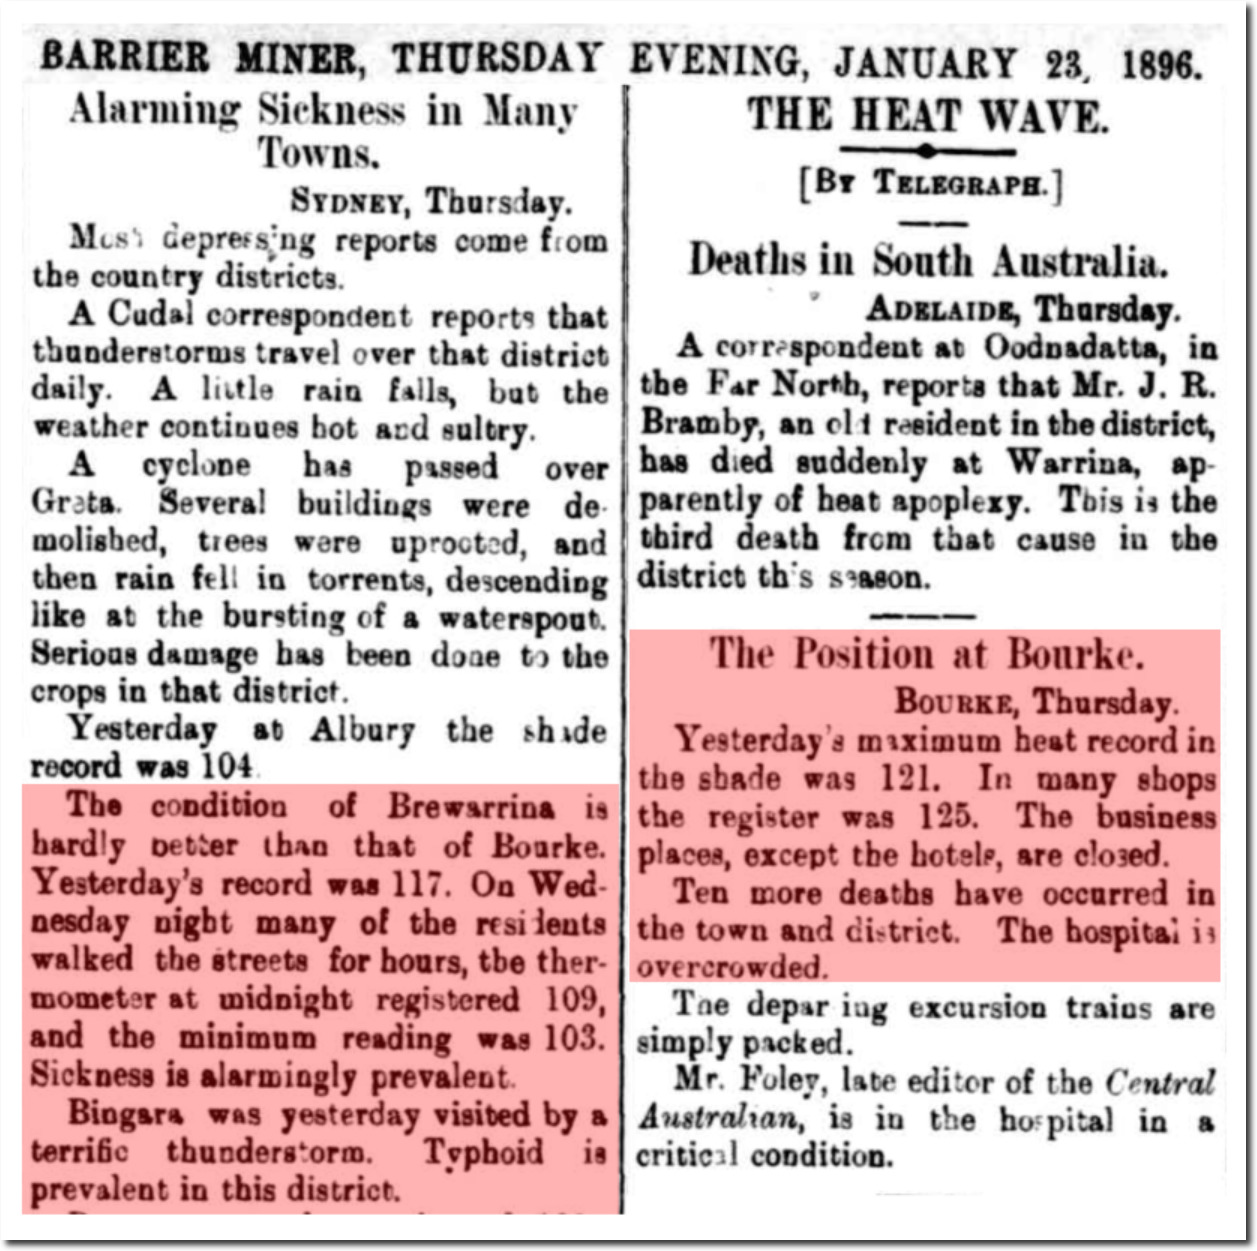
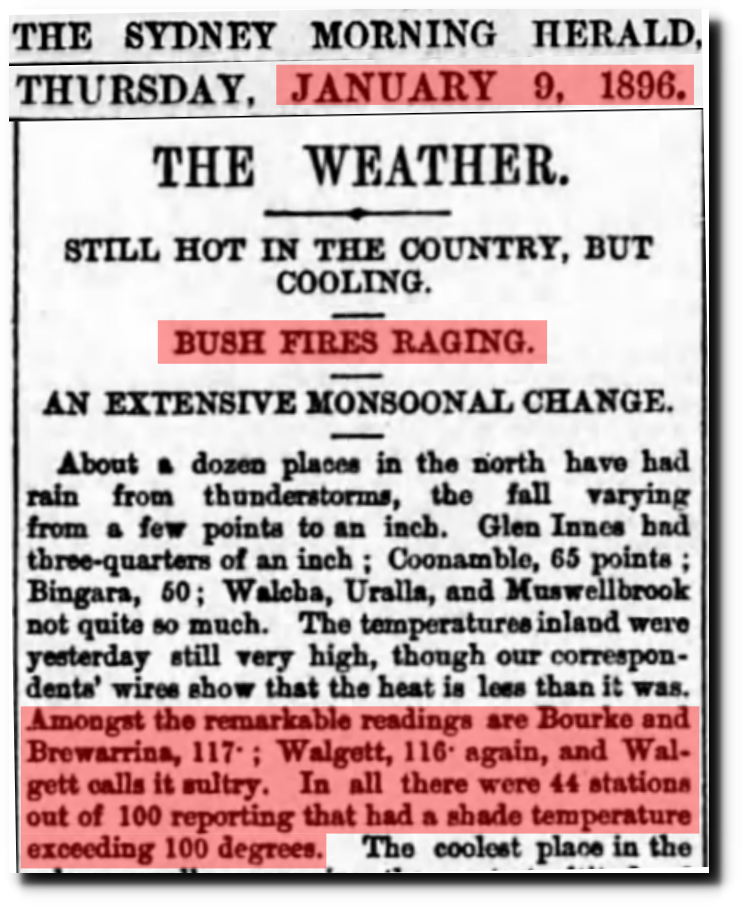
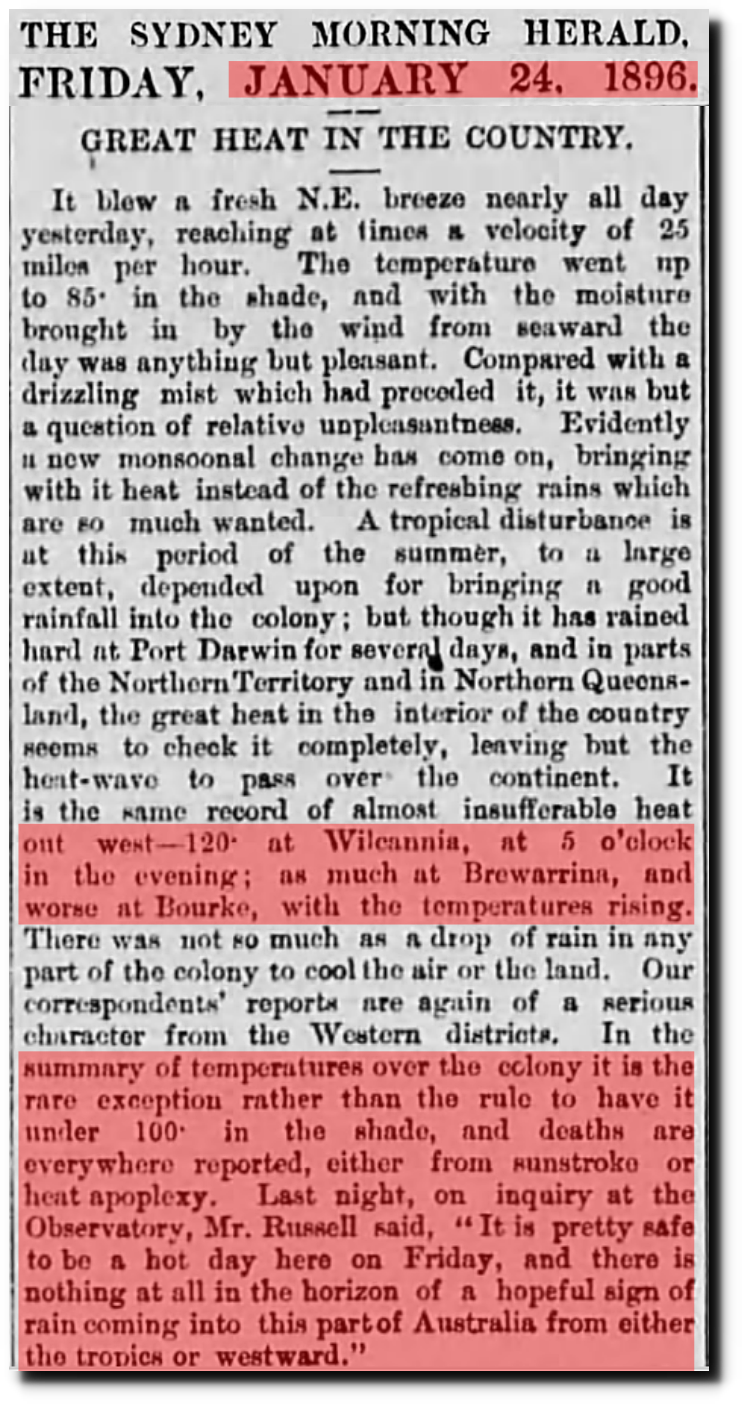
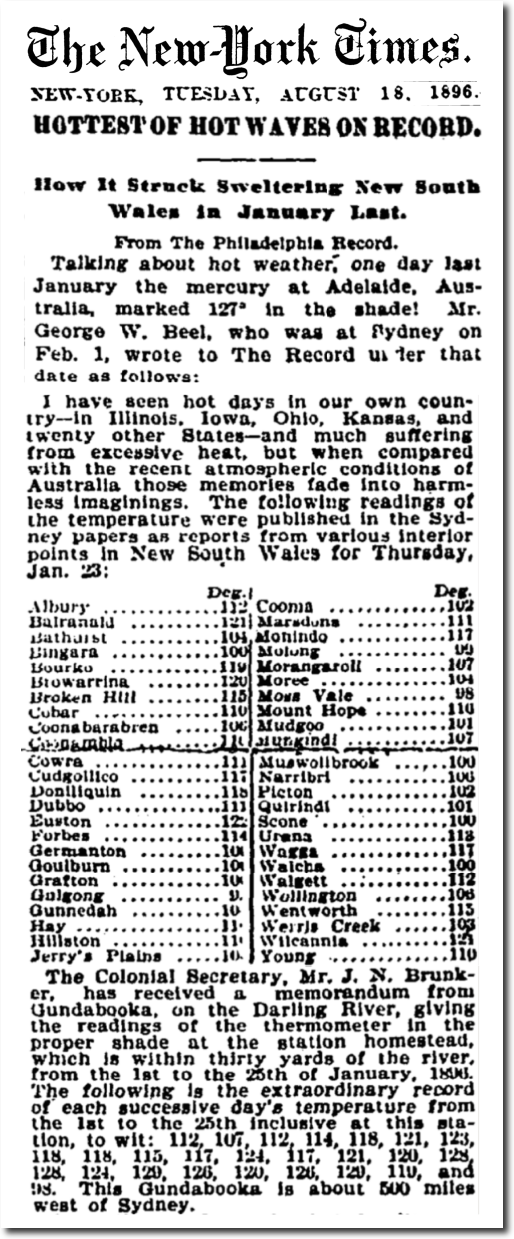
January, 1896 was the hottest month on record in New South Wales, and BOM hides the heat.
23 Jan 1896 – THE HEAT WAVE. – Trove
09 Jan 1896, Page 5 – The Sydney Morning Herald at Newspapers.com
24 Jan 1896, Page 5 – The Sydney Morning Herald at Newspapers.com
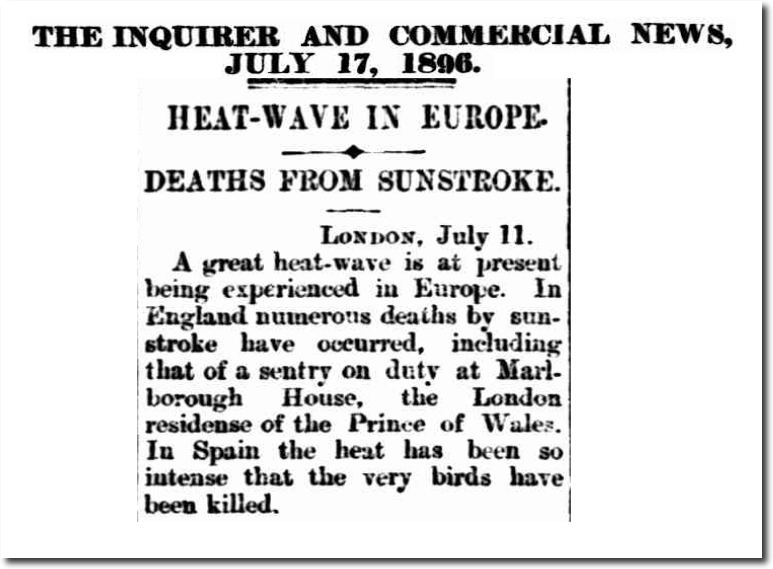
It was also hot in Europe in 1896.
17 Jul 1896 – HEAT-WAVE IN EUROPE.
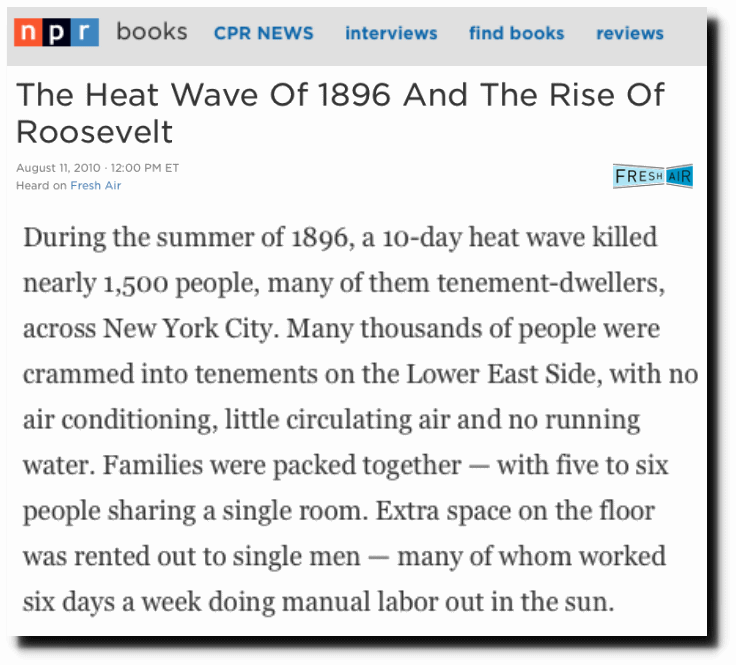
A ten day heatwave during August 1896 killed thousands of people in the US, many of them in New York.
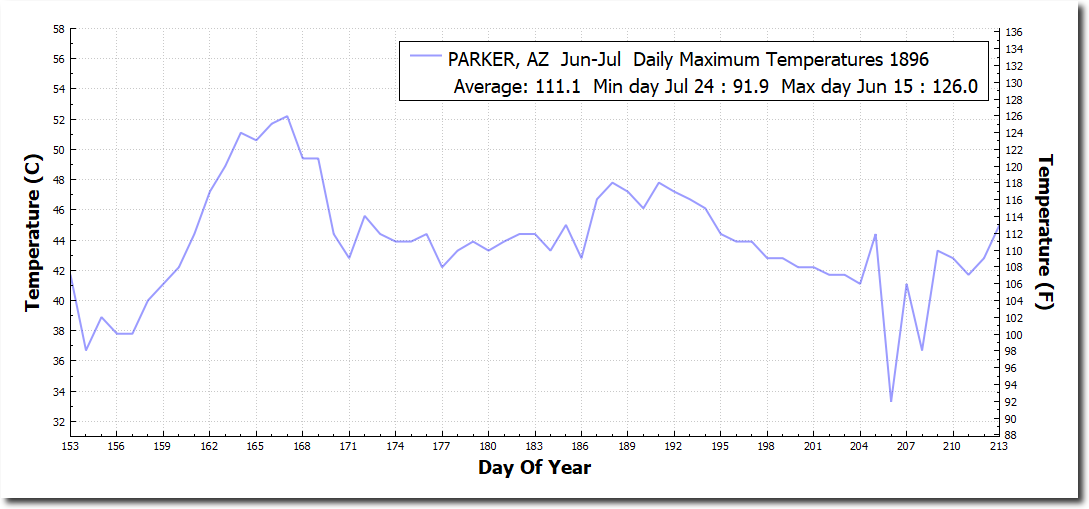
Arizona’s record heatwave over 120F occurred in 1896.
1896 was also a momentous year for climate science, when it started down the path of junk science, superstition and hiding and manipulating data
As early as in 1896, Swedish physicist Arrhenius proposed that the presence of atmospheric greenhouse gases may result in warmer surface temperatures on Earth than a simple radiative balance would imply. A comparison between measured surface temperatures and estimated effective temperatures (assuming the planets behave like black bodies and are at radiational equilibrium) of the planets in our solar system has later revealed that planets with thick atmospheres, such as Venus and Earth, have a warmer surface than a simple radiation equilibrium can explain (Houghton 1991). The high surface temperature can be attributed to the greenhouse effect proposed by Arrhenius
The climate science was an actual science, its participants would want to understand the heat of the past – rather than hide it.

