The animation below shows sea surface temperature anomalies since August 1. Australia (like much of the southern hemisphere) has been surrounded by unusually cold water for months, which is the normal situation which causes drought.
Current Operational SST Anomaly Charts – OSPO
This cold water also just caused Australia’s coldest summer temperature on record.
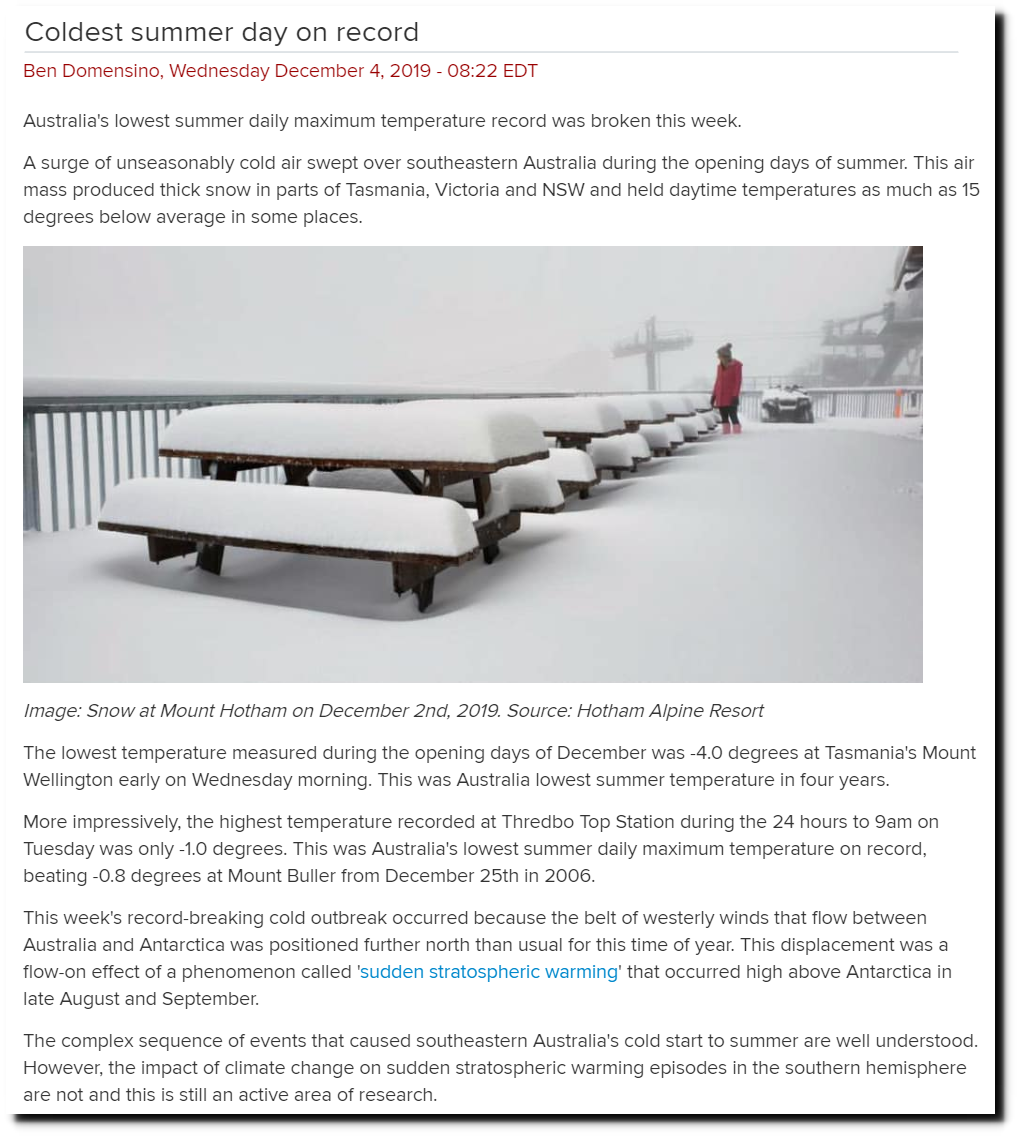
Weather News – Coldest summer day on record
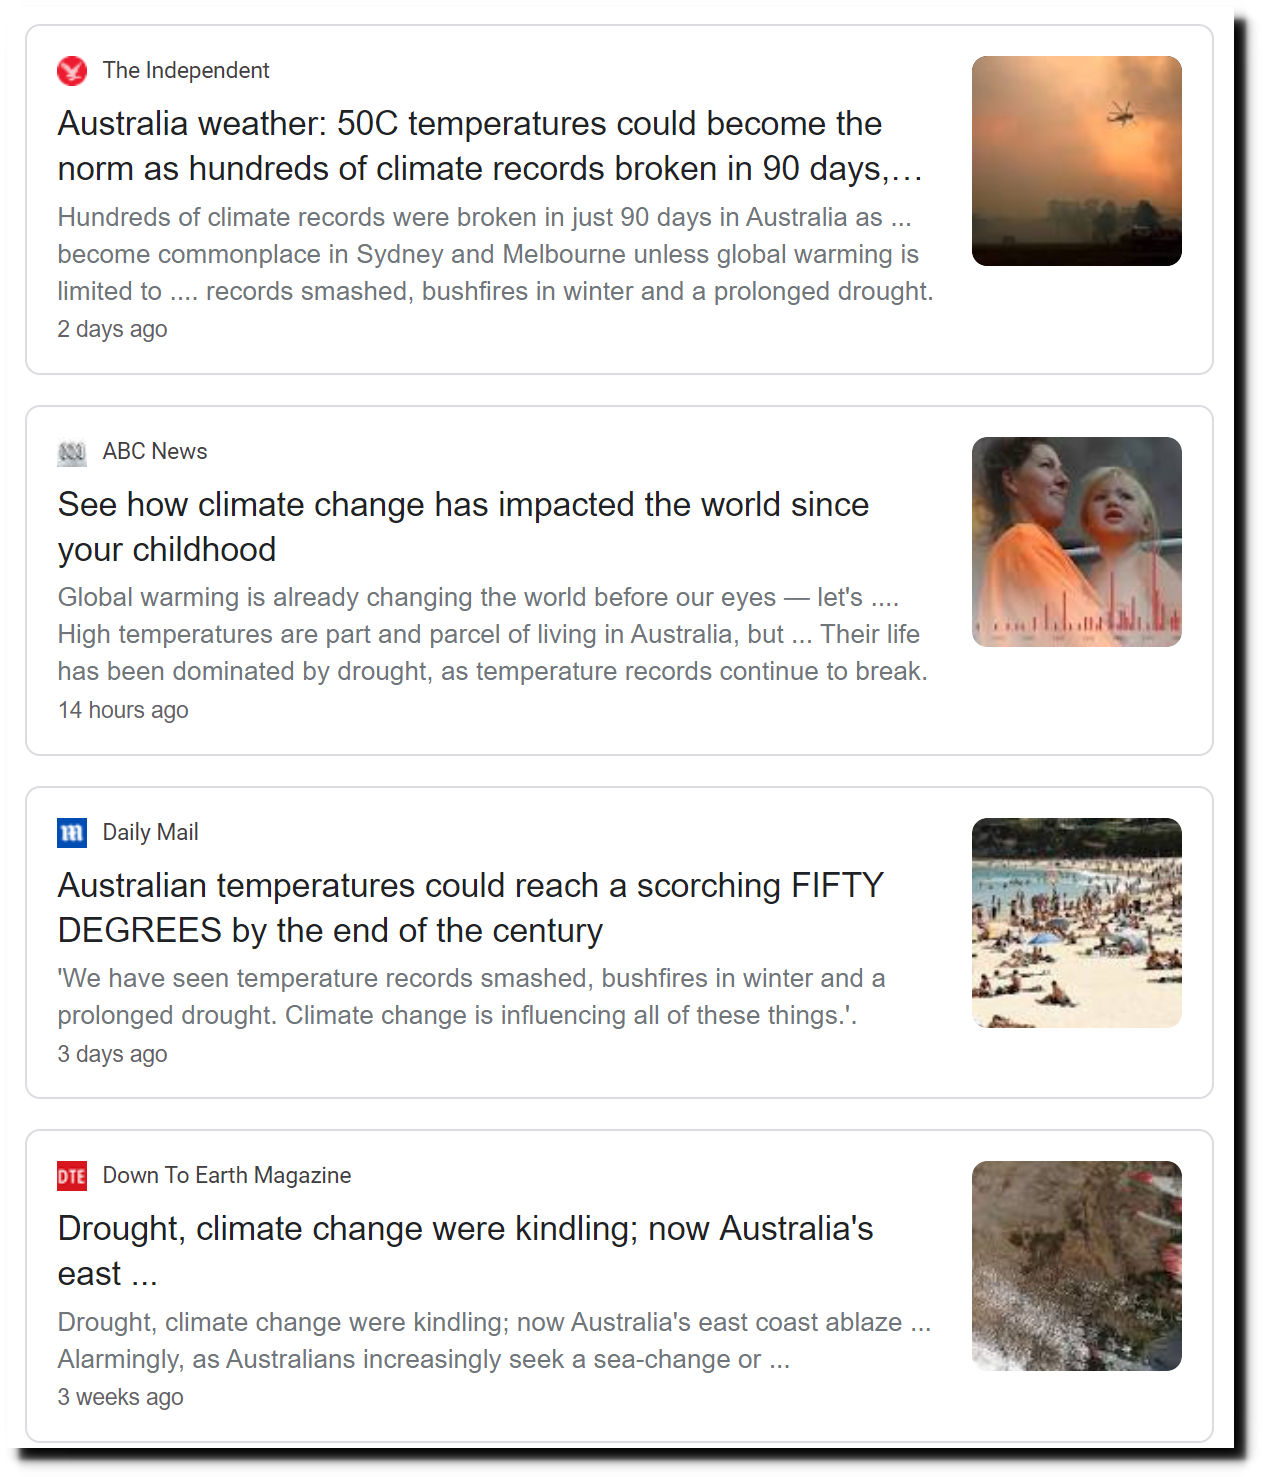
The press is (as always) taking advantage of the drought to spread misinformation.
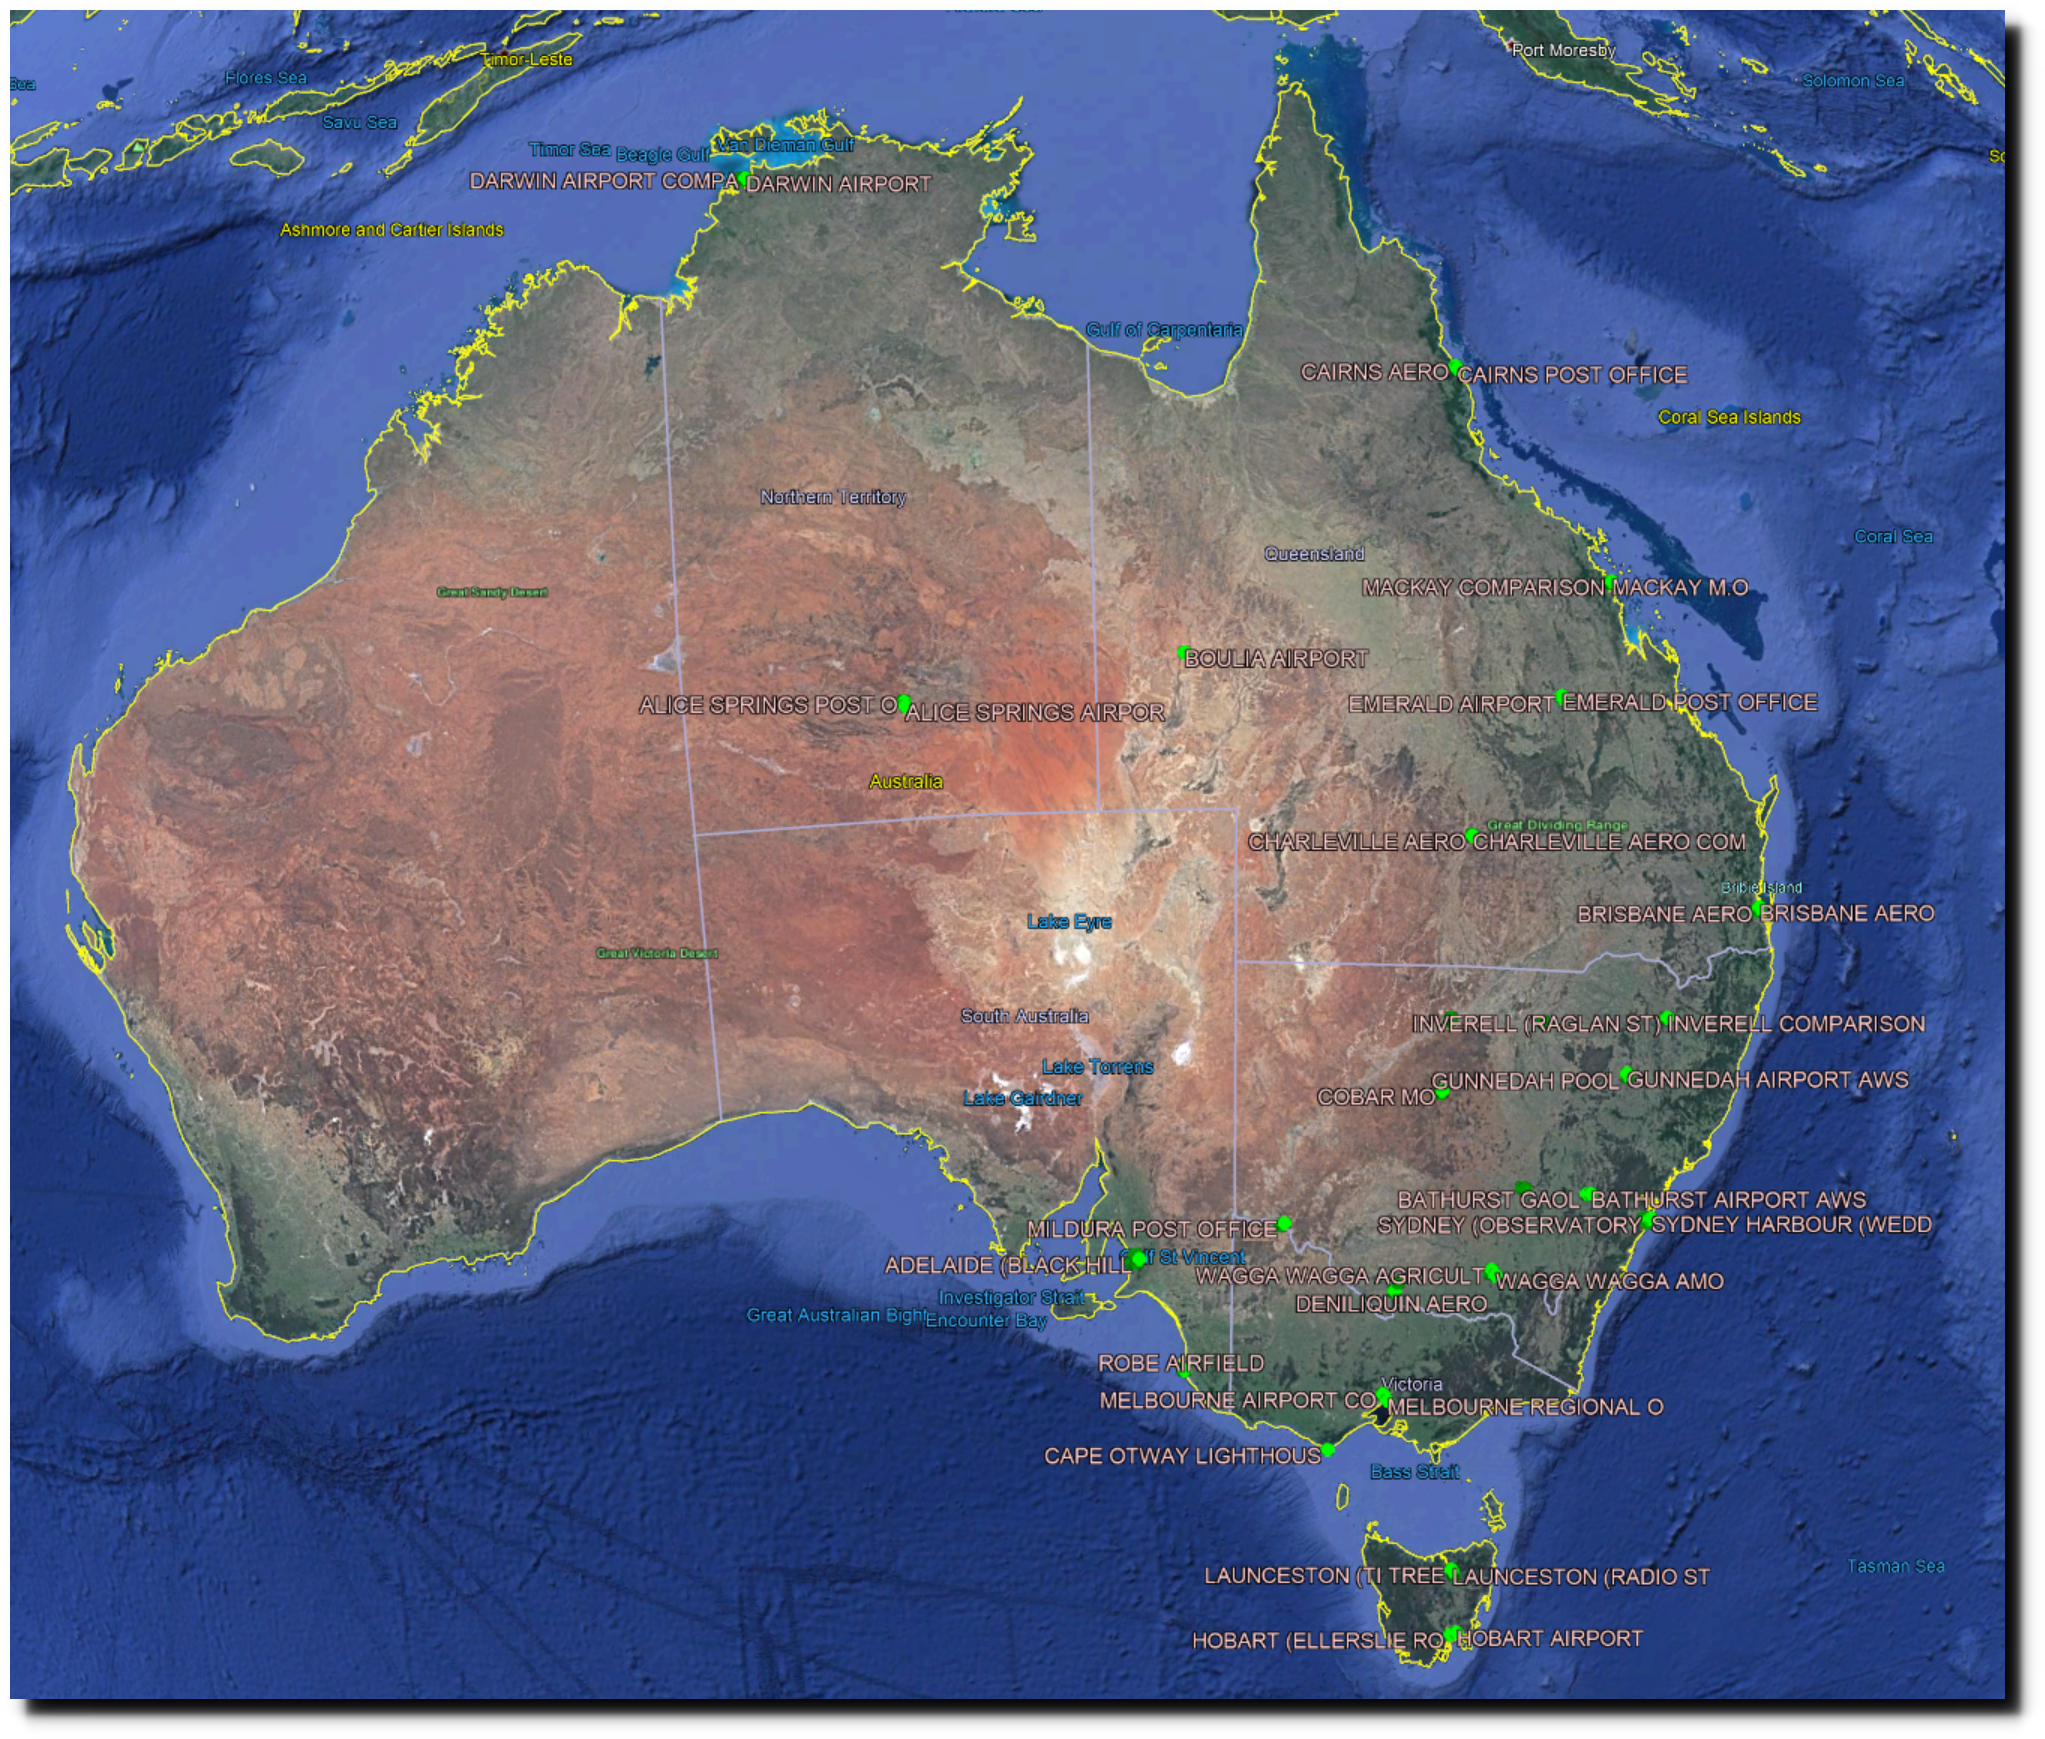
The eastern half of Australia has a fair number of locations with coherent long-term data.
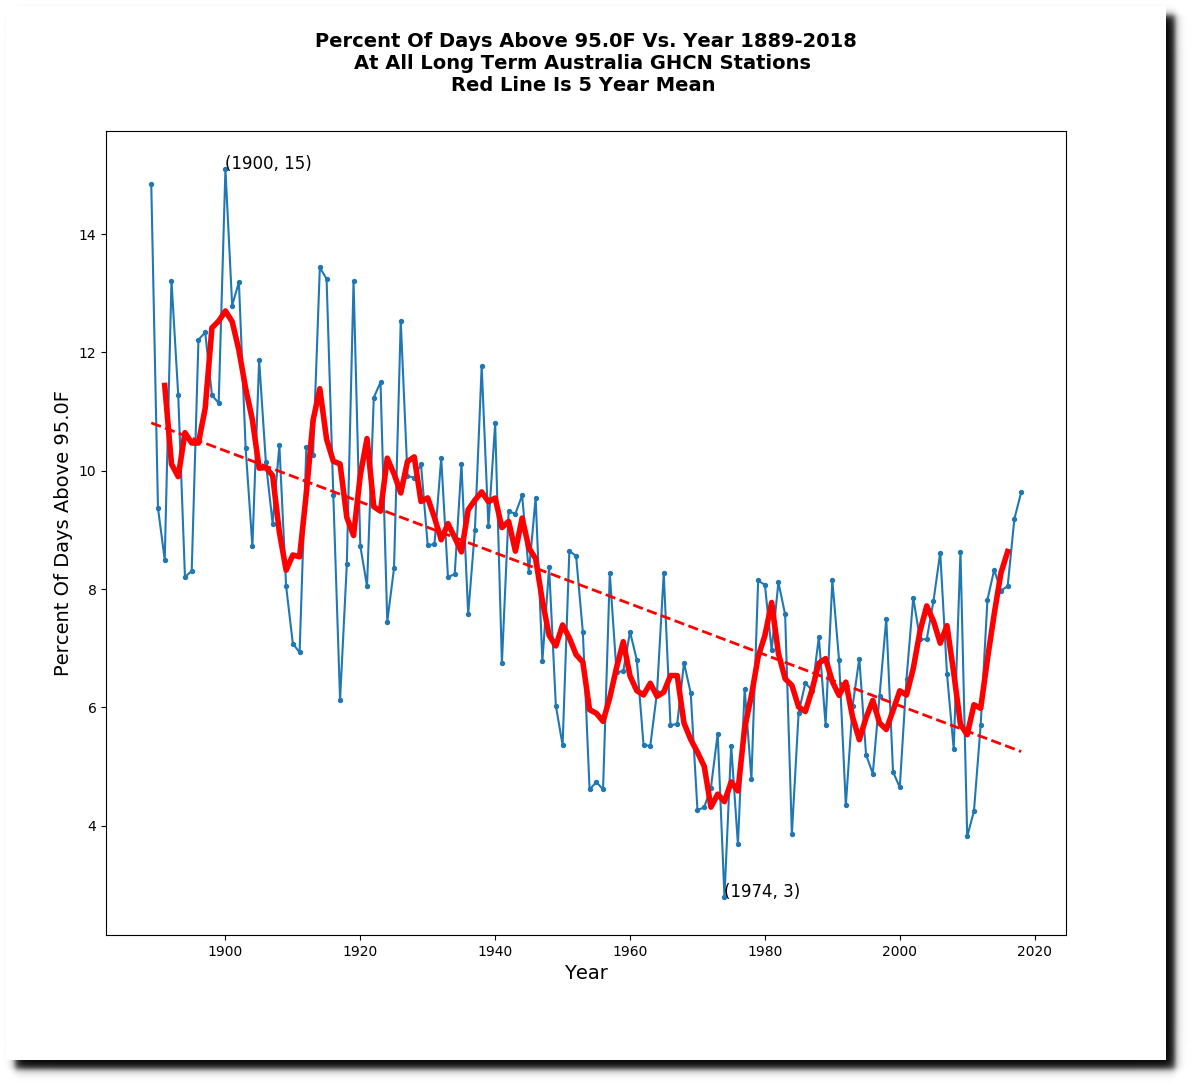
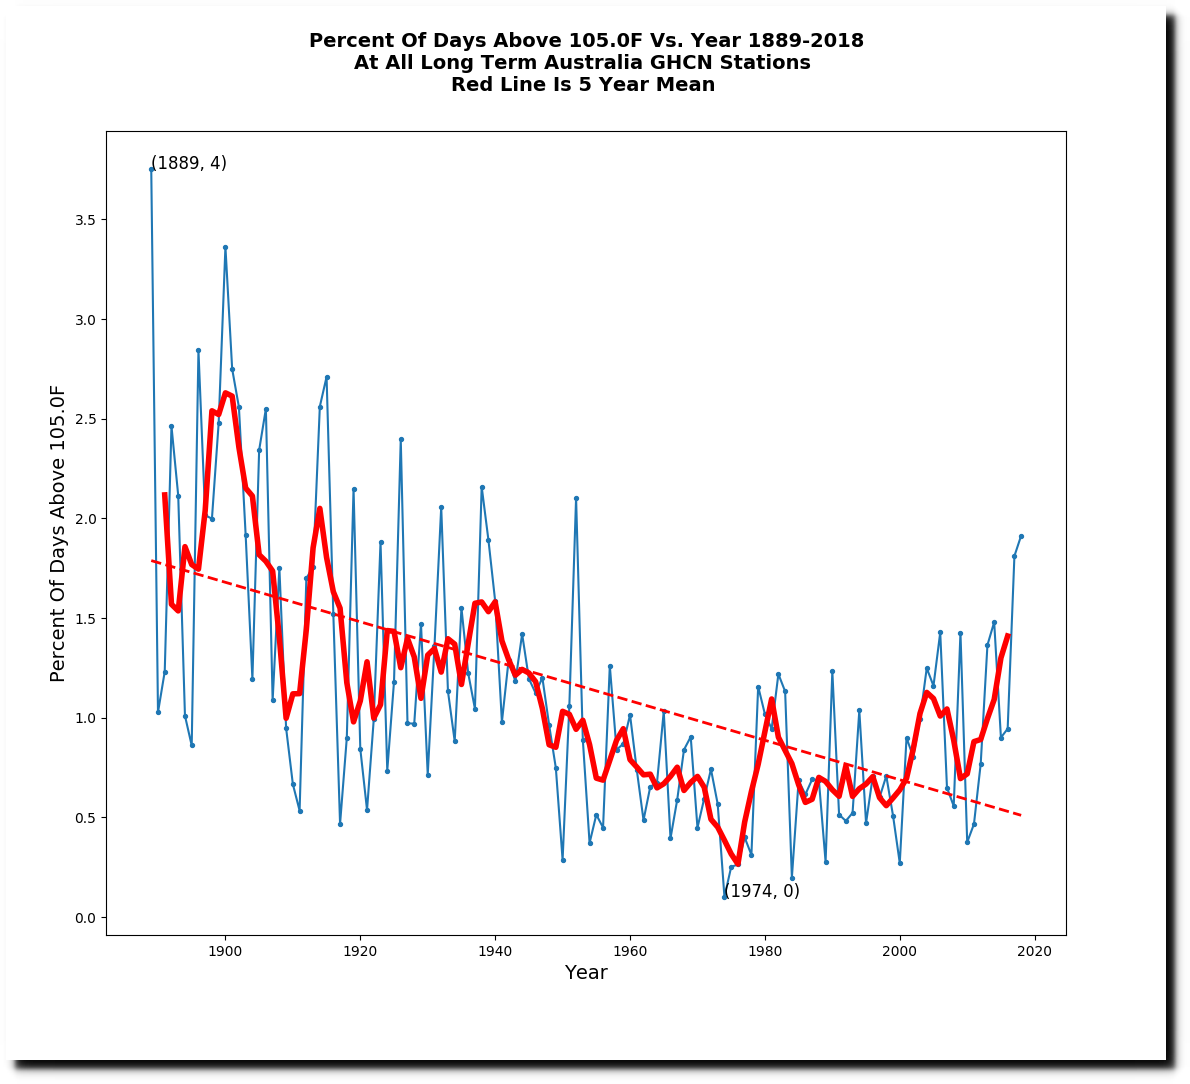
The frequency of hot days has plummeted in Australia.
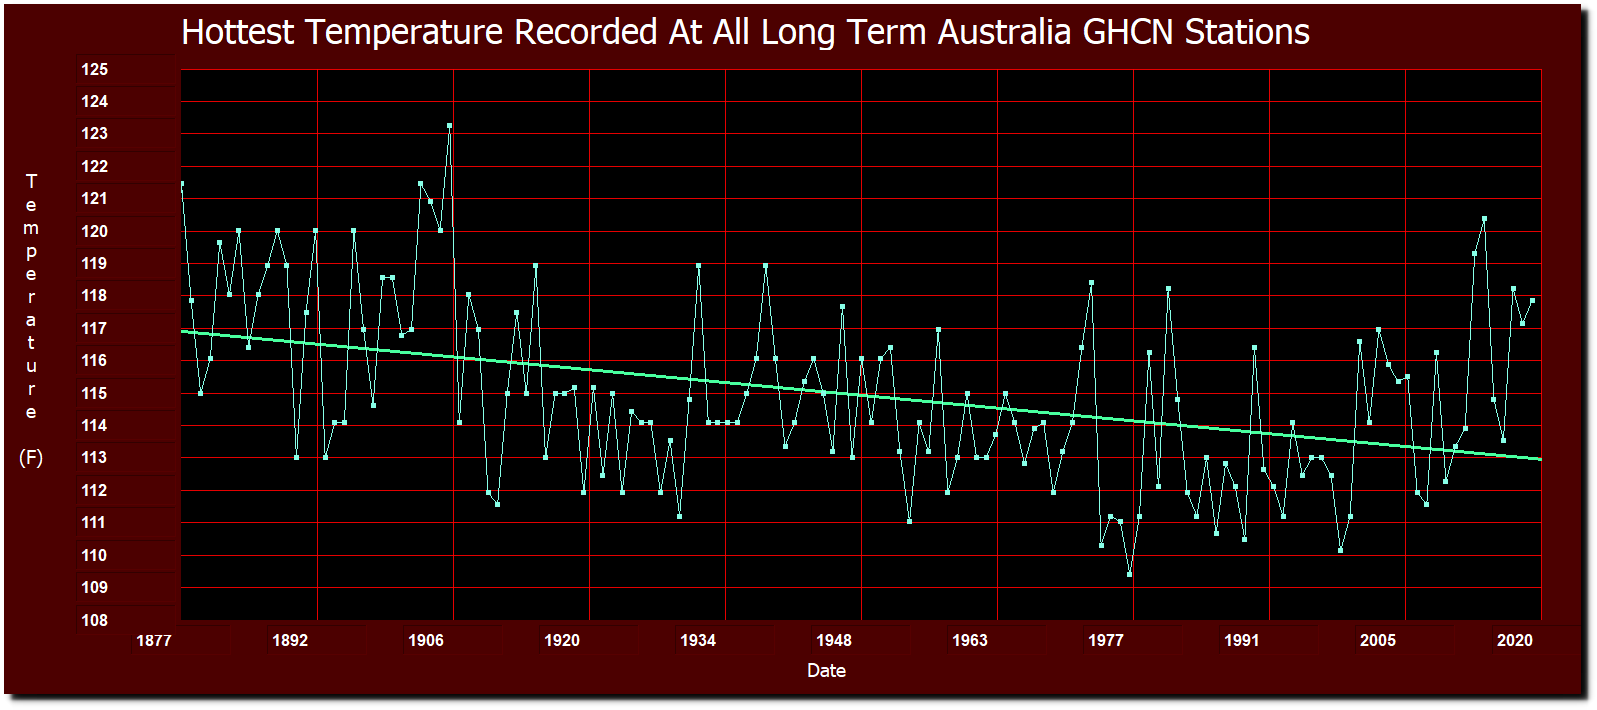
Peak temperatures have also declined.
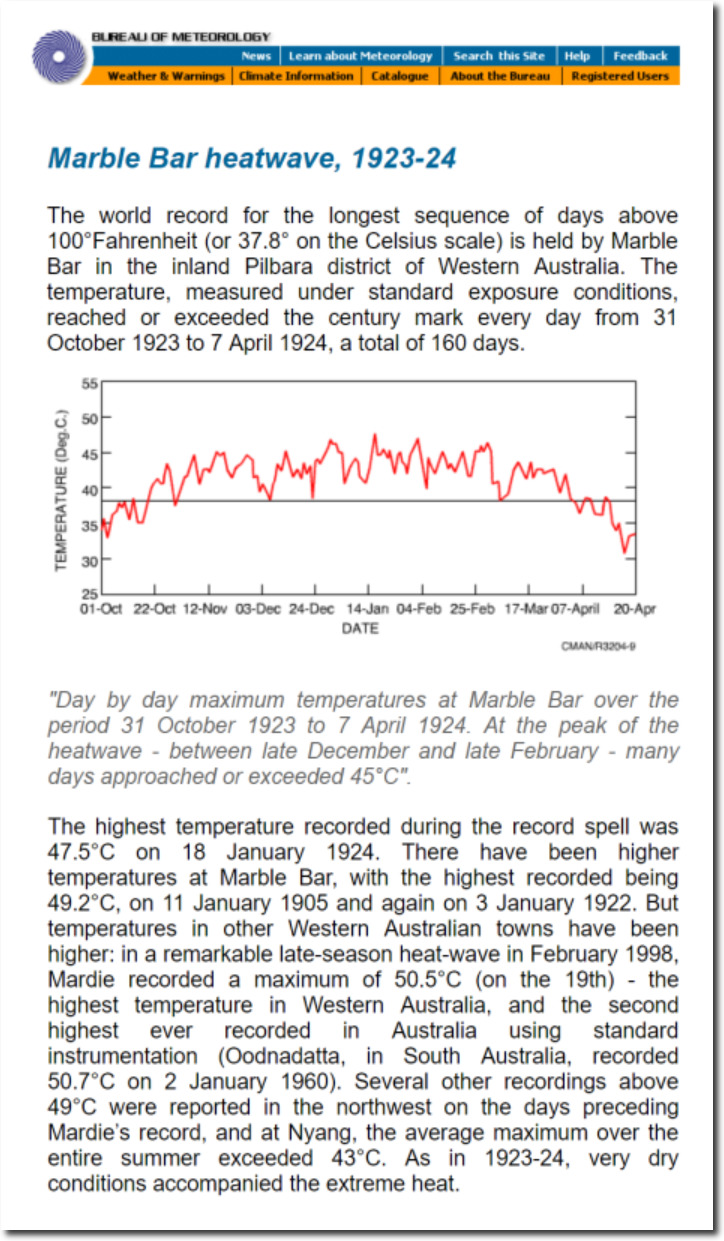
The longest heatwave in the Australian GHCN record was at Boulia in 1889.
The world’s record heatwave occurred in western Australia during 1923-1924.
BOM – Australian Climate Extremes
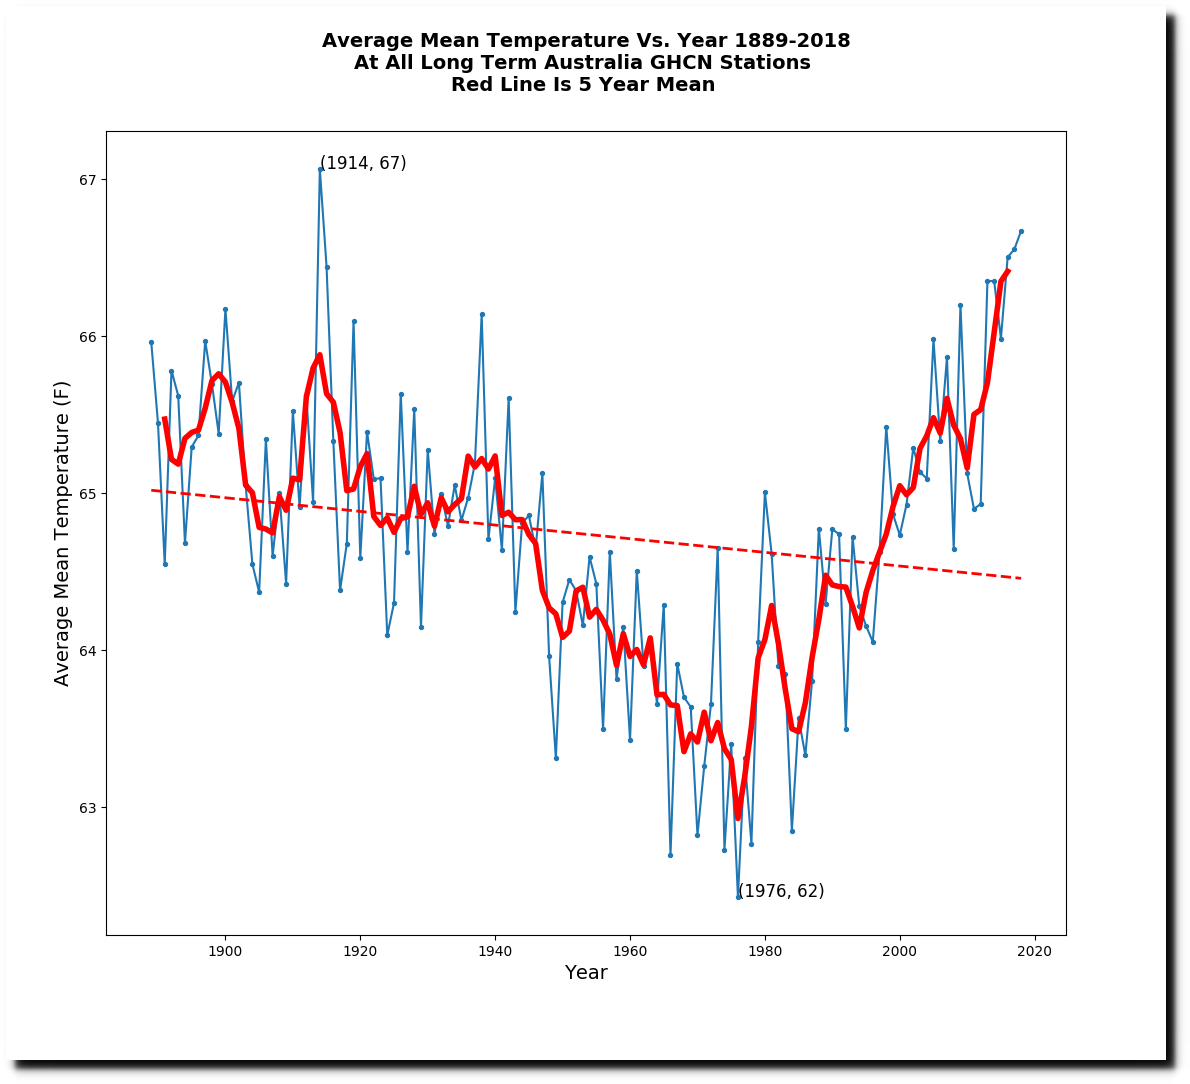
Average afternoon temperatures declined sharply from the 19th century, and bottomed out during the global cooling scare of the 1970s. Since then, they have risen back to 19th century levels.
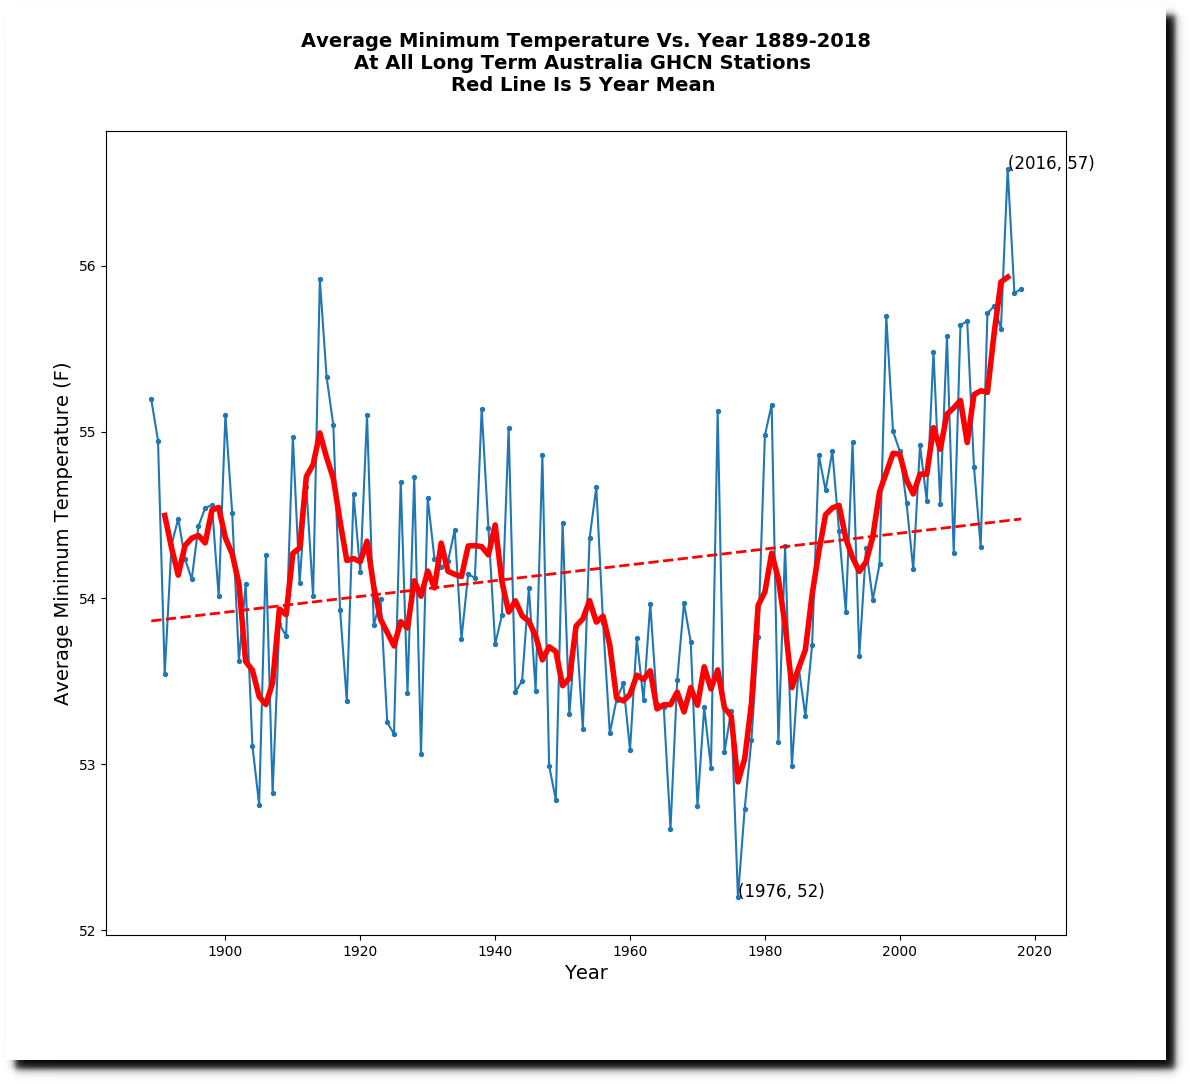
Minimum and mean temperatures have risen sharply, likely due to urban heat island effects.
The climate of Australia has always been alternating droughts and floods.
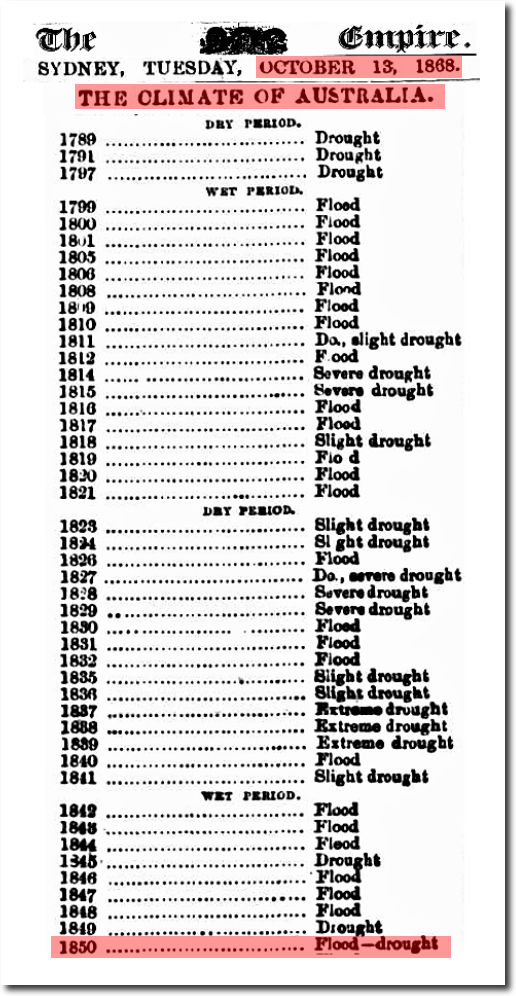
13 Oct 1868 – THE CLIMATE OF AUSTRALIA
Australia’s worst bush fores occurred in 1851.
BLACK THURSDAY.
PROBABLY one of the most terrible days of which there is any record in Australian annals was Thursday, the 6th of February, 1851, commonly known as Black Thursday. But a small proportion of our present colonists have any recollection of that day, as our total population then only amounted to about 70,000 souls, against the 350,000 of to-day. But such of their number as have access to files of the newspaper published at the time, would do well to turn them over, and, as a warning for the future, glance at the narrative of the disasters of that dreadful day.
We find it recorded that as early as seven or eight o’clock in the morning, the thermometer stood at 117° in the shade. At mid-day it sank to 109°, but in the afternoon it rose again, and at four o’clock was 113°. Monday last was about the hottest day of the present season ; yet the thermometer did not stand above 95° in the shade. Our readers who felt inconvenienced by the increase of heat between that and the usual 70° or 75° will have some difficulty in imagining the sensations produced by a still further rise of 20°. The intense heat of Black Thursday was not it’s only peculiarity. From early morning it was accompanied by a hot wind, almost of the strength of a hurricane, and throughout the day the surface of the country was exposed to the full power of it’s withering influence. Bush-fires raged across hundreds of miles of country, sweeping along with almost the rapidity of lightning, and destroying, nearly instantaneously, men, women, and children, crops and homesteads, fences and gardens, and vast quantities of cattle, sheep, horses, pigs, and fowls. From the whole land arose a cry of utter desolation.
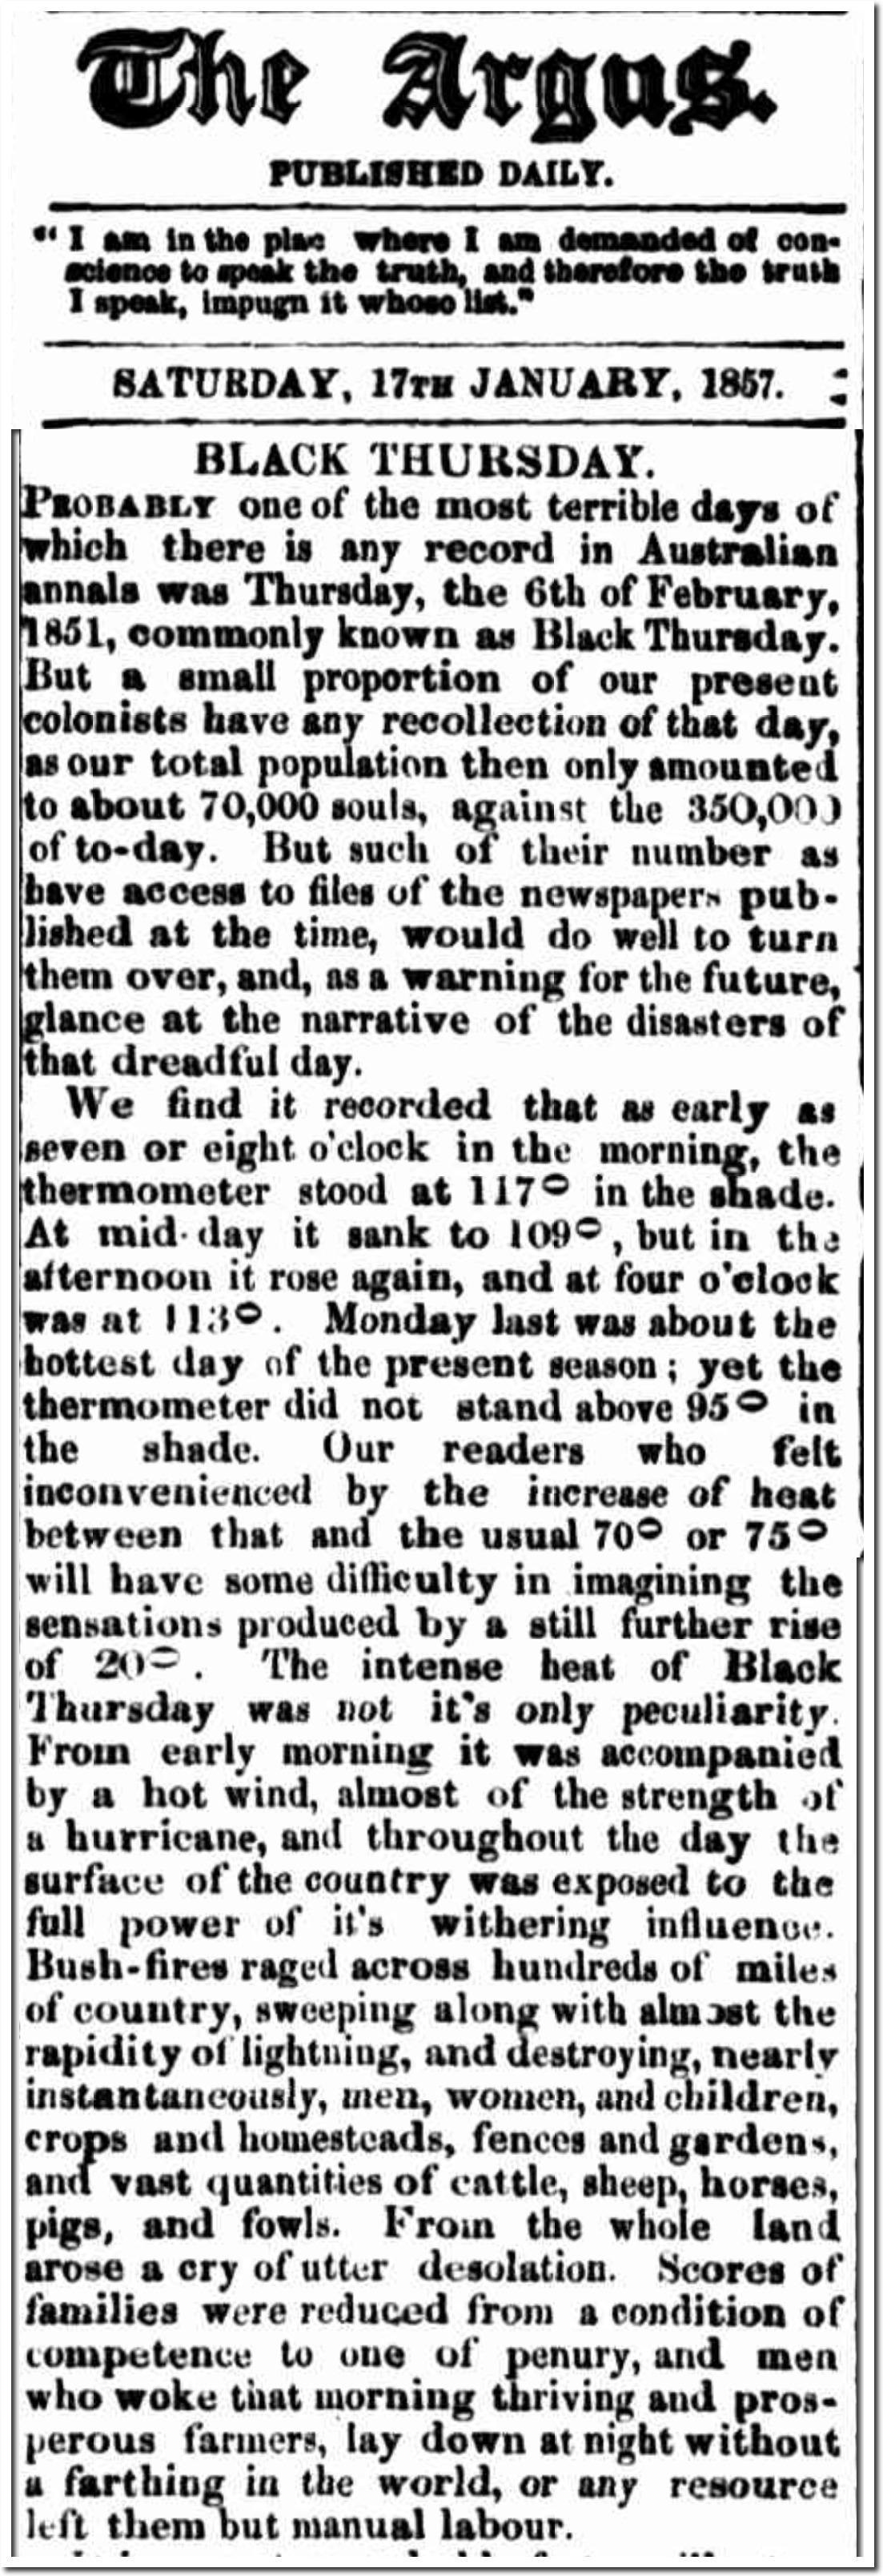
17 Jan 1857 – BLACK THURSDAY. – Trove
Superstitious people always imagined that the climate is changing.
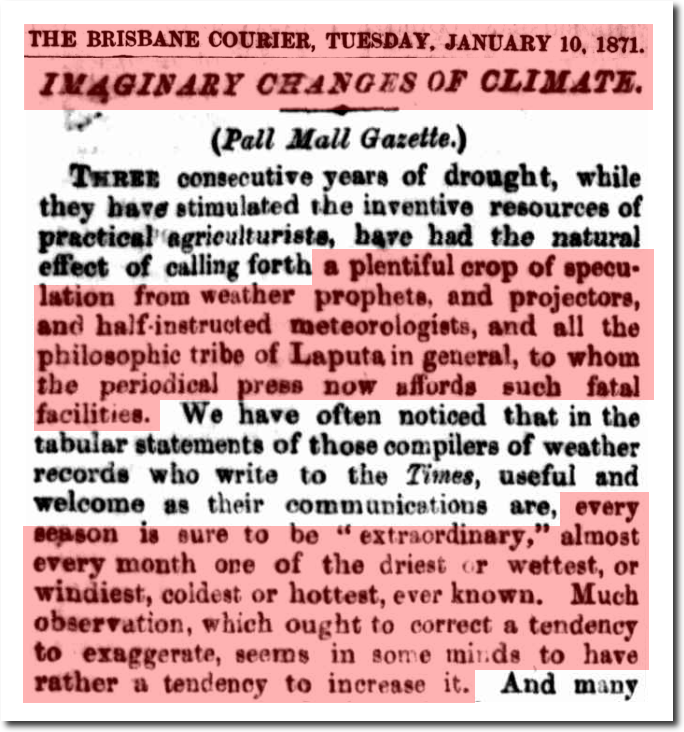
10 Jan 1871 – IMAGINARY CHANGES OF CLIMATE
And blame for climate change has always been placed on white men.
Quite a change since 1974. I’m sure they will be showing charts that begin at that time.
1846 – “…since White Man came into the Country”. All-time classic line…
When will the alarmists show your plots, but truncated with start dates of 1974, to prove their claims?
Sitting in Paraná, Brazil, even with Paraguay and the same South Latitude as Brownsville is North, it is a broiling 72ºF summer day, just like every other. There is noticeable warming in January, and palpable coolness in July, but that’s it–just a few degrees either side of 61º is all we get at the same latitude that cuts across Australia. If this comes from being where 8/9 of humanity does not live, then climate Cassandras ought to look more closely at population growth than trace amounts of CO2 .
Here in Australia almost everybody is going nuts over the fires and smoke. Well everyone who doesn’t know how to use Trove. Wondering if your data there is RAW or ACORN-SAT2 – very different datasets. Here is Australia it does look like 2 trend lines – down from 1900 (Federation Drought era) – 1970’s (Ice Age Cometh) – then back up to the present IOD/SAM/ENSO driven drought.
Ken, can you expand on that please? I’ve located ACORN-SAT-2. Not too hard, with a nice unique name, but RAW is ubiquitous rather than unique.
I also found https://kenskingdom.wordpress.com/2019/02/14/acorn-sat-2-0-western-australia-a-state-of-confusion/ which reckons that the ACORN-SAT-2 data is pretty poor (to put it politely).
Is RAW the “real”, un-adjusted data? If so, do you have an address for it, please?
The Drought Fluctuation in Australia http://www.bom.gov.au/climate/history/rainfall/
It beggars belief that the alarmists can claim that ‘it’s the worst evahhhh!’ when the data is freely available. I was debating with an alarmist last week who cited a study that ‘proved ‘that it’s the worst ever….yet only went back sixteen years. Argument over….f#*+ off!!
When will these moron understand the worst ever is not knowable, worst since we keep record might be, but with the changing of the record data it getting to the point that is not knowable.
Yes, various experts in other fields have pointed to historical, palaeontological, and geological evidence of previous high temperatures, severe droughts, massive and sudden extinction of flora and fauna, yet they are poo pooed because they ‘aren’t climate scientists ‘.
Thanks Tony.
I do use these posts with politicians.
Sussan Ley has still not replied to my last letter and this post is an excellent one to again highlight the Bureau Of Meteorologys leftist agenda.
Most telling for me is the rise in the minimum and means, as you say almost certainly UHI effects are driving these. Wonder what the graphs would look like if only rural stations were included? Are you able to do that?
Of course Ken at https://kenskingdom.wordpress.com/ , in his unofficial survey of BOM sites is finding that over 40%, yes 40%, are non compliant. (he is up to almost 300 stations) Talk about manufacturing trends…looks suspiciously like what you pointed out over the false high in Colorado that was reported recently.
Wasn’t this an expected result of the Sudden Stratospheric Warming that occurred recently over Antarctica?
“…since white man came into the country…”- the ‘indidgenous’ Australians neglect to mention that they and climate change thousands of years ago made Australia’s megafauna extinct
The Australian media in general, and the ABC in particular, are so blatantly biased toward the CC cult, they would never dream, of giving even one of your posts the time of day.
We are pounded with two or three, CC doom and gloom articles, daily, which are then repeated by every state and local news outlet.
Anyone who dares to publicly express a contrary opinion, or even questions the “scripture” of CC, is immediately pilloried as a heretic and subjected to a torrent of abuse.
Thankfully, I can get a balanced view from the internet. Keep up the good work.
News Limited in Australia is generally balanced in its views on the climate change and tends to reject the alarmist view but you are correct, most Australian media is so blatantly biased it is hard to believe people cannot see through it
I remember ash falling in Melbourne in 1983 during bush fires, but I don’t recall any mention of a “climate emergency”. (Two years later there were snow flurries in the city, the most recent time I can recall snow in inner Melbourne.) Back then I used to attend church and we were believers of a different kind. I don’t participate in religious activities anymore, many don’t, or maybe think they don’t as Climatism has replaced religion and its activists the priestly caste. I haven’t lived in Australia for 16 years and the zealousness of “climate belief” I see coming from there is totally bizarre; a whole nation successfully brainwashed. I am shocked.