
“There is something fascinating about science. One gets such wholesale returns of conjecture out of such a trifling investment of fact.”
? Mark Twain
Like the US, Australia has a very hot past which is incompatible with climate crisis hysteria. This compels government scientists to find creative ways to make the past heat disappear.

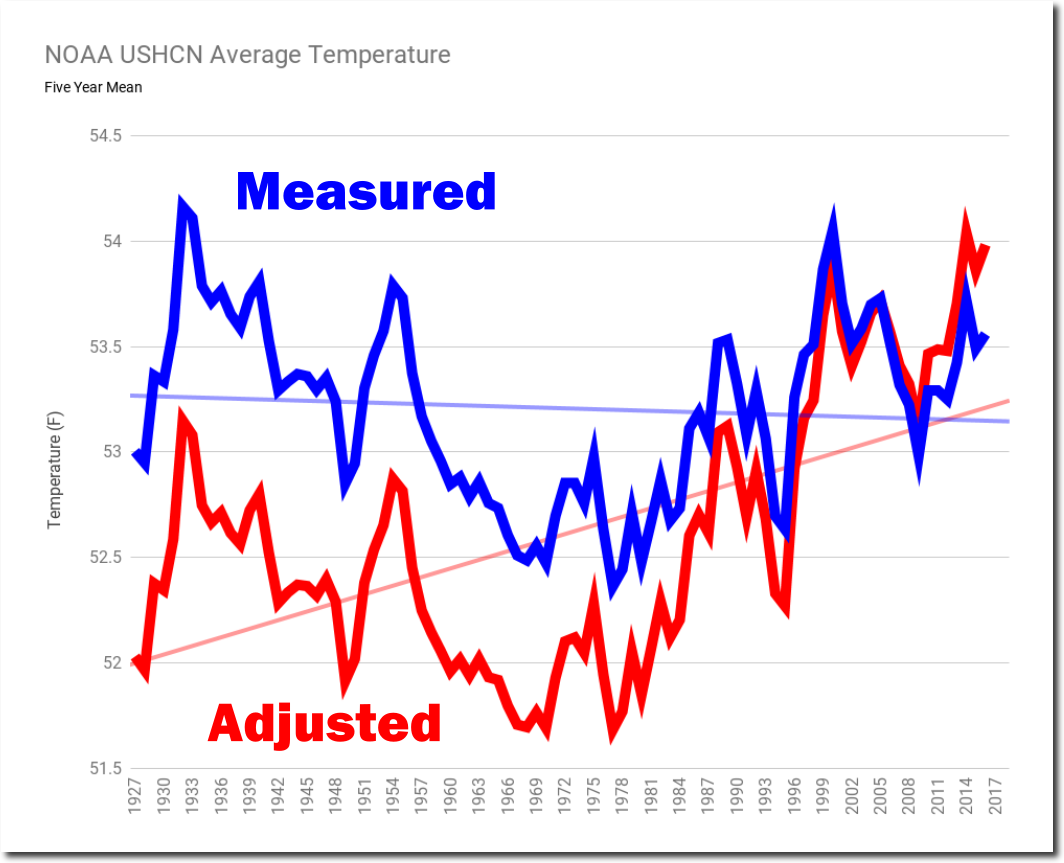
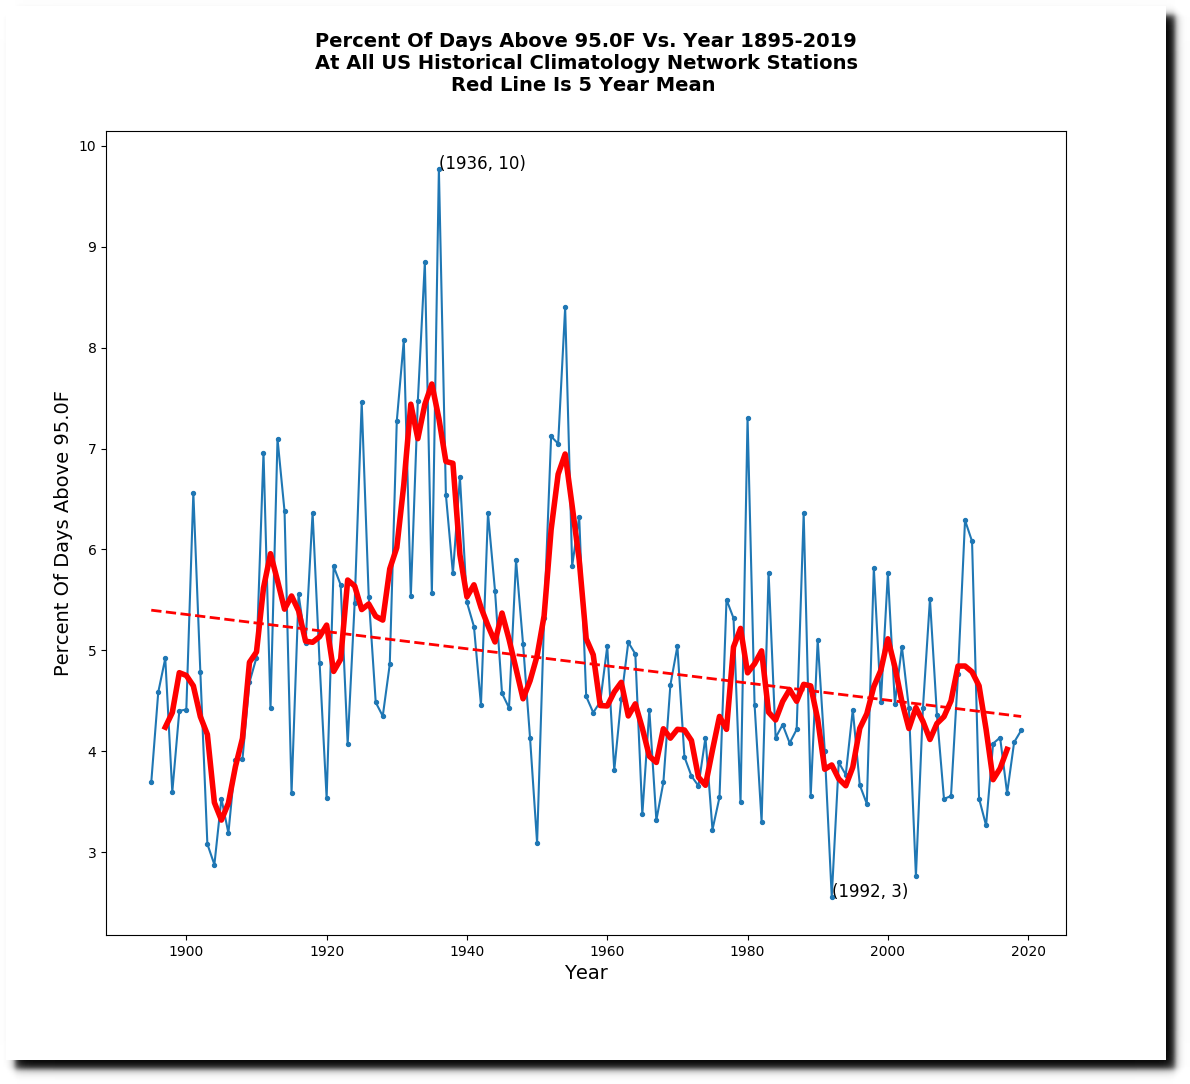
In the US, the primary technique used to hide the hot past is to cool older temperatures, and warm more recent ones.
But in Australia, the primary technique is to hide older temperatures.
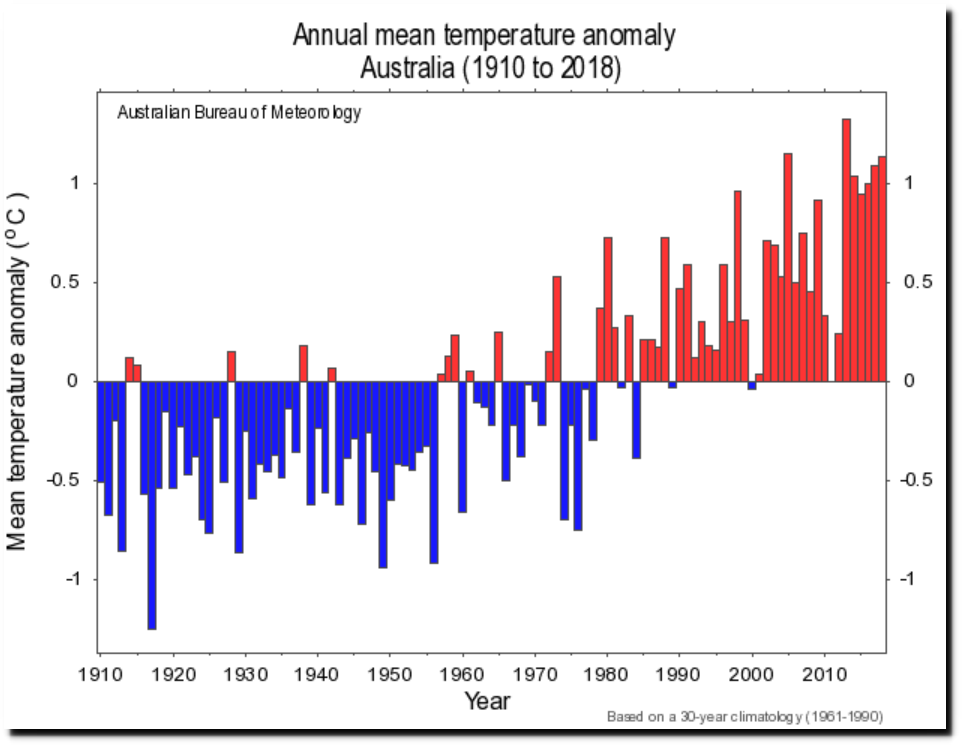
Climate change and variability: Tracker: Australian timeseries graphs
Australian government “scientists say” that observers in the past simply weren’t smart enough to know whether the thermometer they were reading was in the sun or in the shade.
The global standard for temperature measurement includes the use of a Stevenson screen, which is a white louvred box allowing ventilation and ensuring thermometers inside are never exposed to the sun.
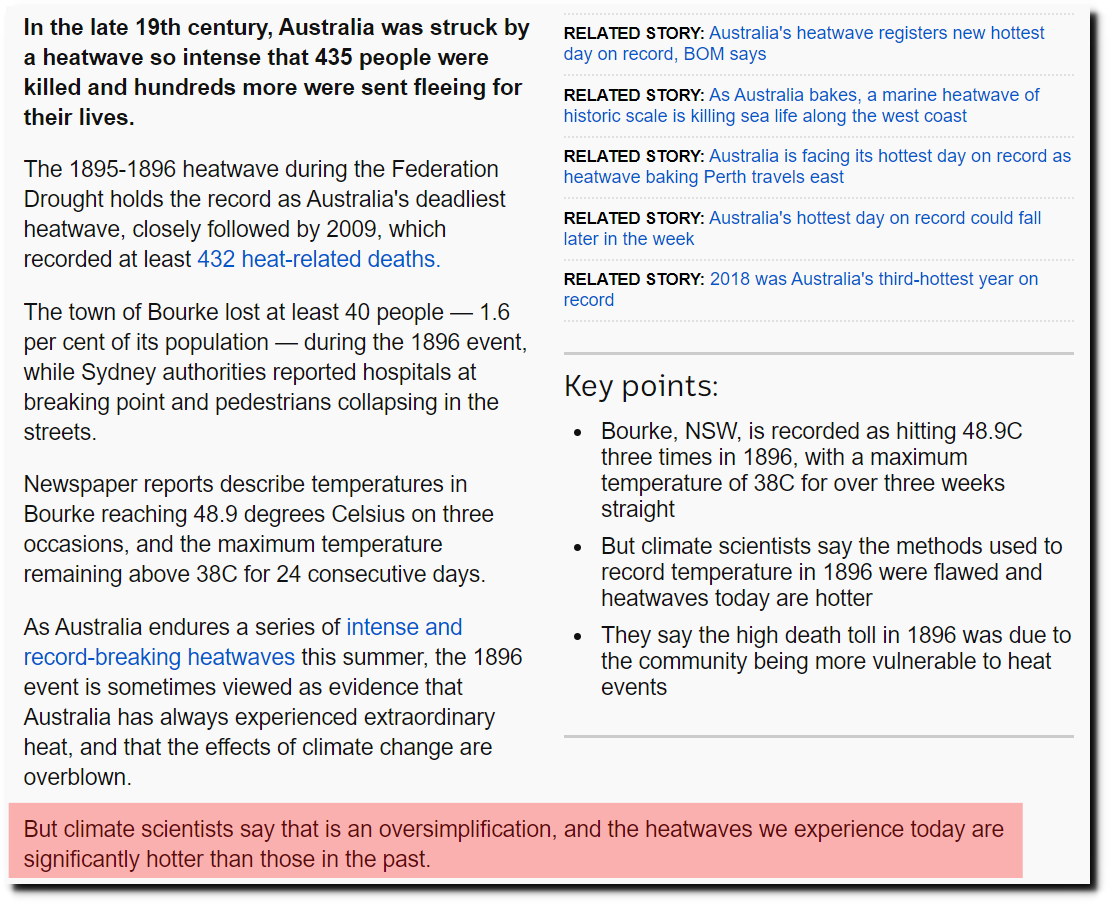
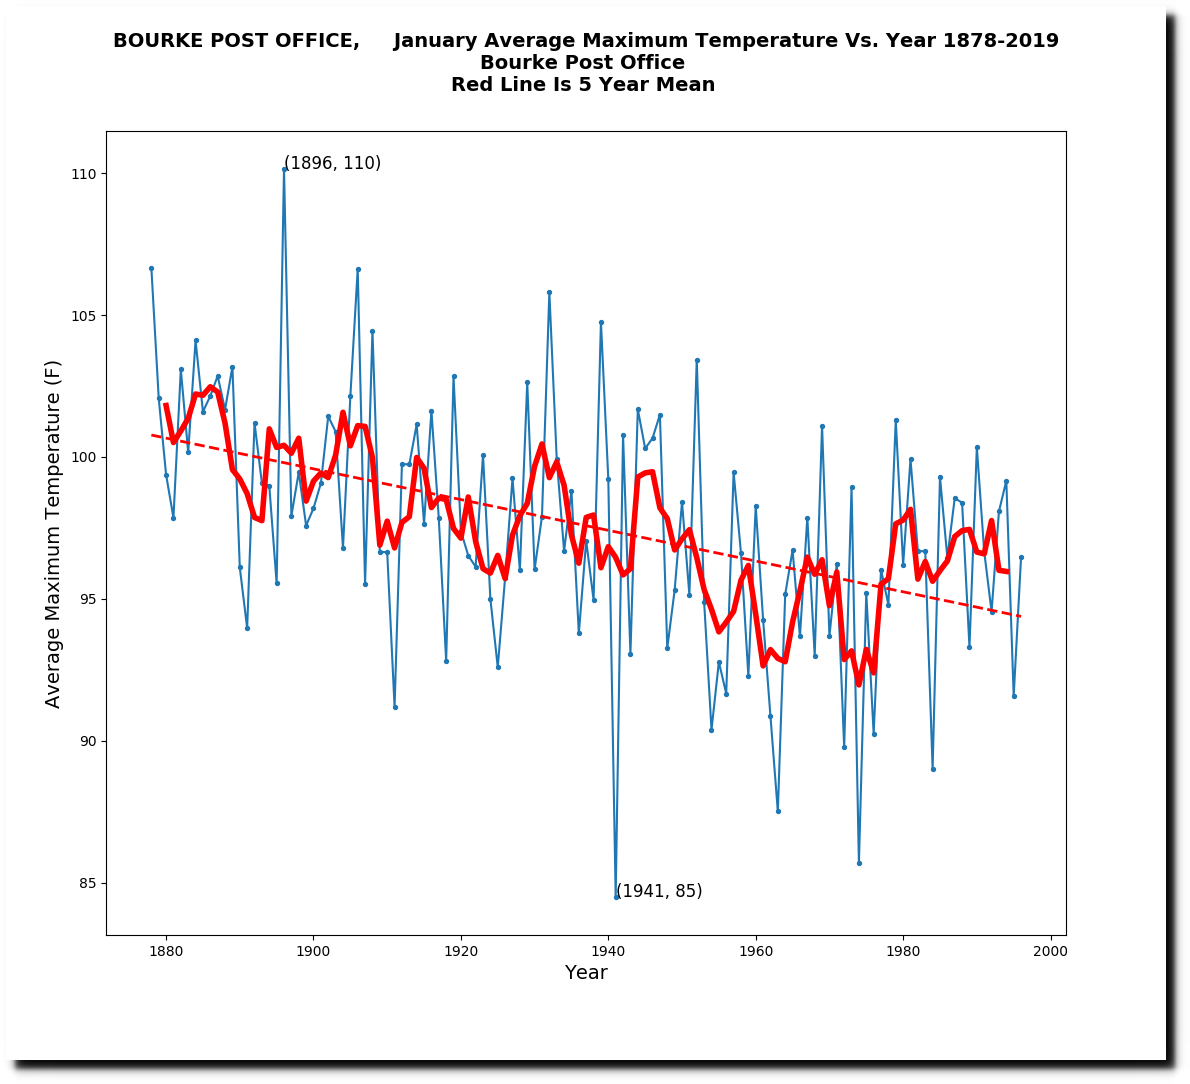
A Stevenson screen was not installed in Bourke until August 1908, meaning temperature readings from before that could be inflated by as much as 2C.

Australia has been surrounded by unusually cold water for most of the last few months.
Current Operational SST Anomaly Charts – OSPO
This led to the coldest summer day on record a few weeks ago, but it also led to drought and the recent heatwave and fires, which have been hyped by the Bureau of Meteorology as the worst ever.
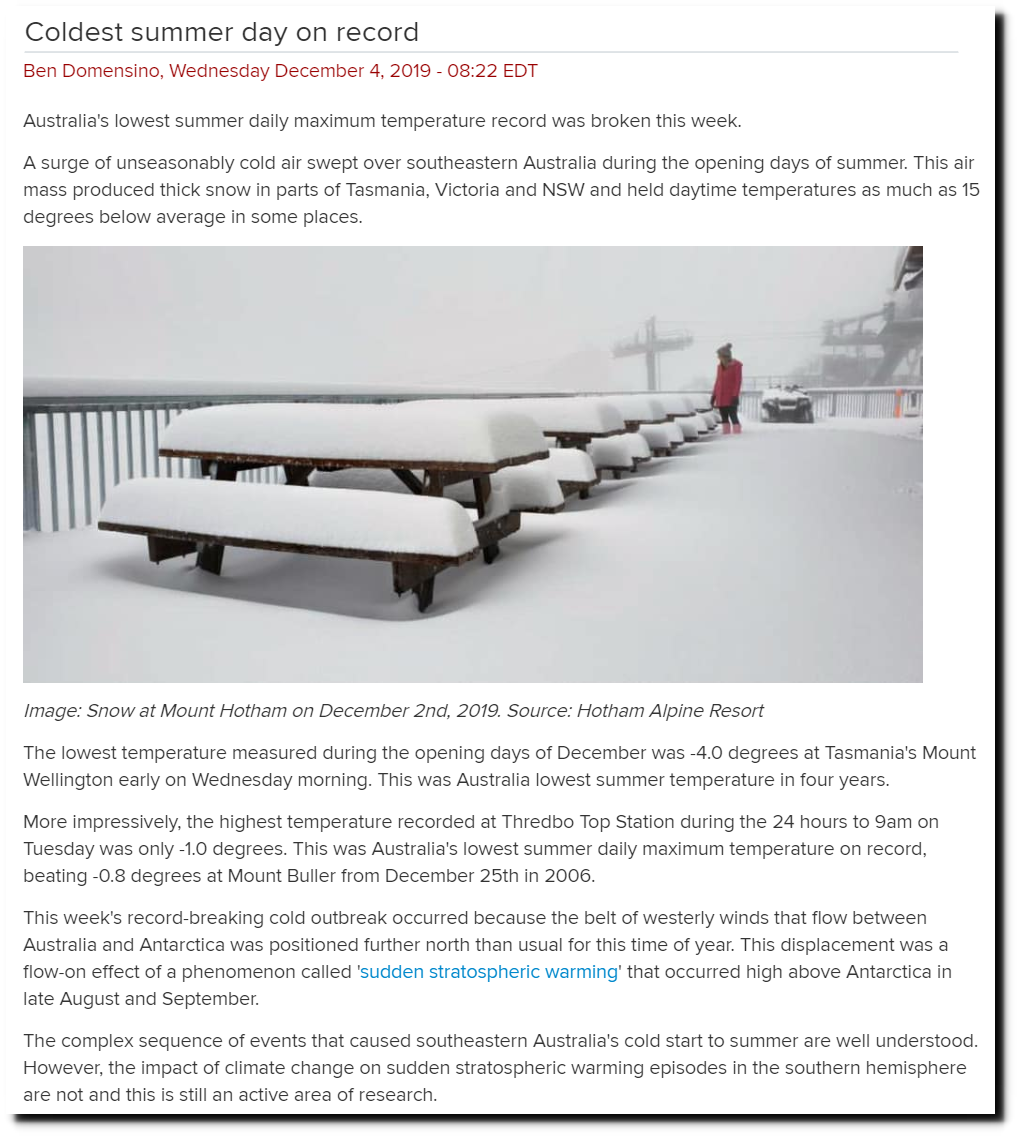
Weather News – Coldest summer day on record
Let’s look at some past heatwaves, and see if the BOM excuses for hiding past heat are valid. The January 1878 heatwave was global, and caused birds to drop out of the trees. BOM seems to believe that the birds would have been OK, had observers kept their thermometers out of the sun.
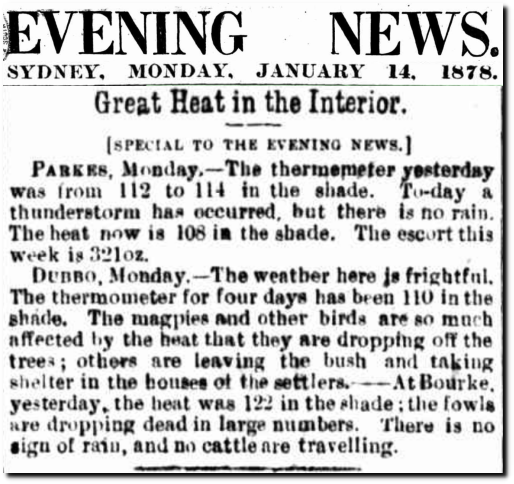
14 Jan 1878 – Great Heat in the Interior. – Trove
Minnesota had their warmest winter on record in 1878.
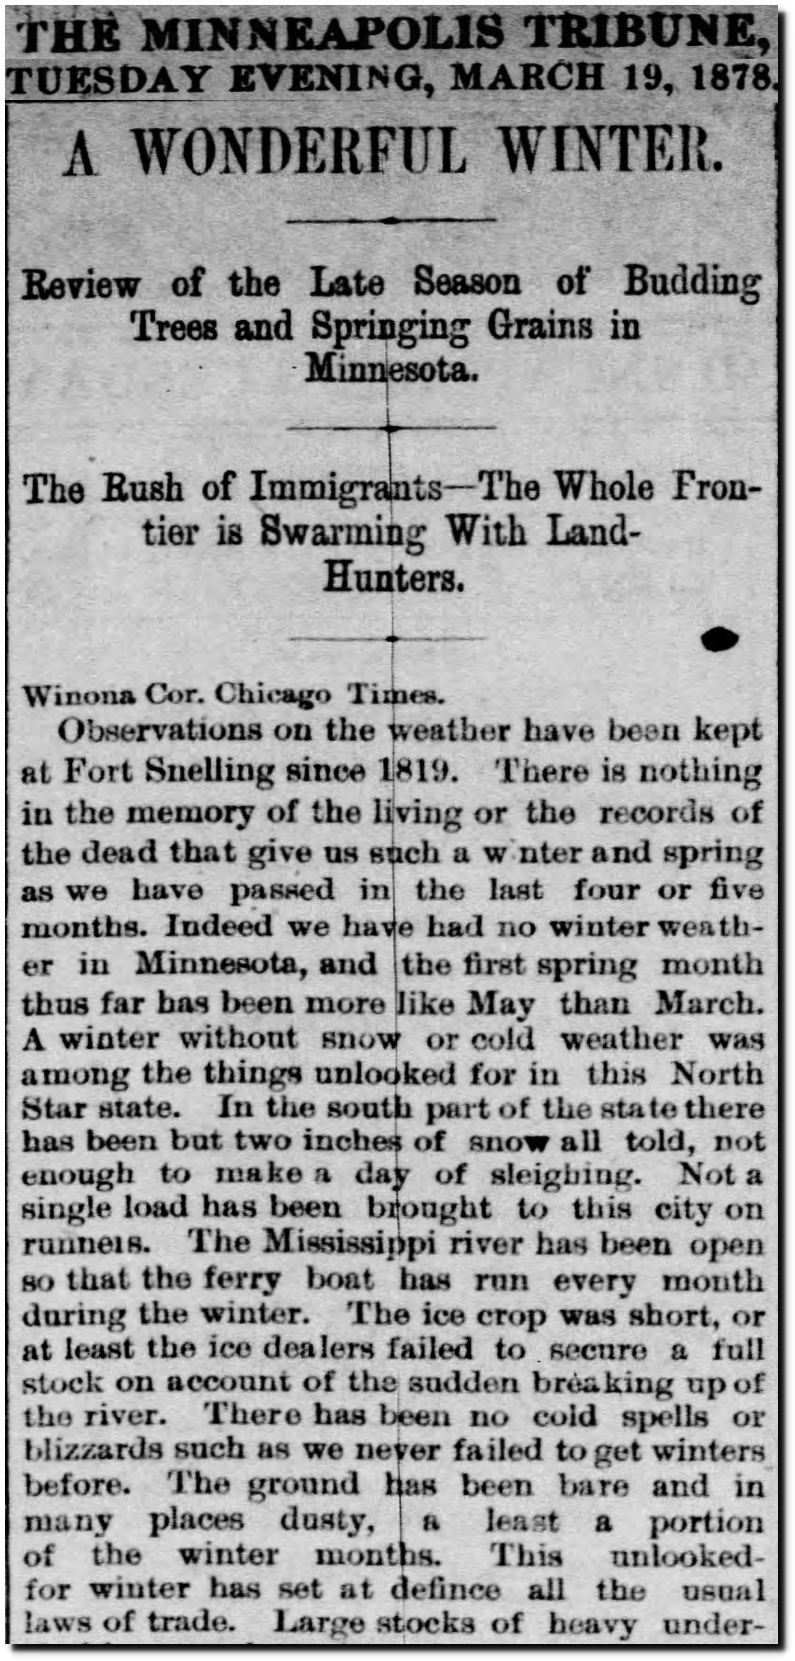
19 Mar 1878, Page 2 – Star Tribune at Newspapers.com
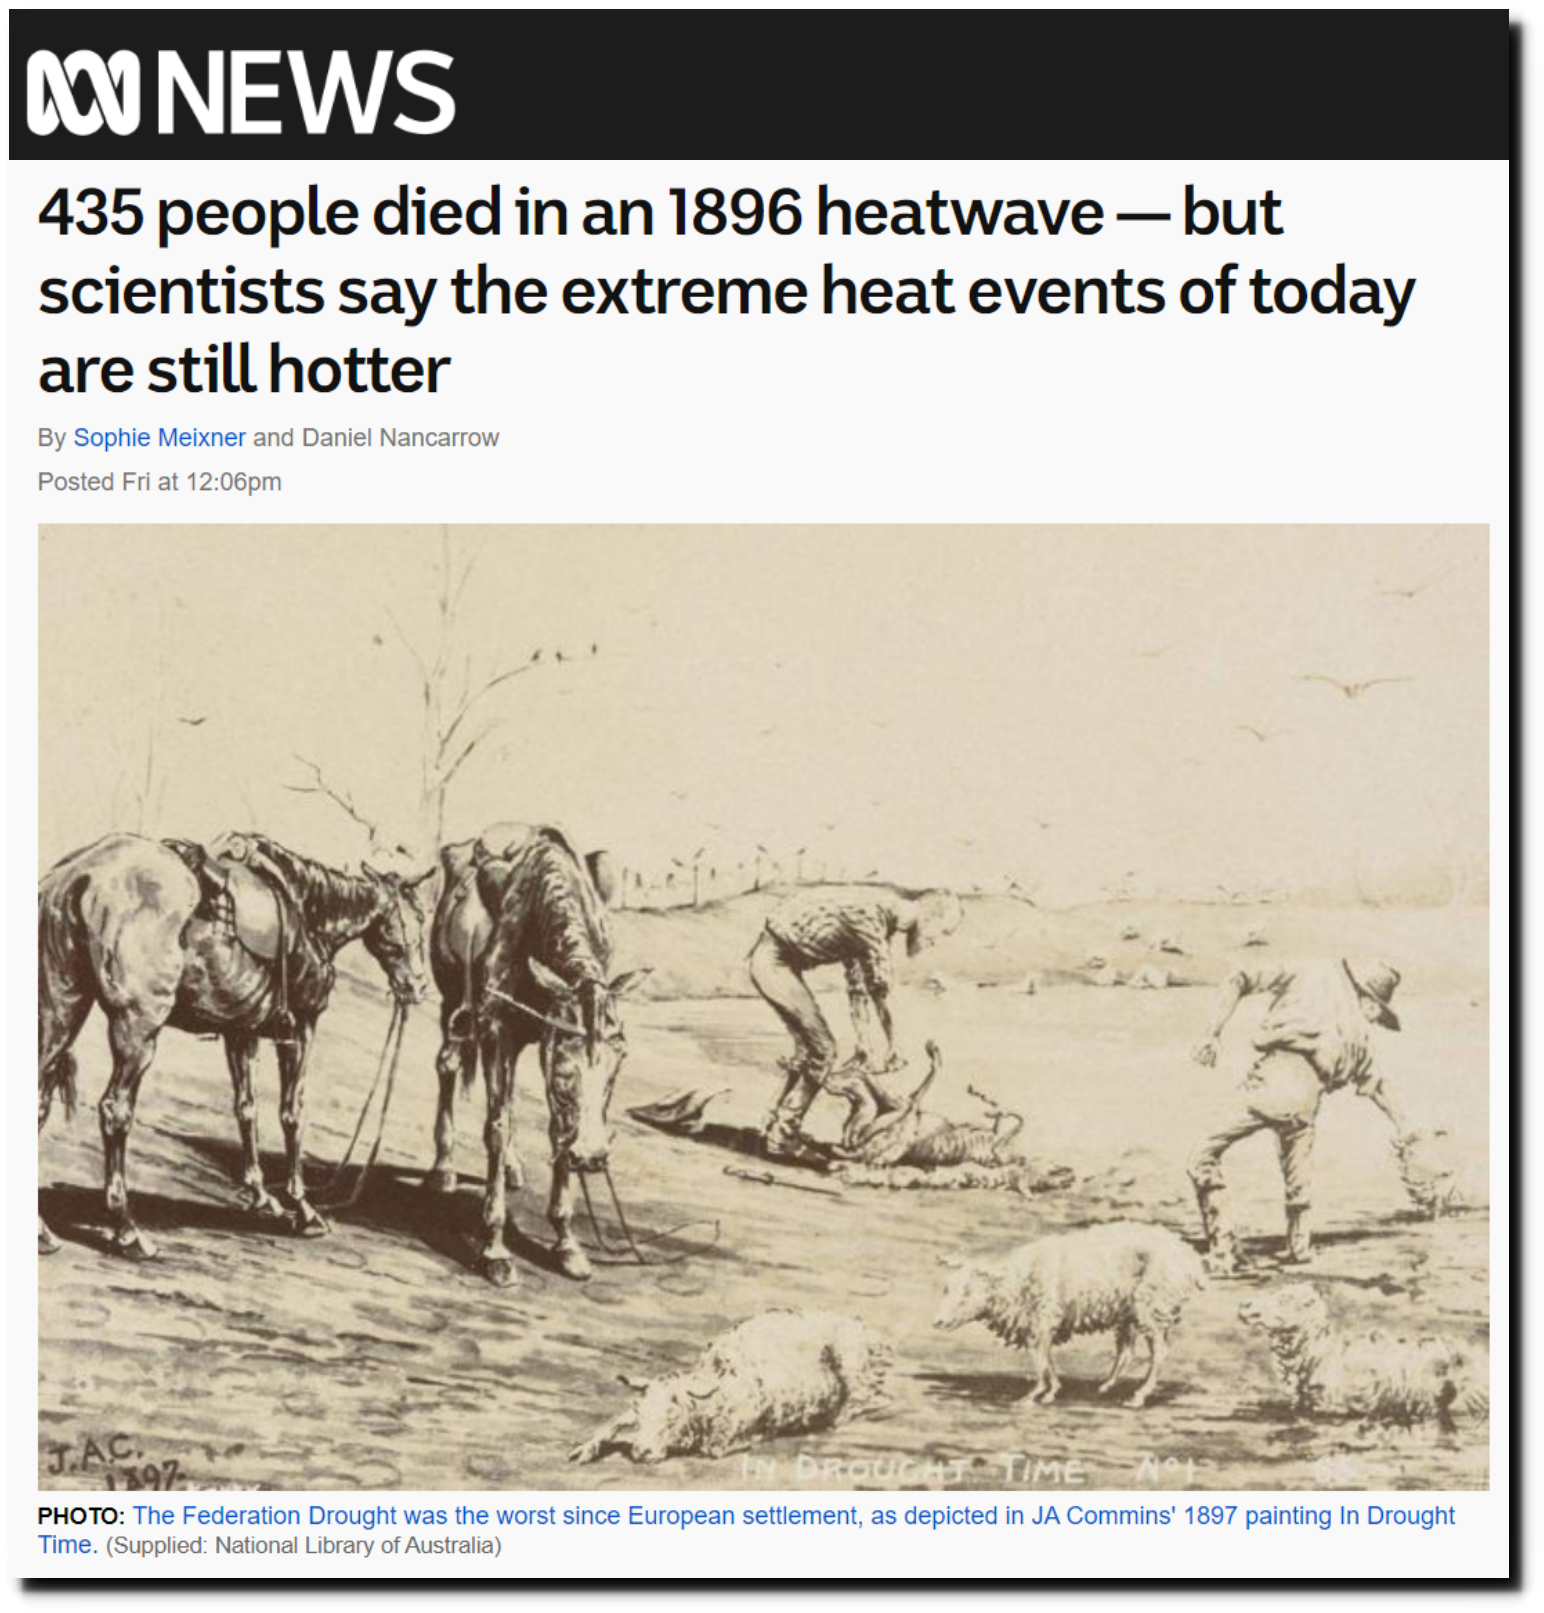
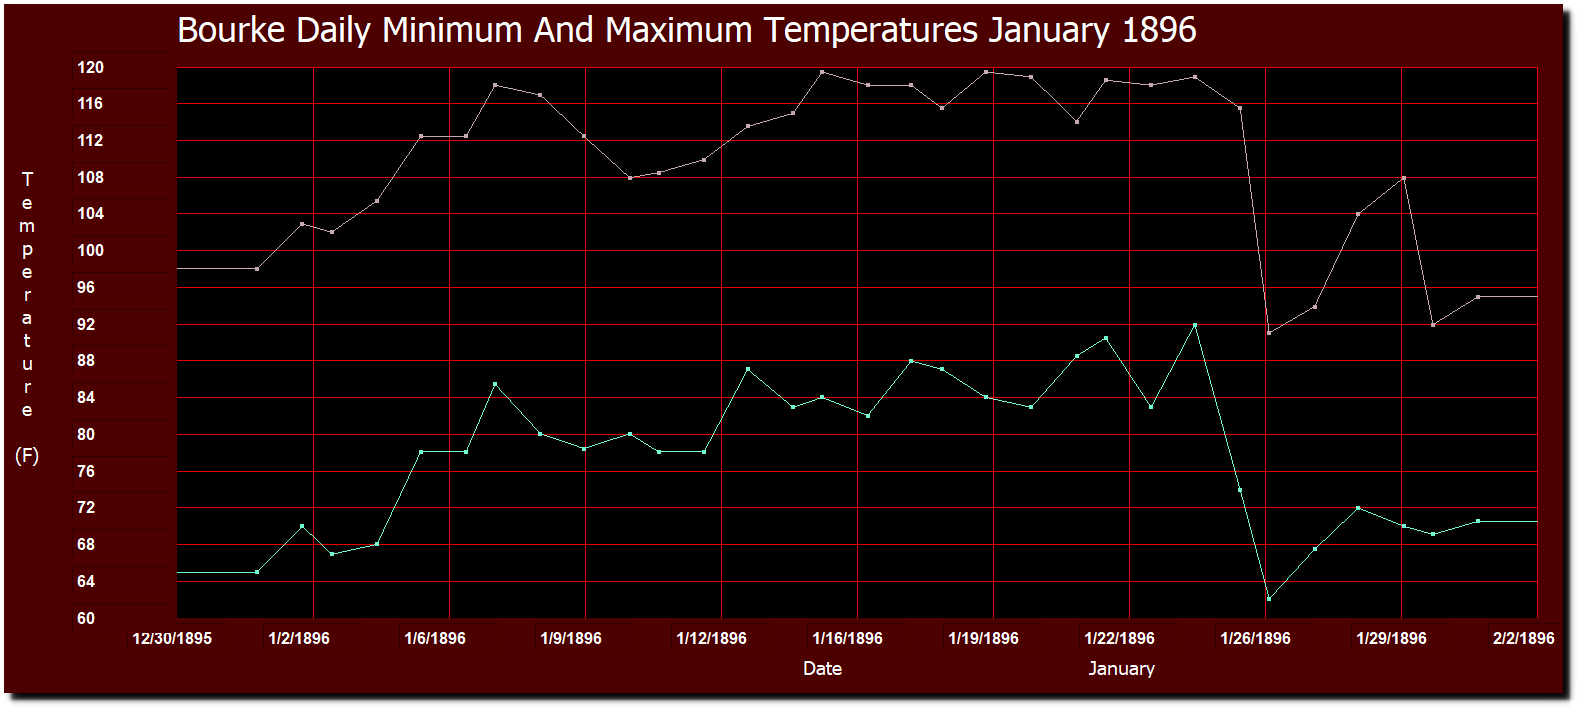
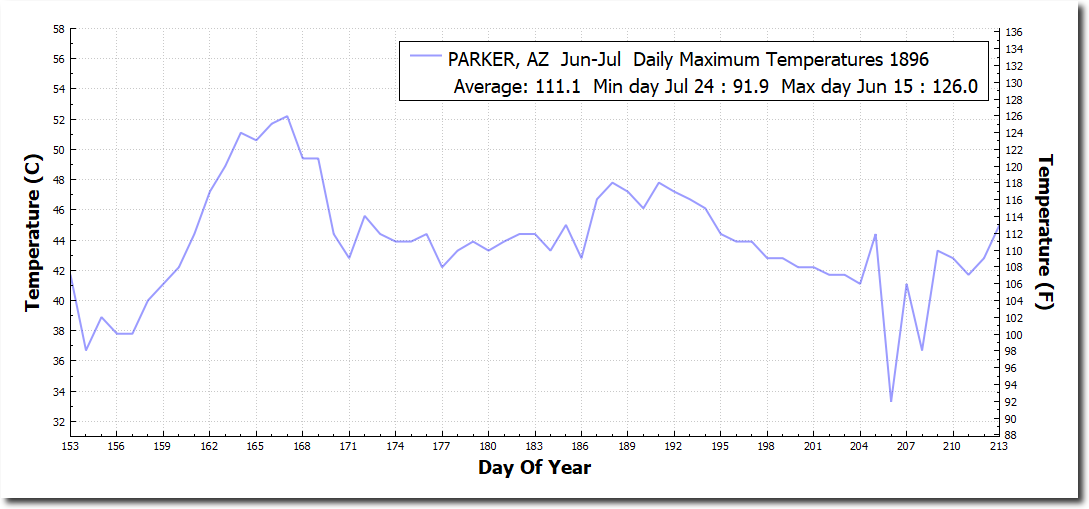
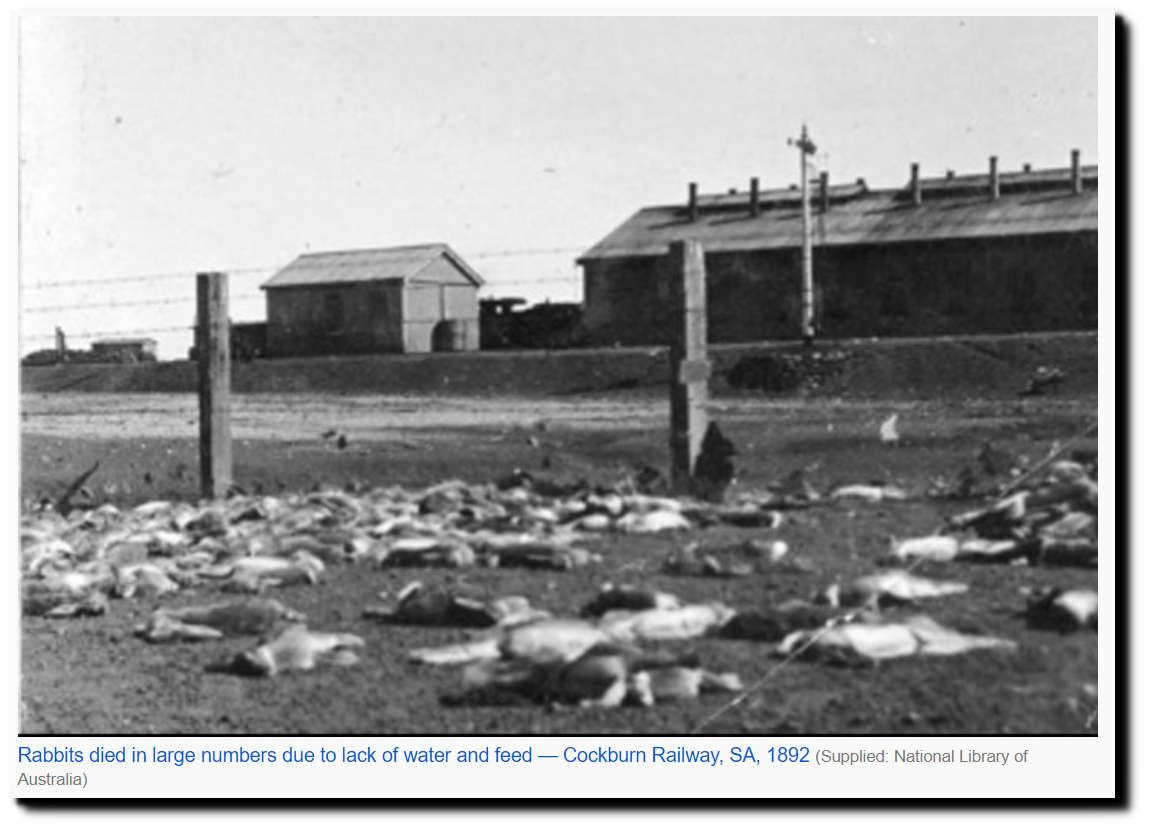
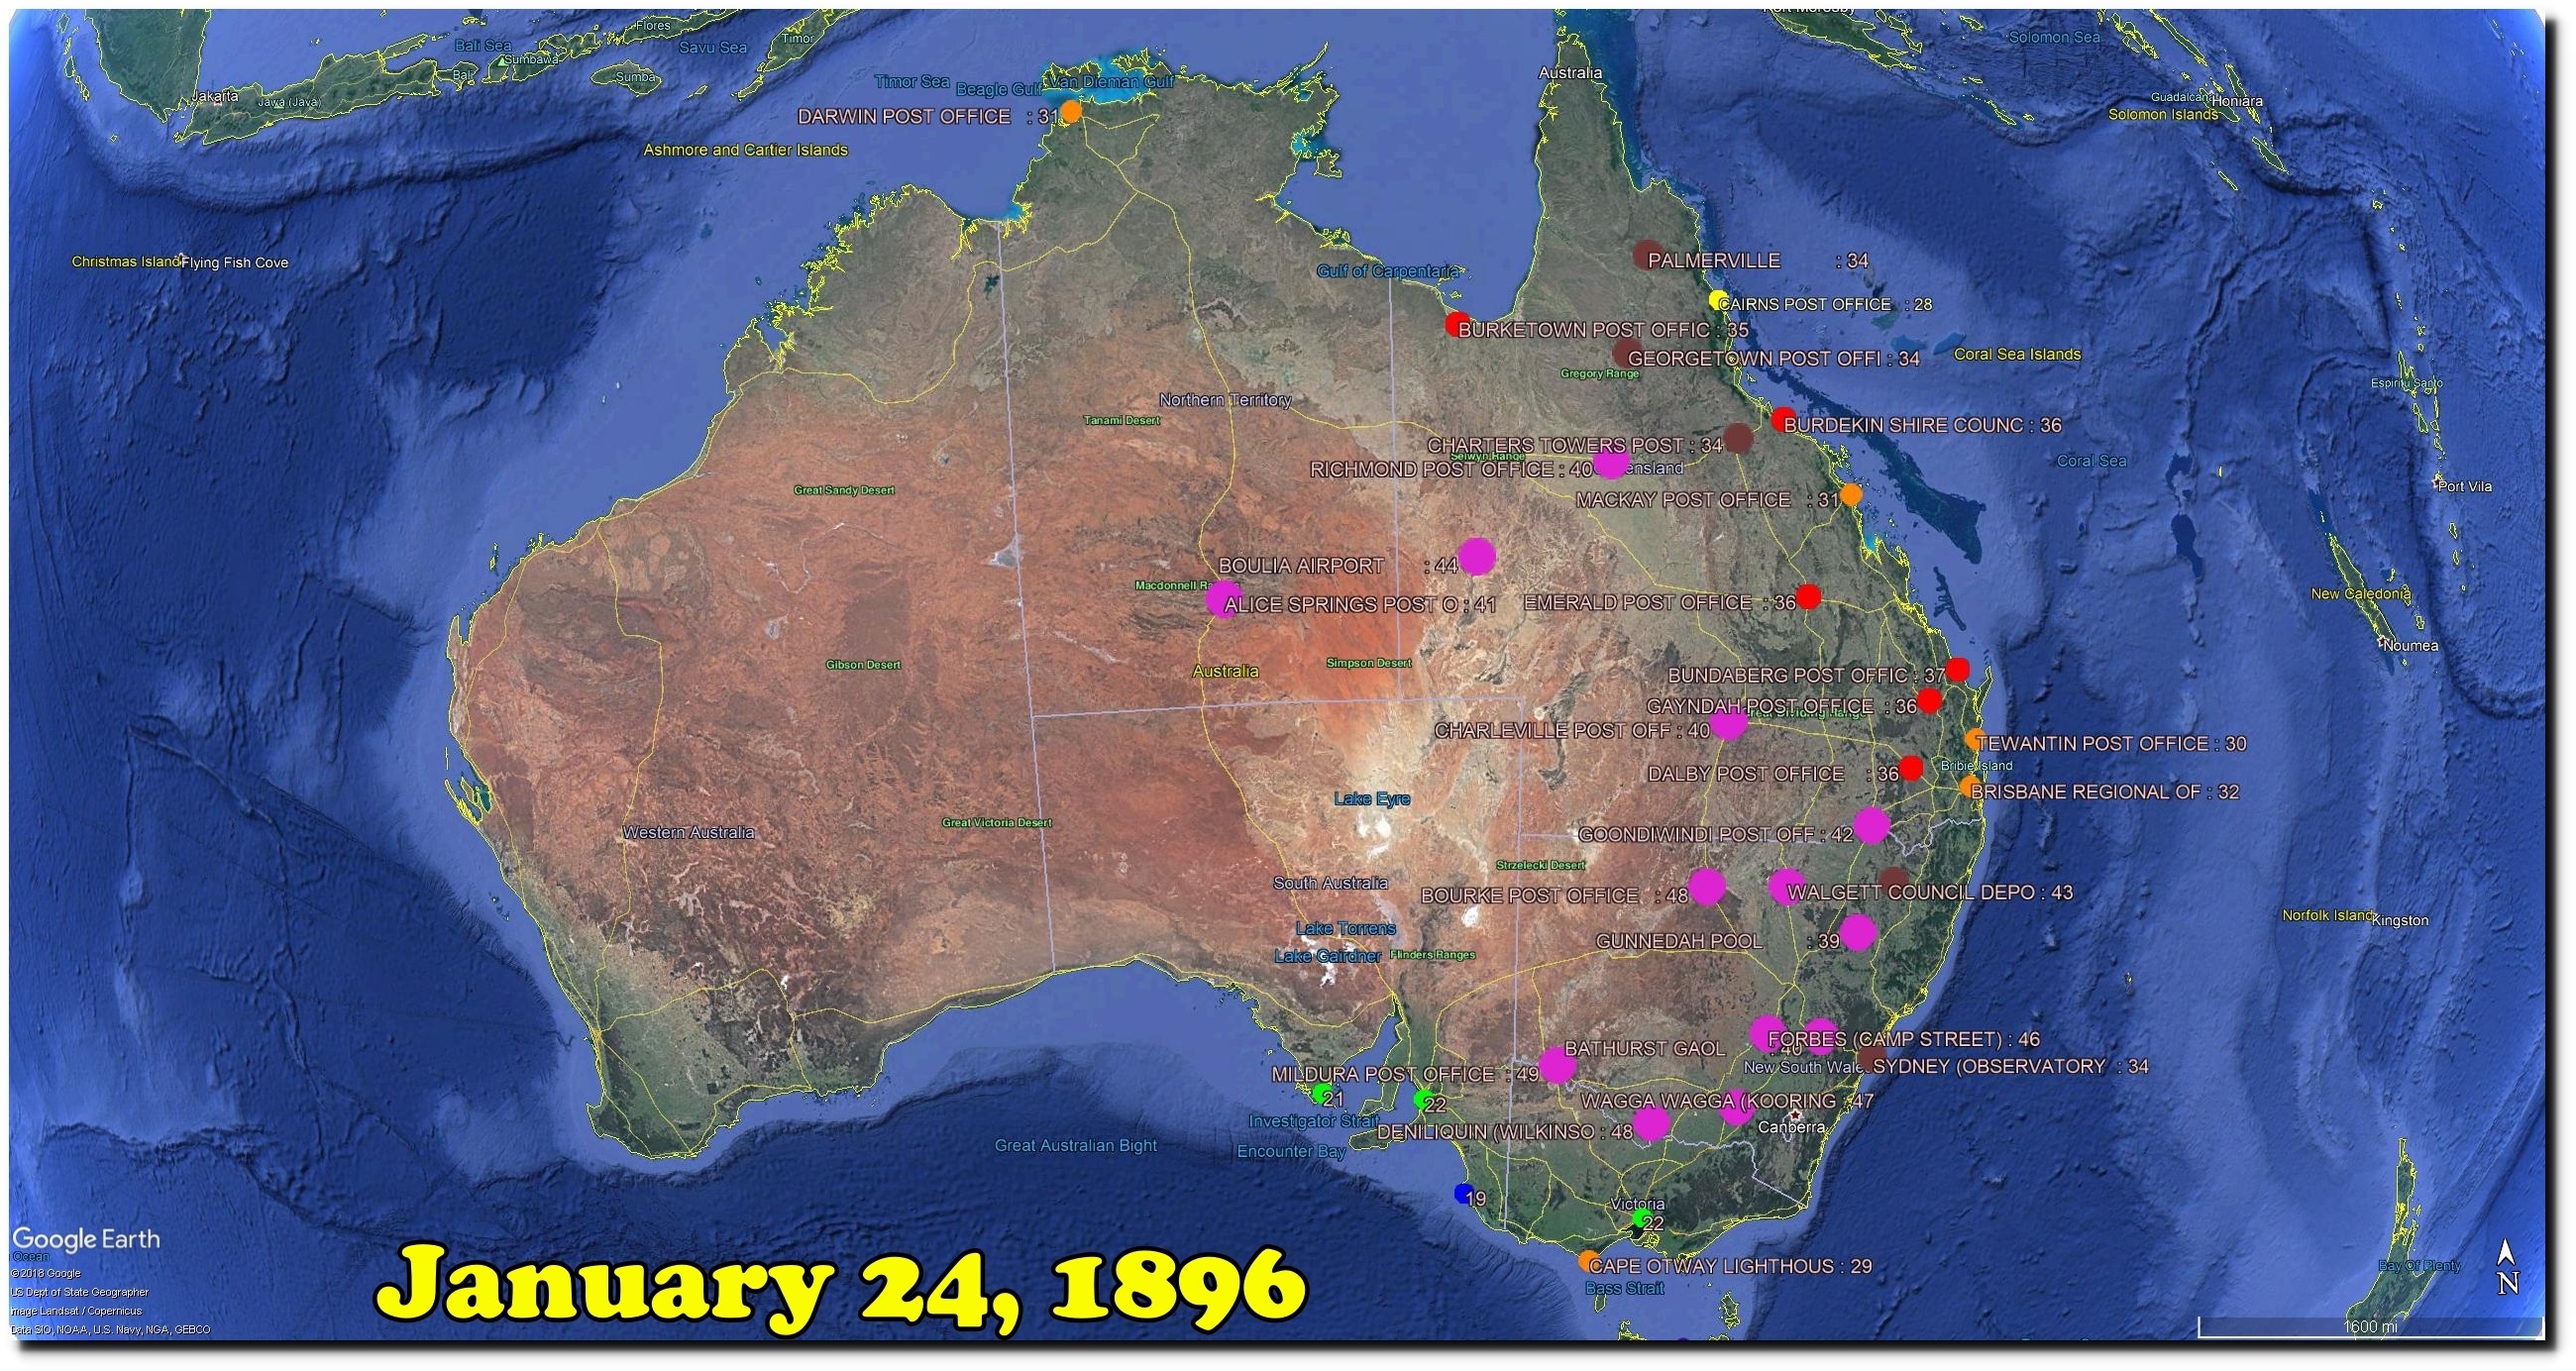
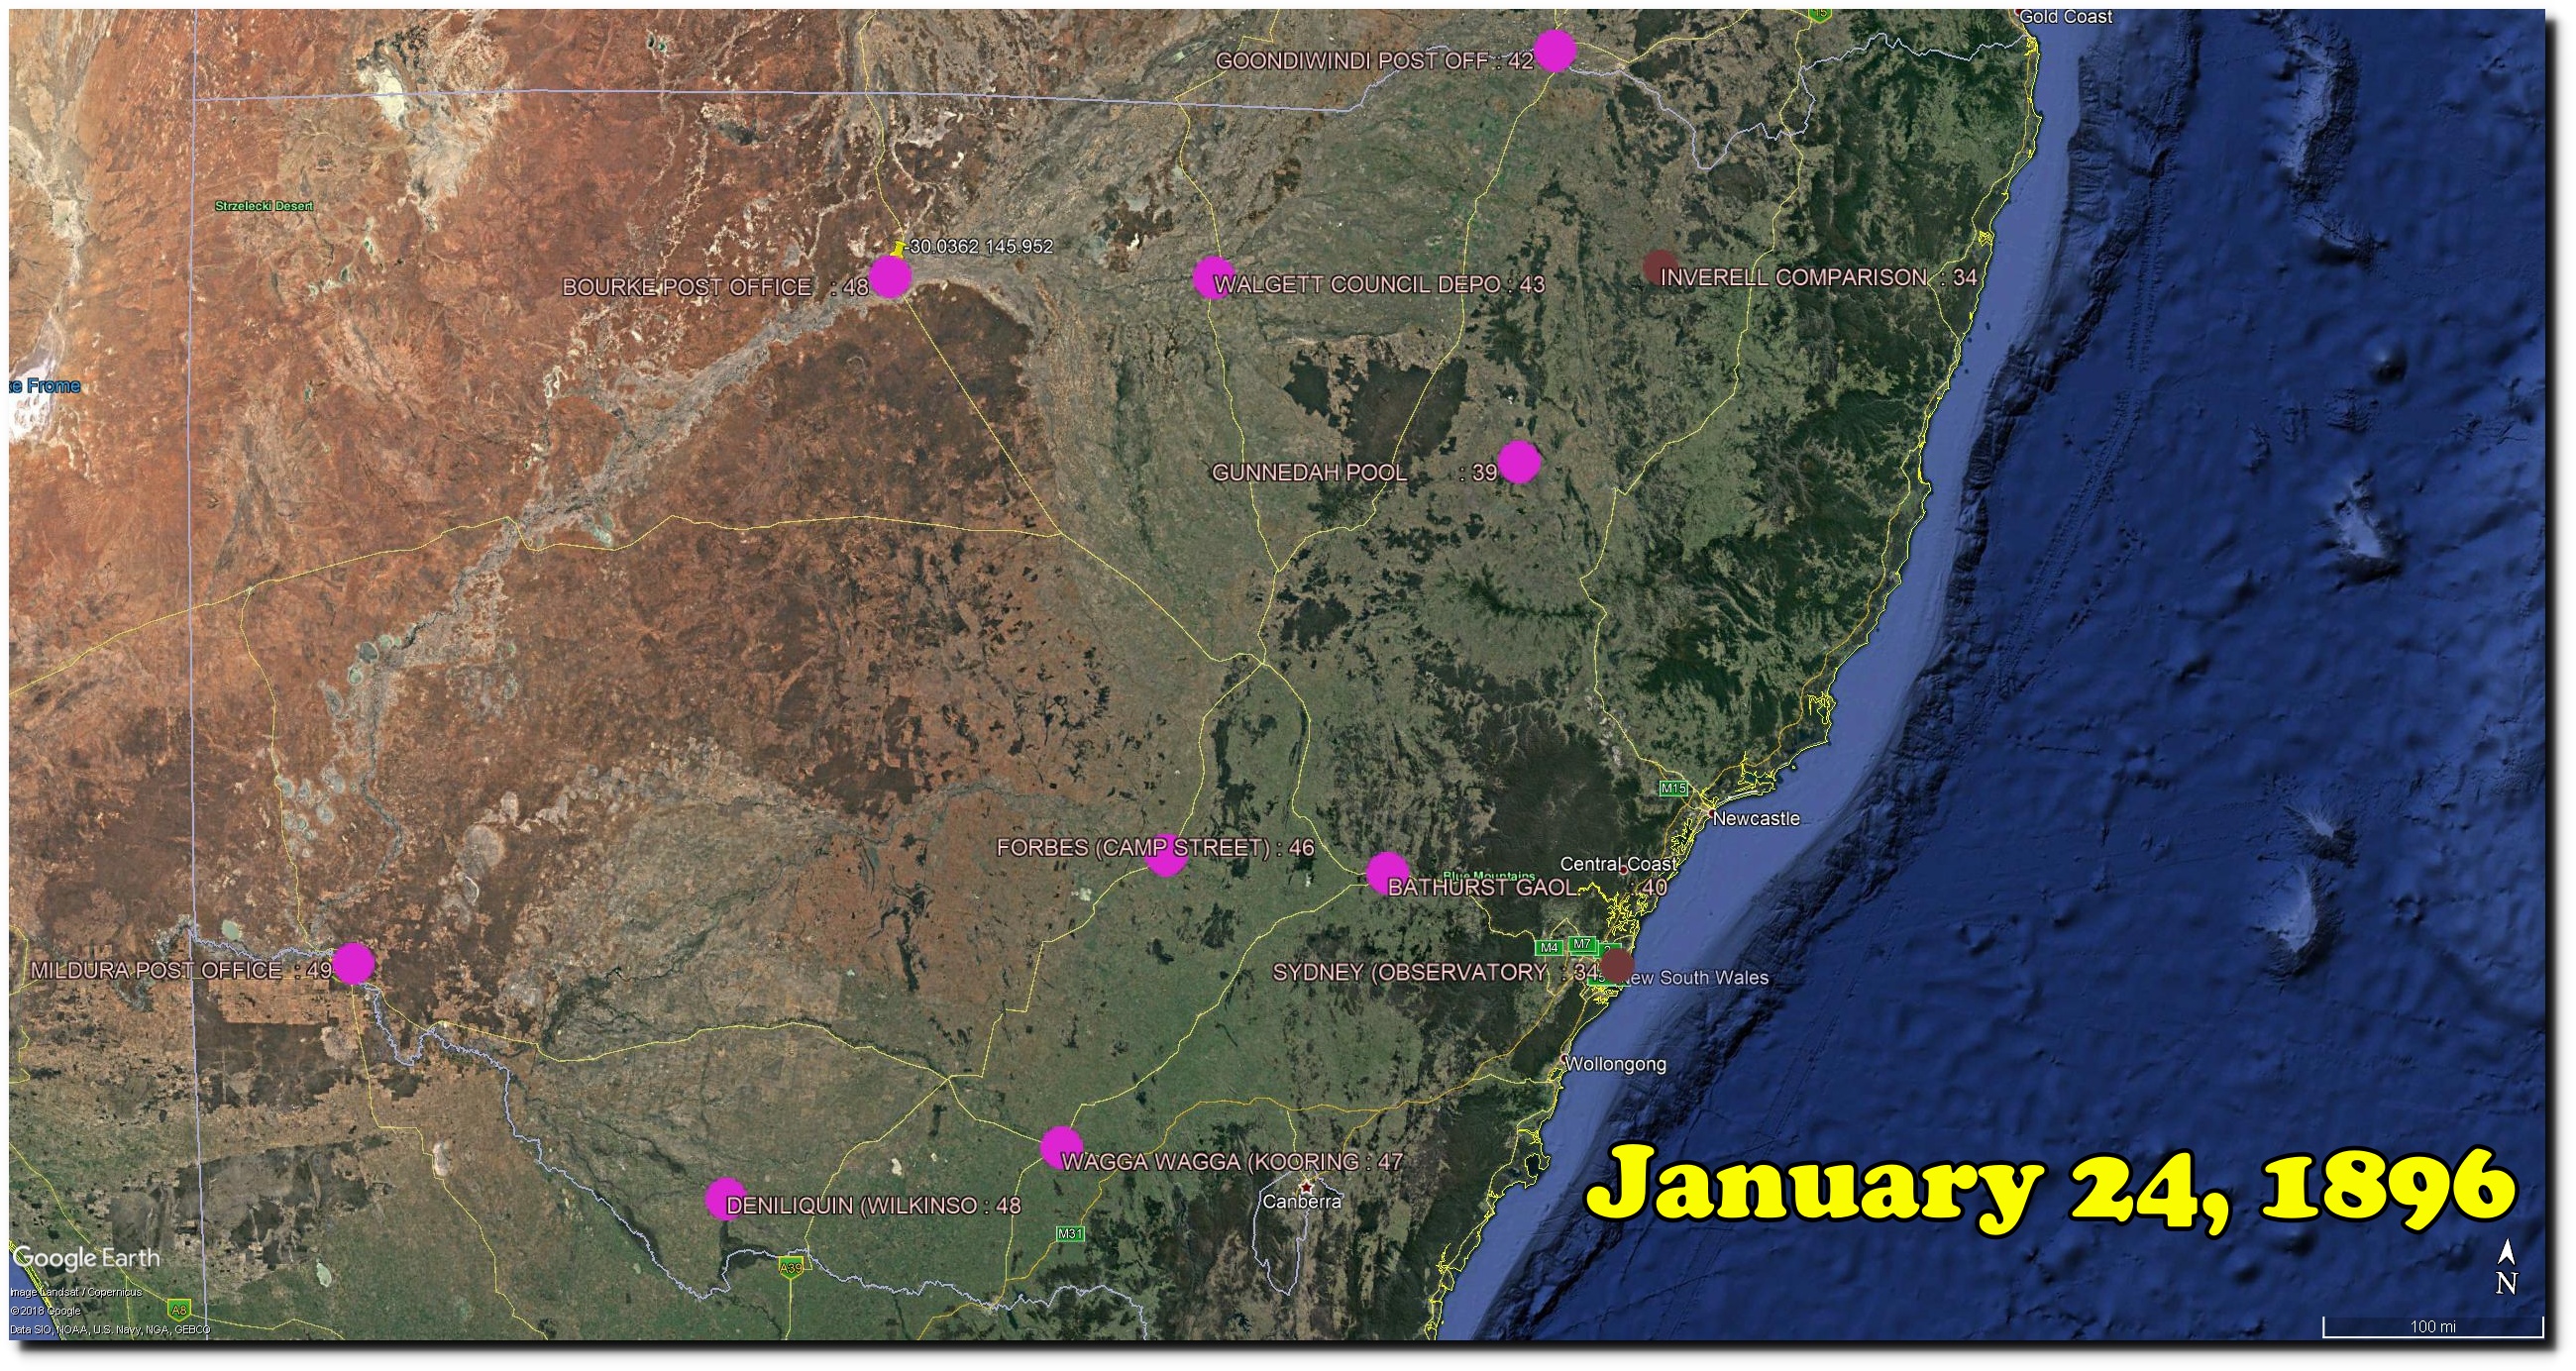
The 1896 heatwave in Australia was the hotetst on record, and killed huge numbers of kangaroos, dingoes, rabbits and birds. Once again, BOM seems to believe that these animals were victims of improperly situated thermometers.
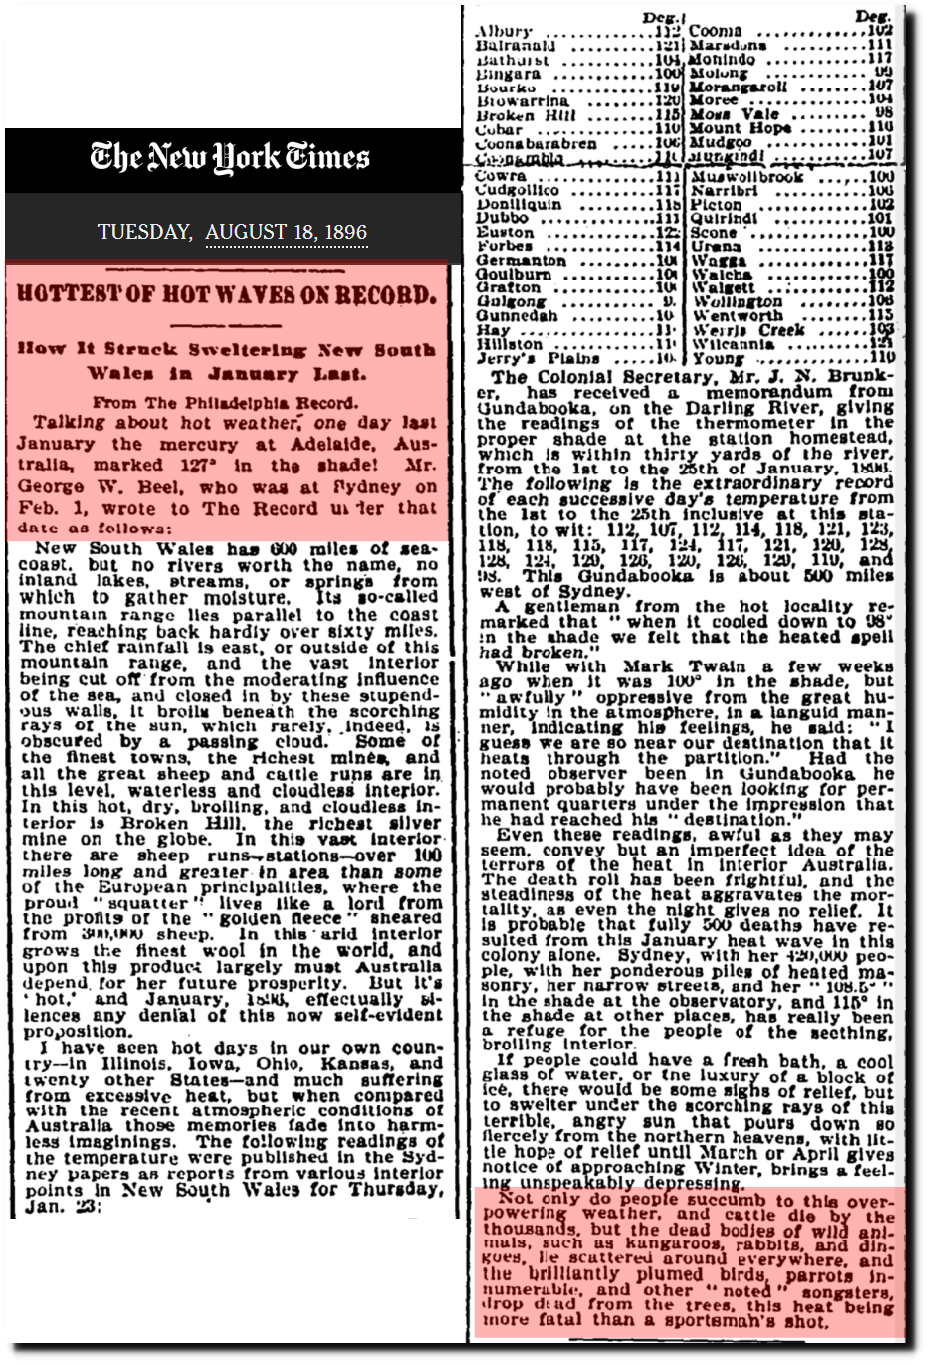
Night time temperatures were extremely hot too. Apparently BOM believes these were due to thermometers in the sun at midnight.
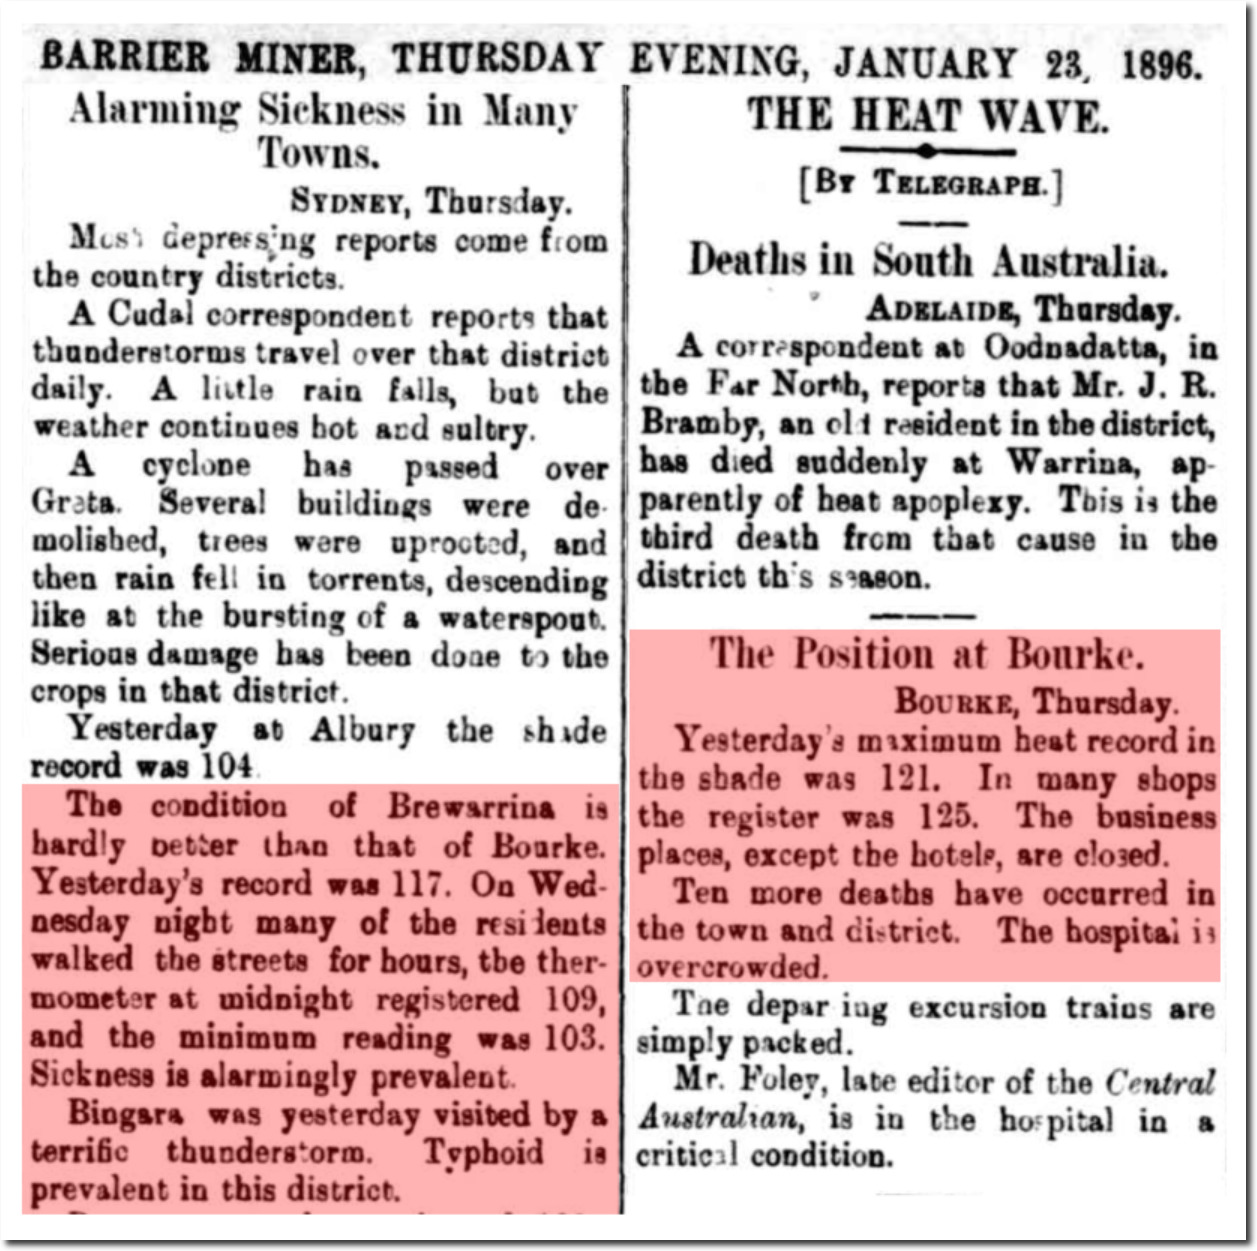

23 Jan 1896 – THE HEAT WAVE. – Trove
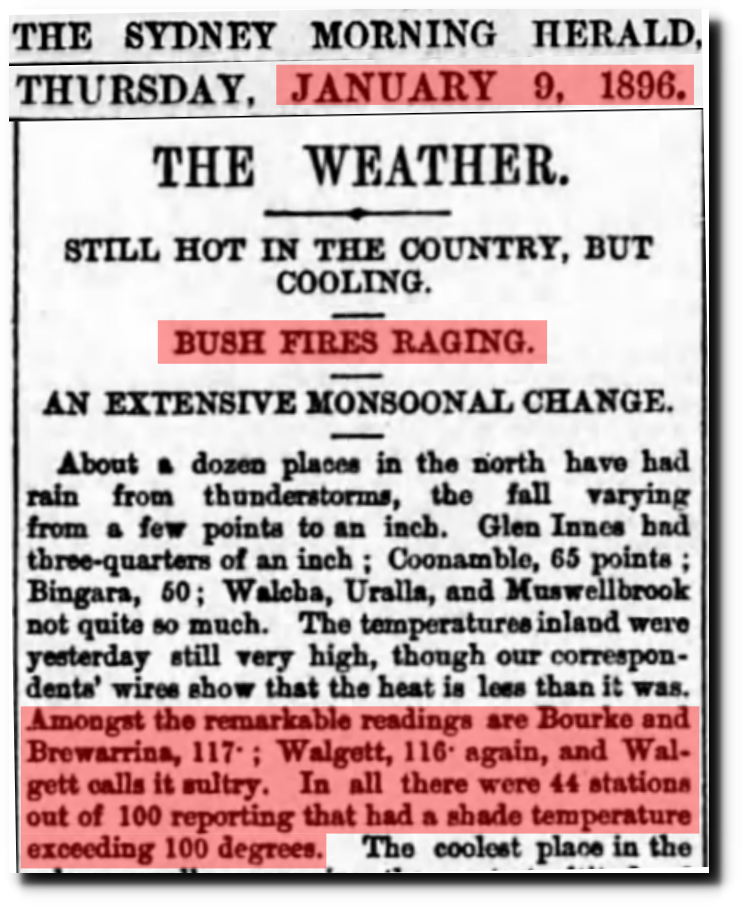
09 Jan 1896, Page 5 – The Sydney Morning Herald at Newspapers.com
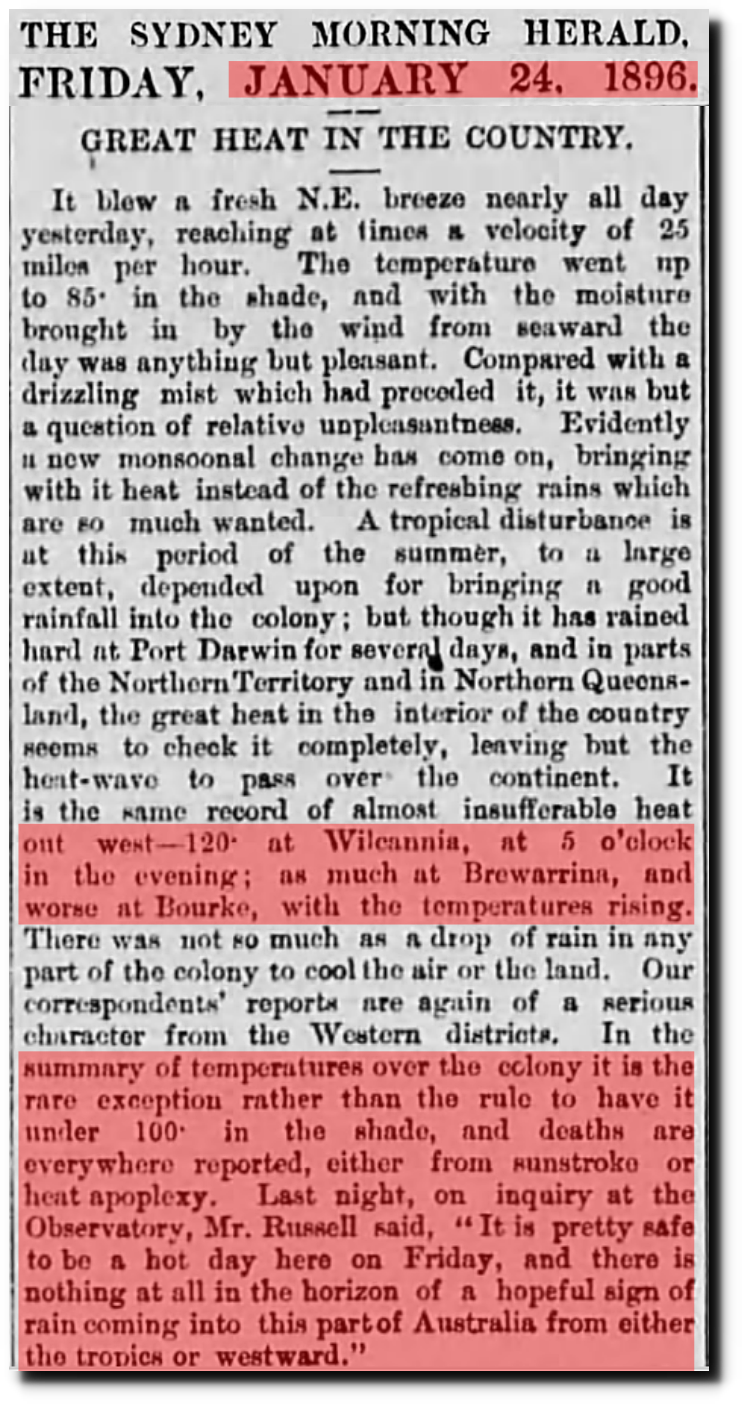
24 Jan 1896, Page 5 – The Sydney Morning Herald at Newspapers.com
I hadn’t realized previously that Australia is the land of the midnight sun. Thanks for clearing that up BOM.


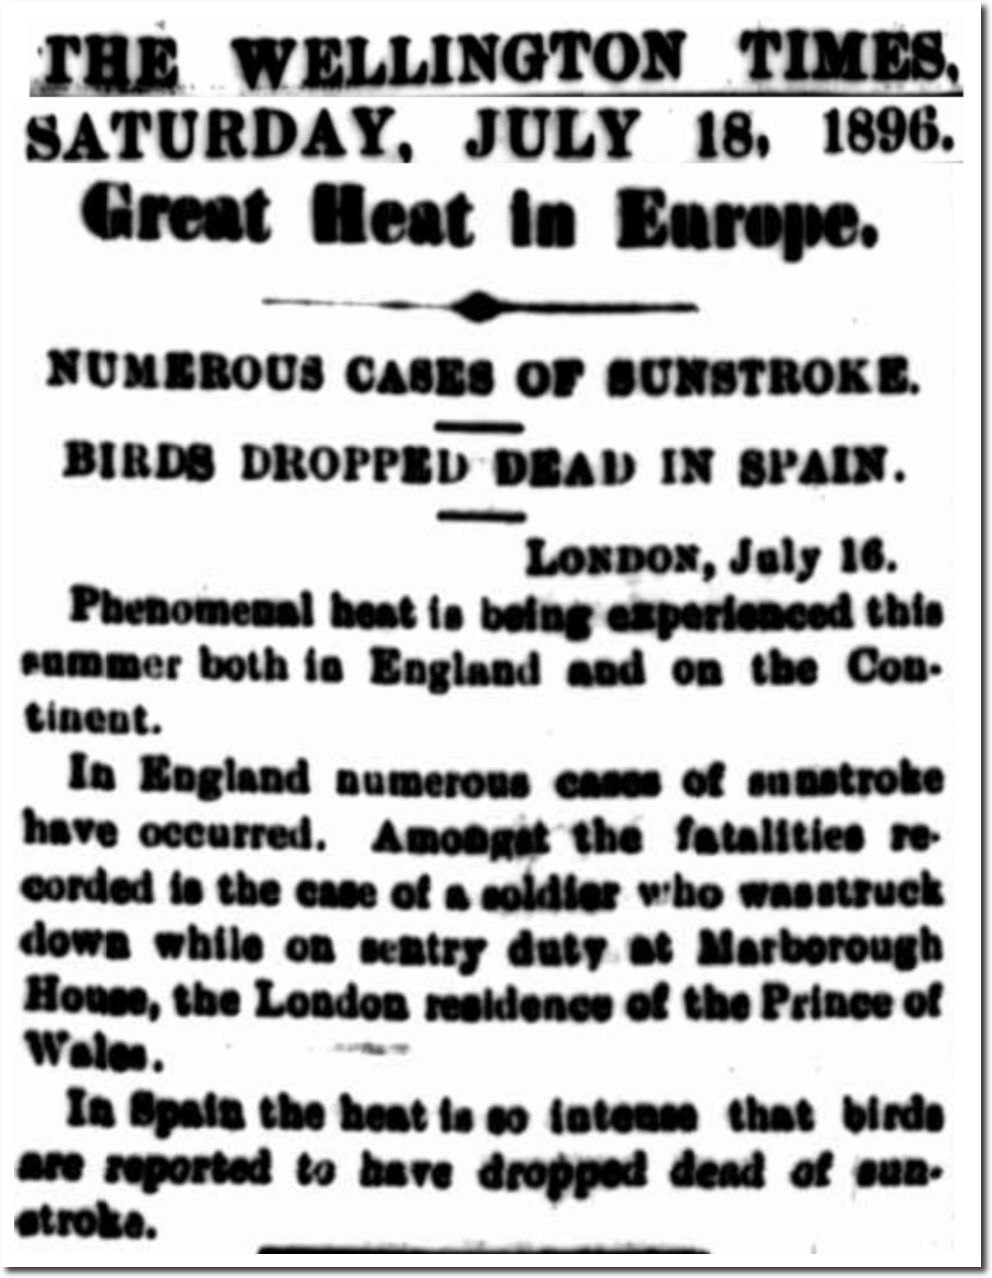
18 Jul 1896 – Great Heat in Europe. – Trove
The National Geographic Archive | April 1896 | page 1
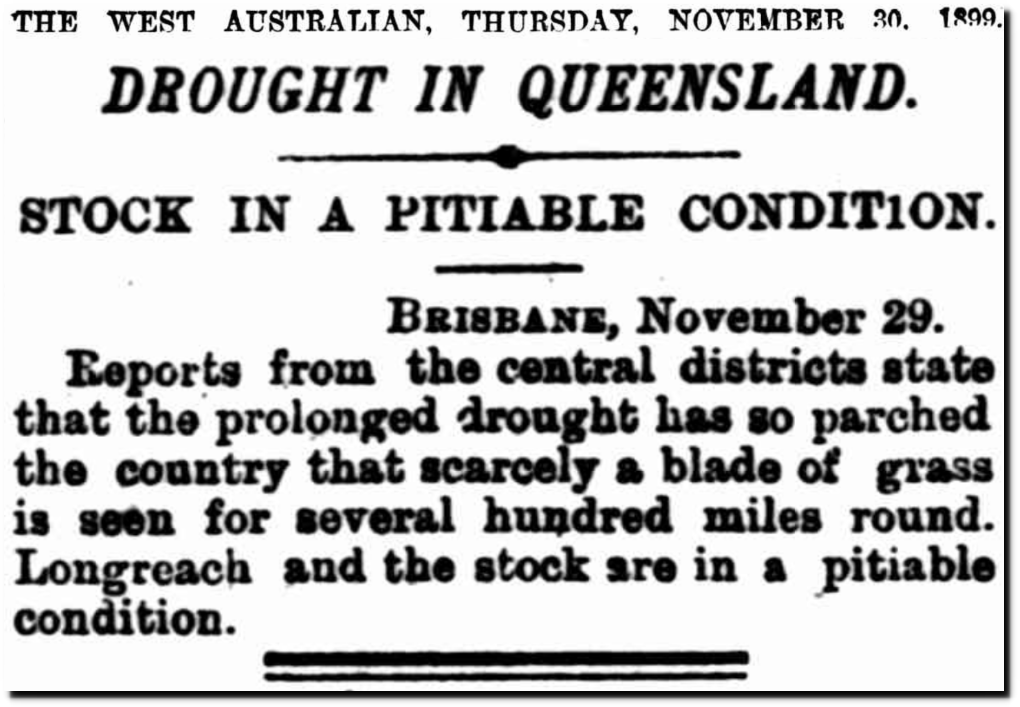
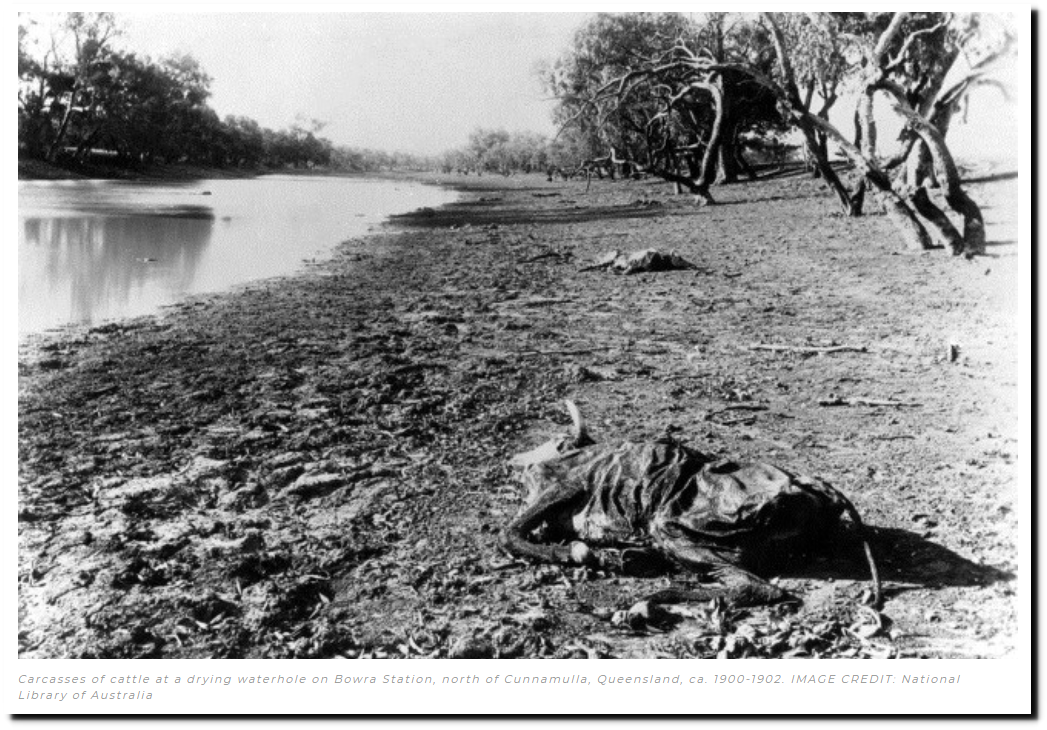
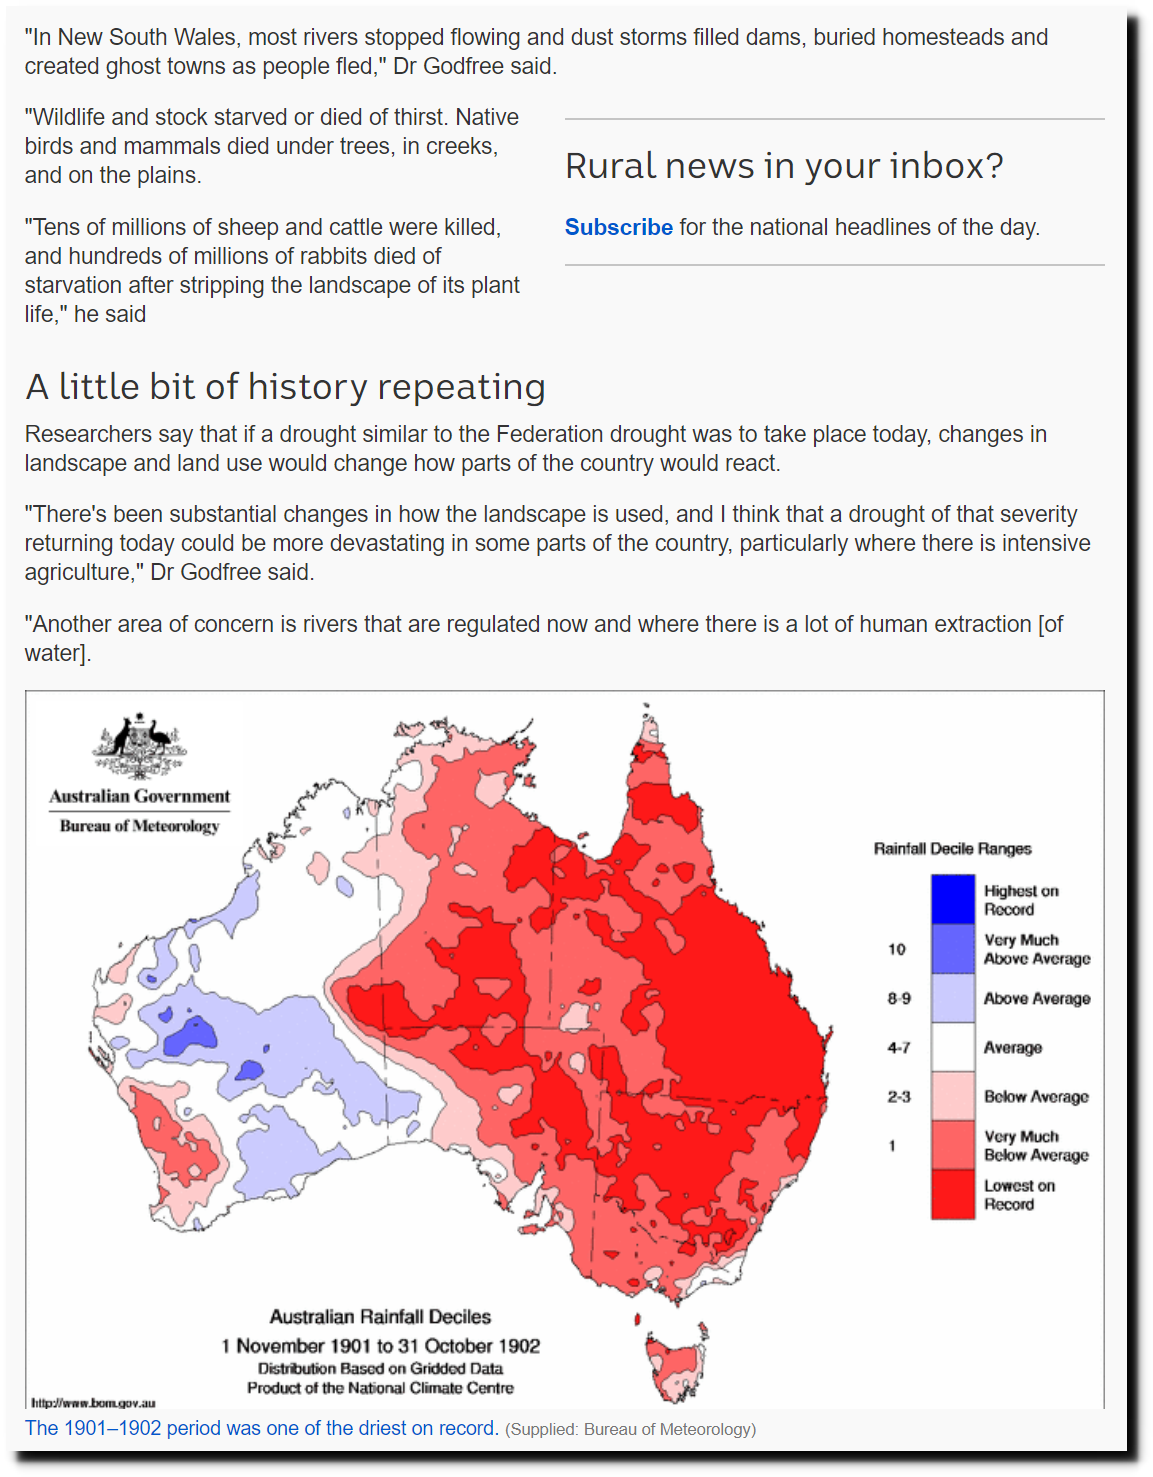
30 Nov 1899 – DROUGHT IN QUEENSLAND. – Trove

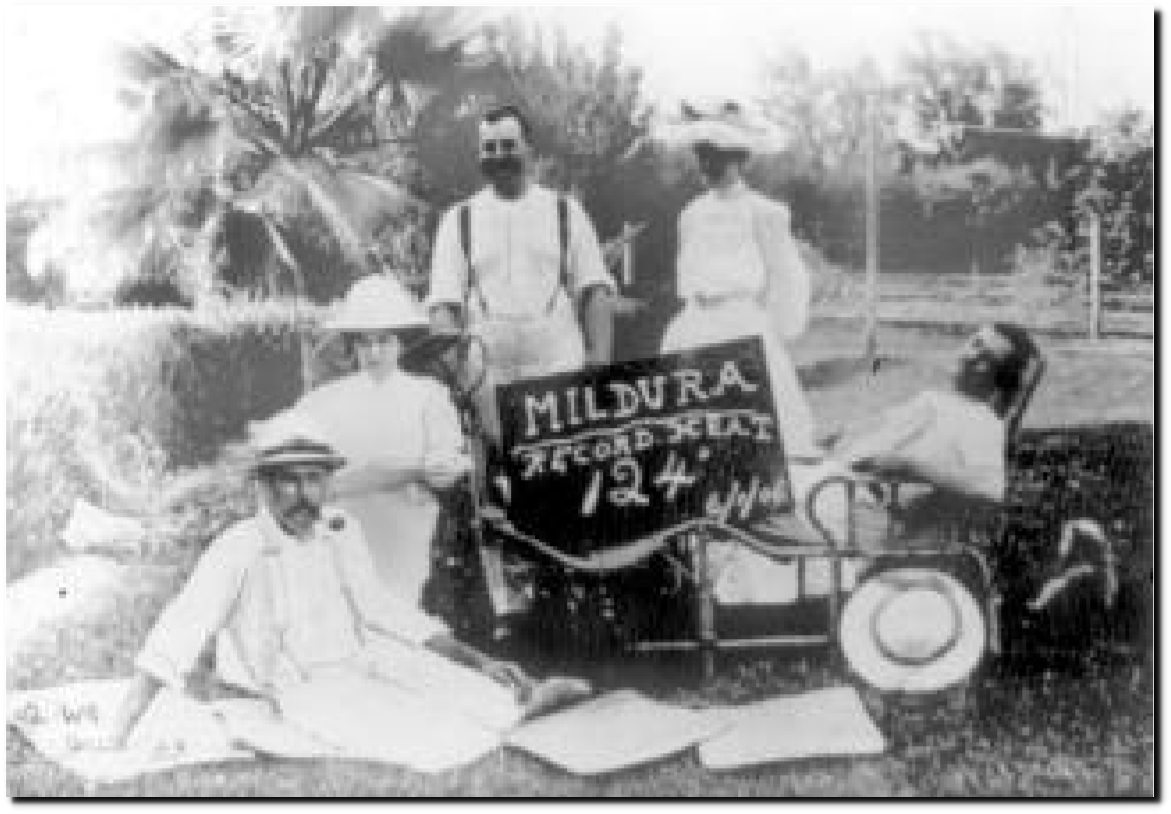
Victoria’s hottest day on record was January 7, 1906. The Argus reported that the equipment was reliable, and that temperatures were taken every half hour both in the shade and the sun. Sun temperatures were typically 50-60 degrees hotter than shade temperatures.
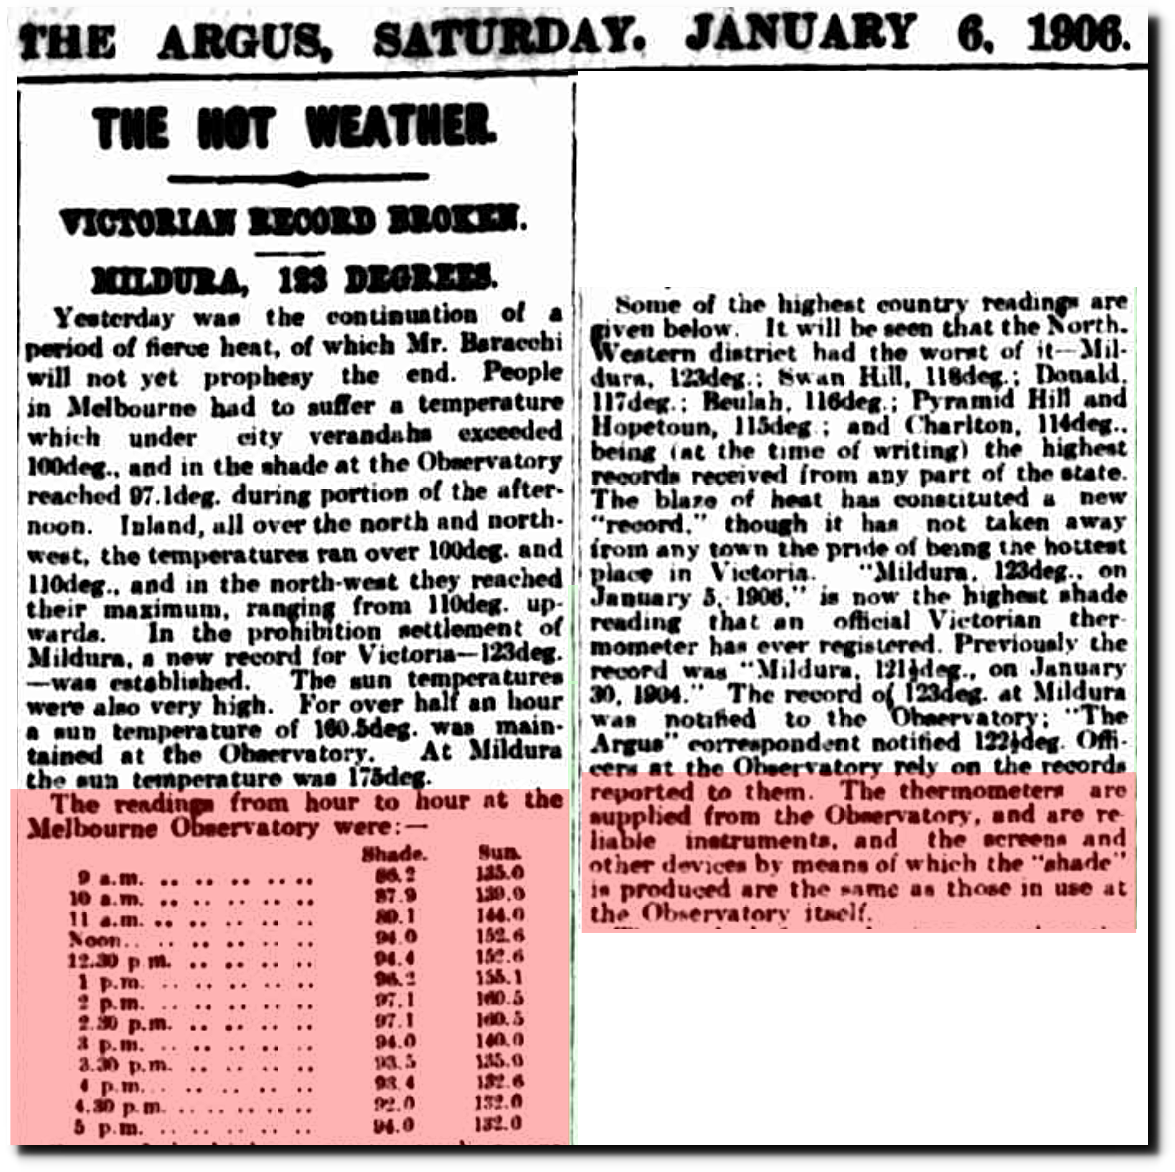
06 Jan 1906 – THE HOT WEATHER. – Trove
But BOM argues that the observer reading the thermometer wasn’t clever enough to know if the thermometer was in the sun, and that it read two degrees too high.
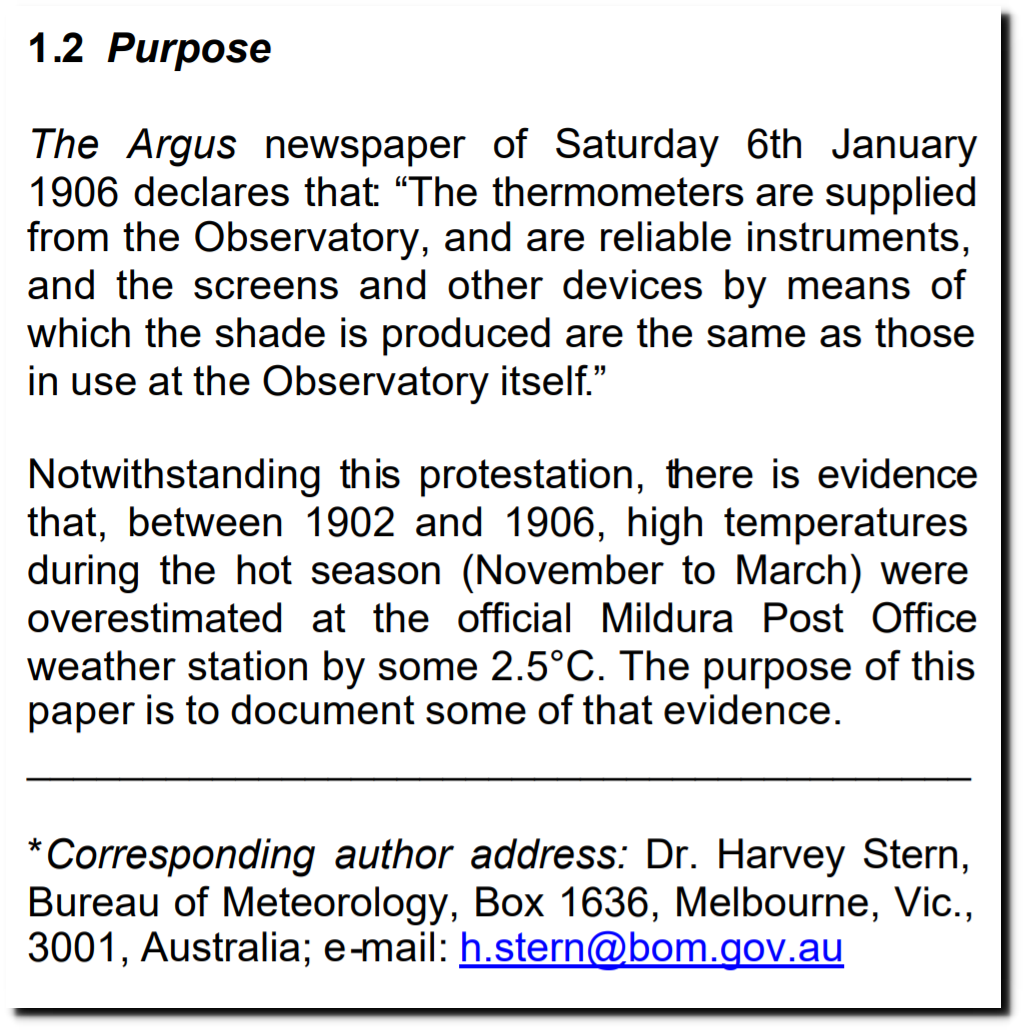
https://ams.confex.com/ams/pdfpapers/155748.pdf
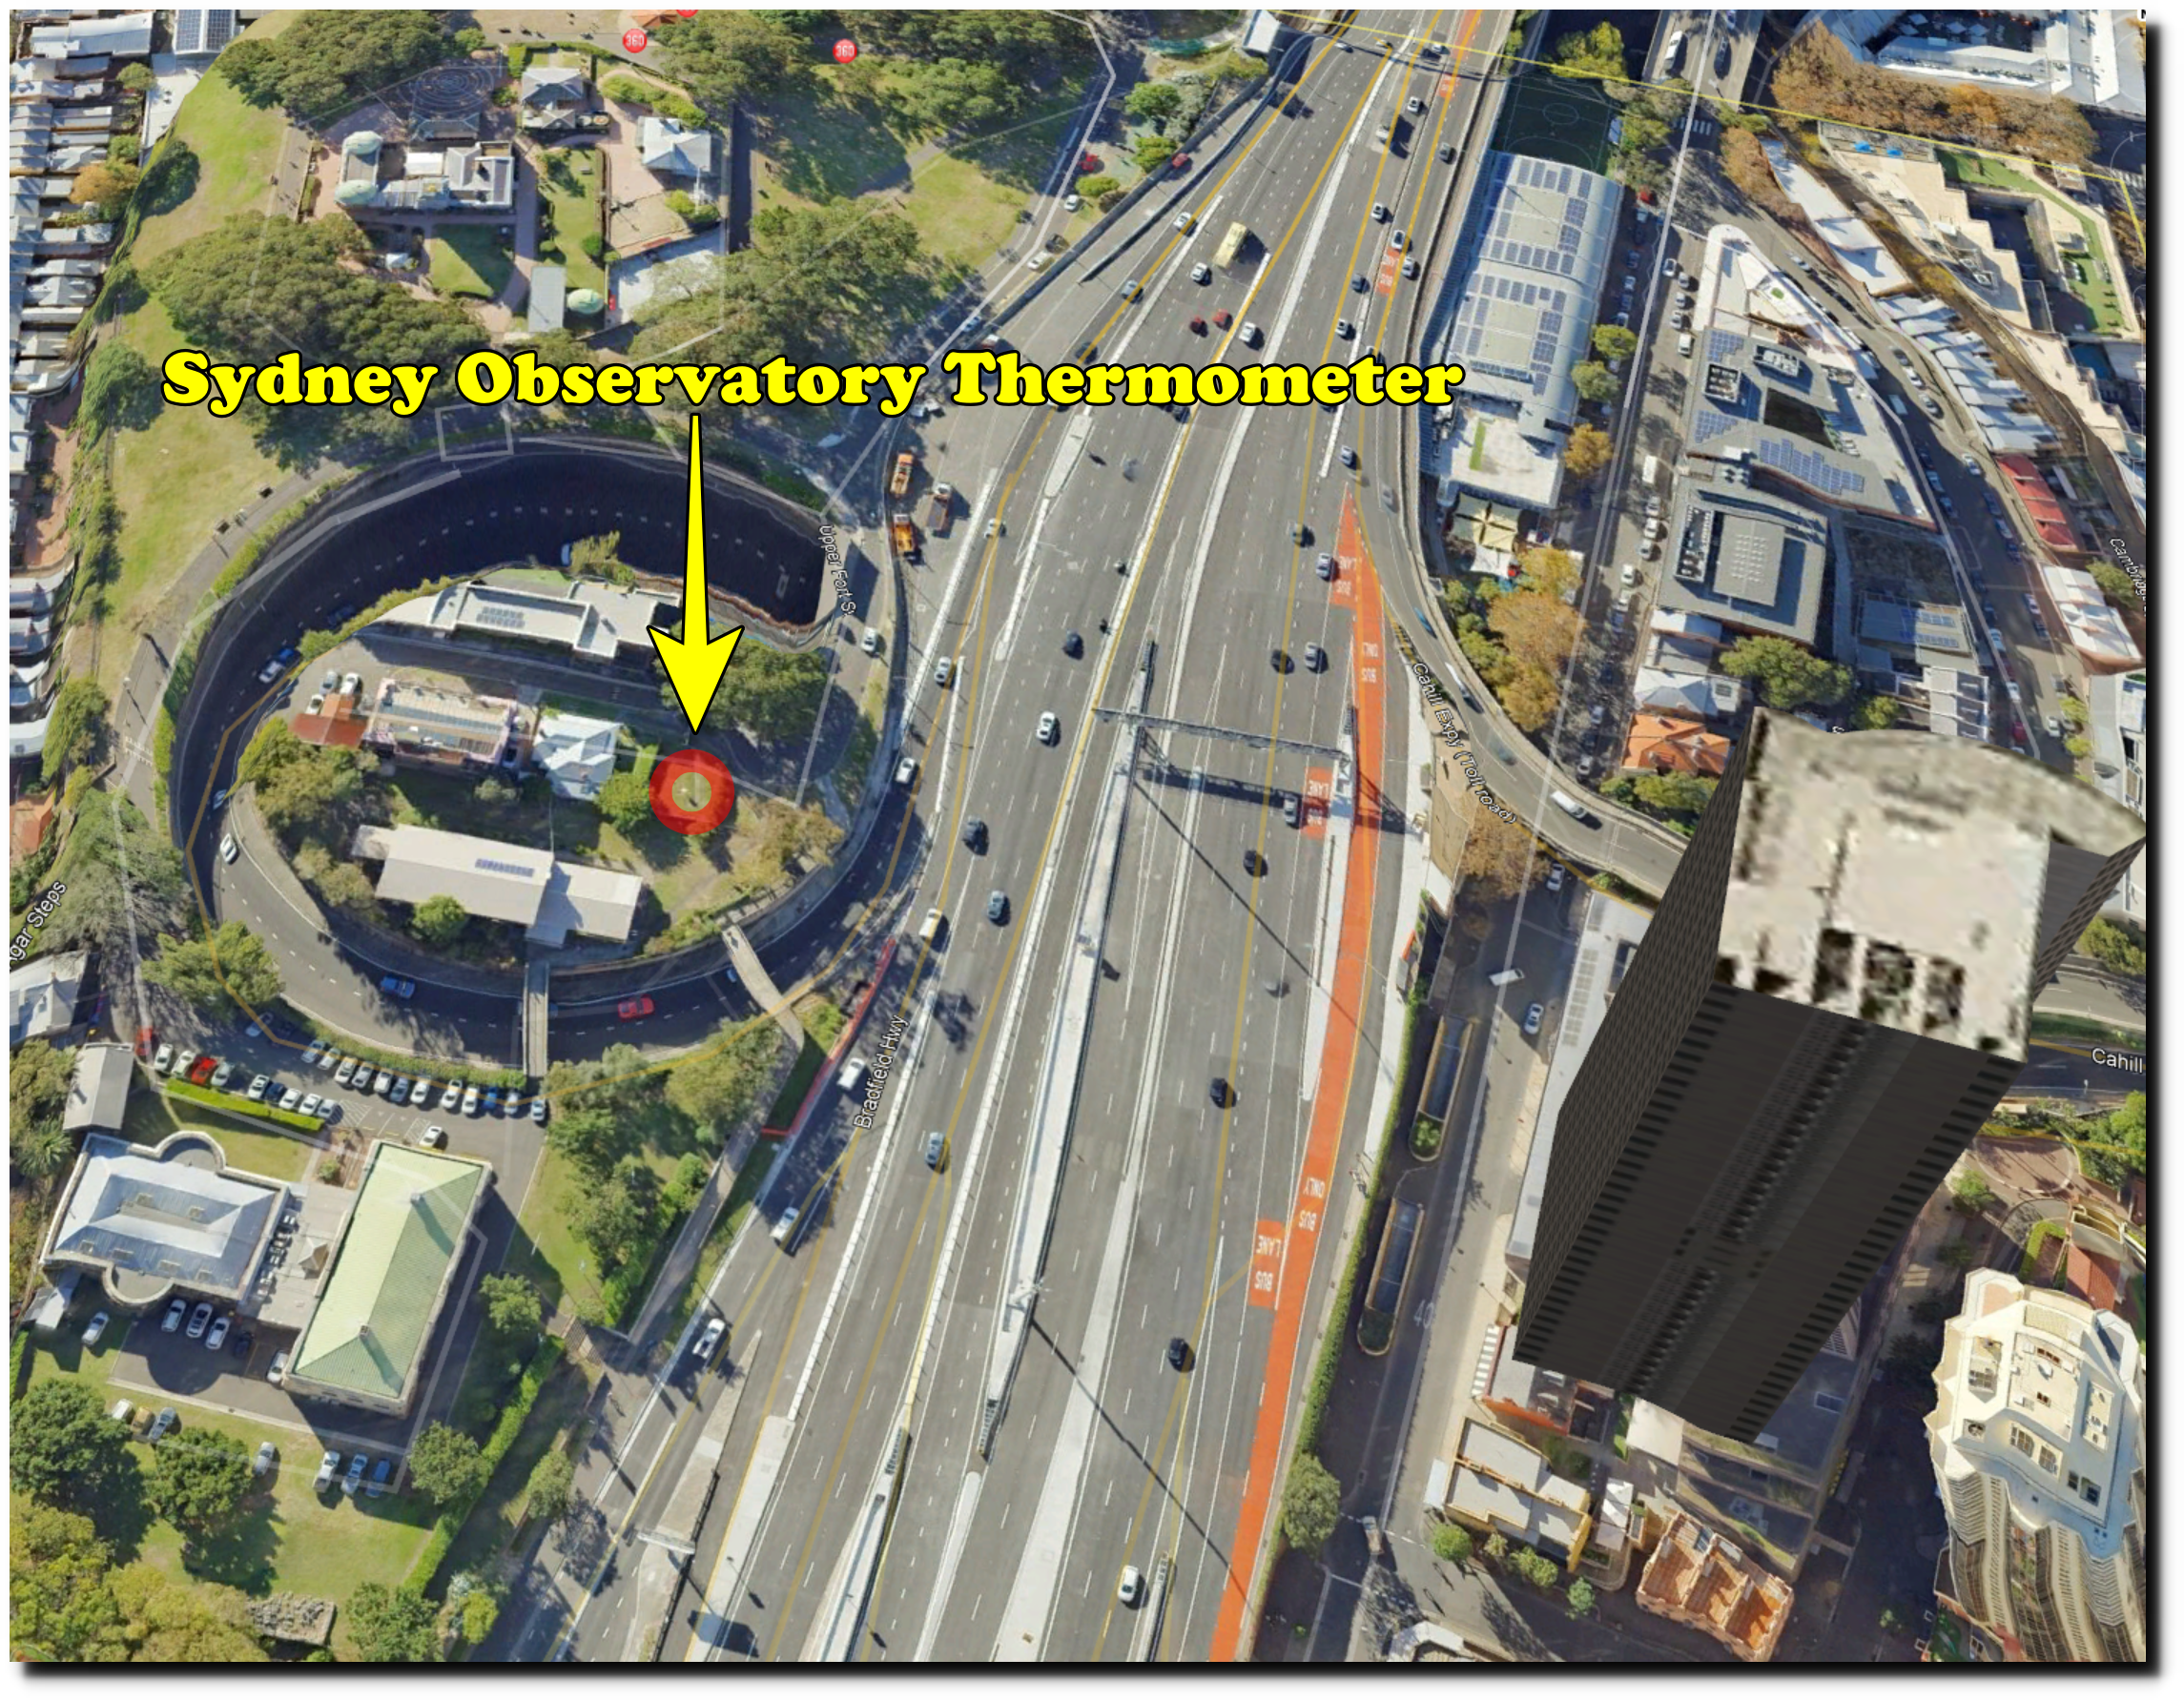
BOM prefers thermometers like the one at Sydney, located adjacent to 22 lanes of asphalt, and reflecting afternoon sun off tall buildings on to the thermometer housing.
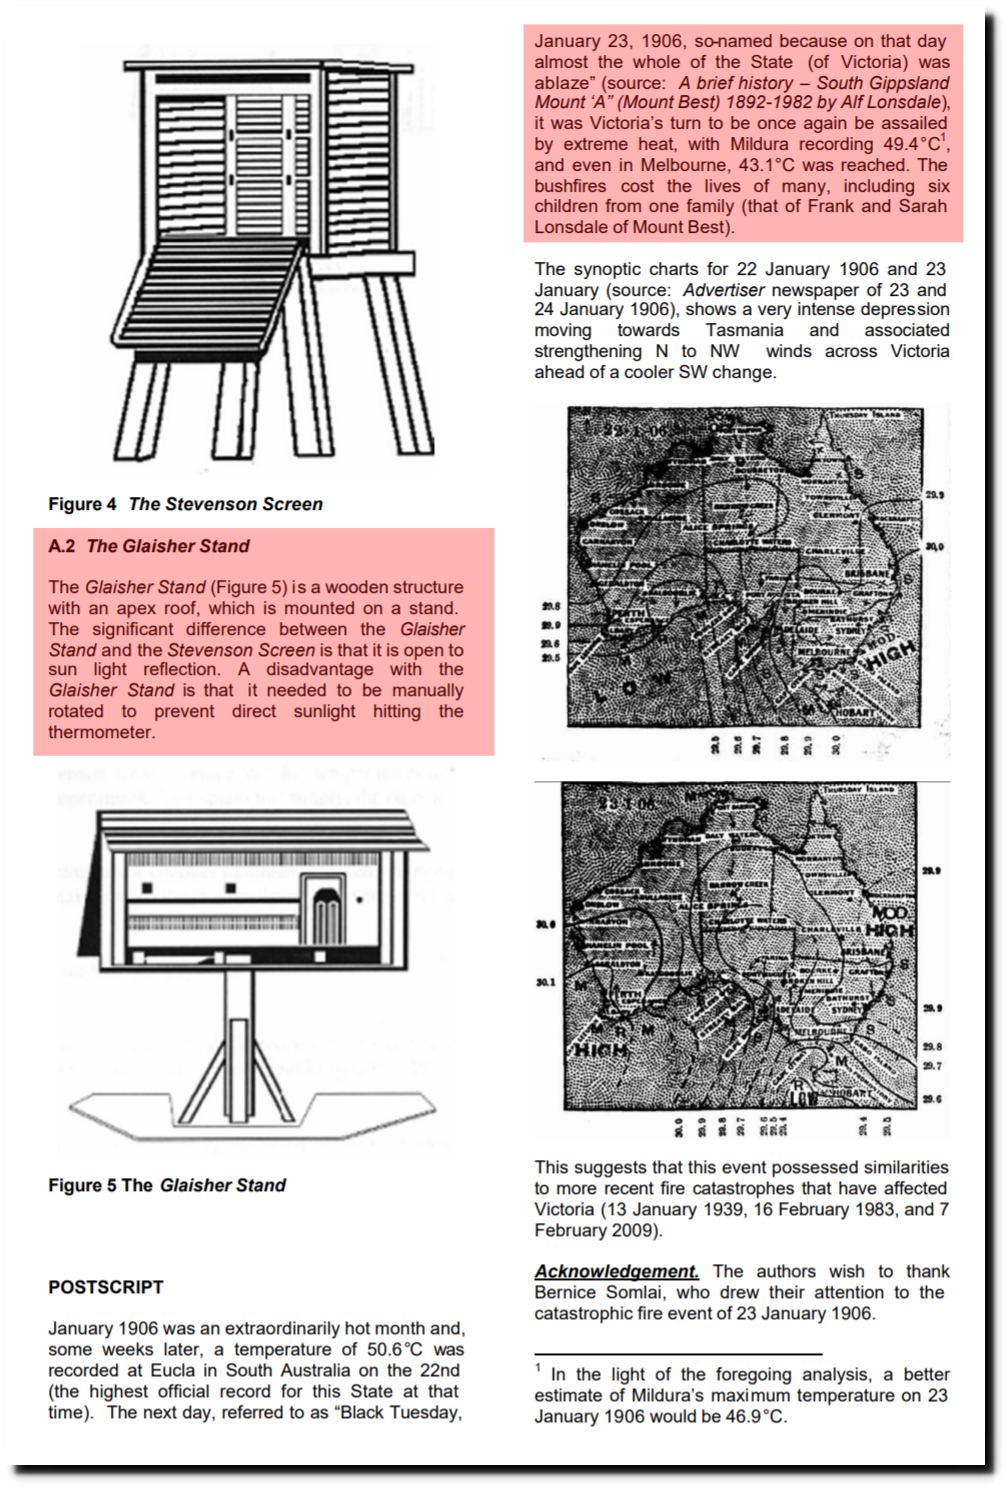
They also believe that all the dead animals in Victoria in 1906 were the victims of badly placed thermometers.
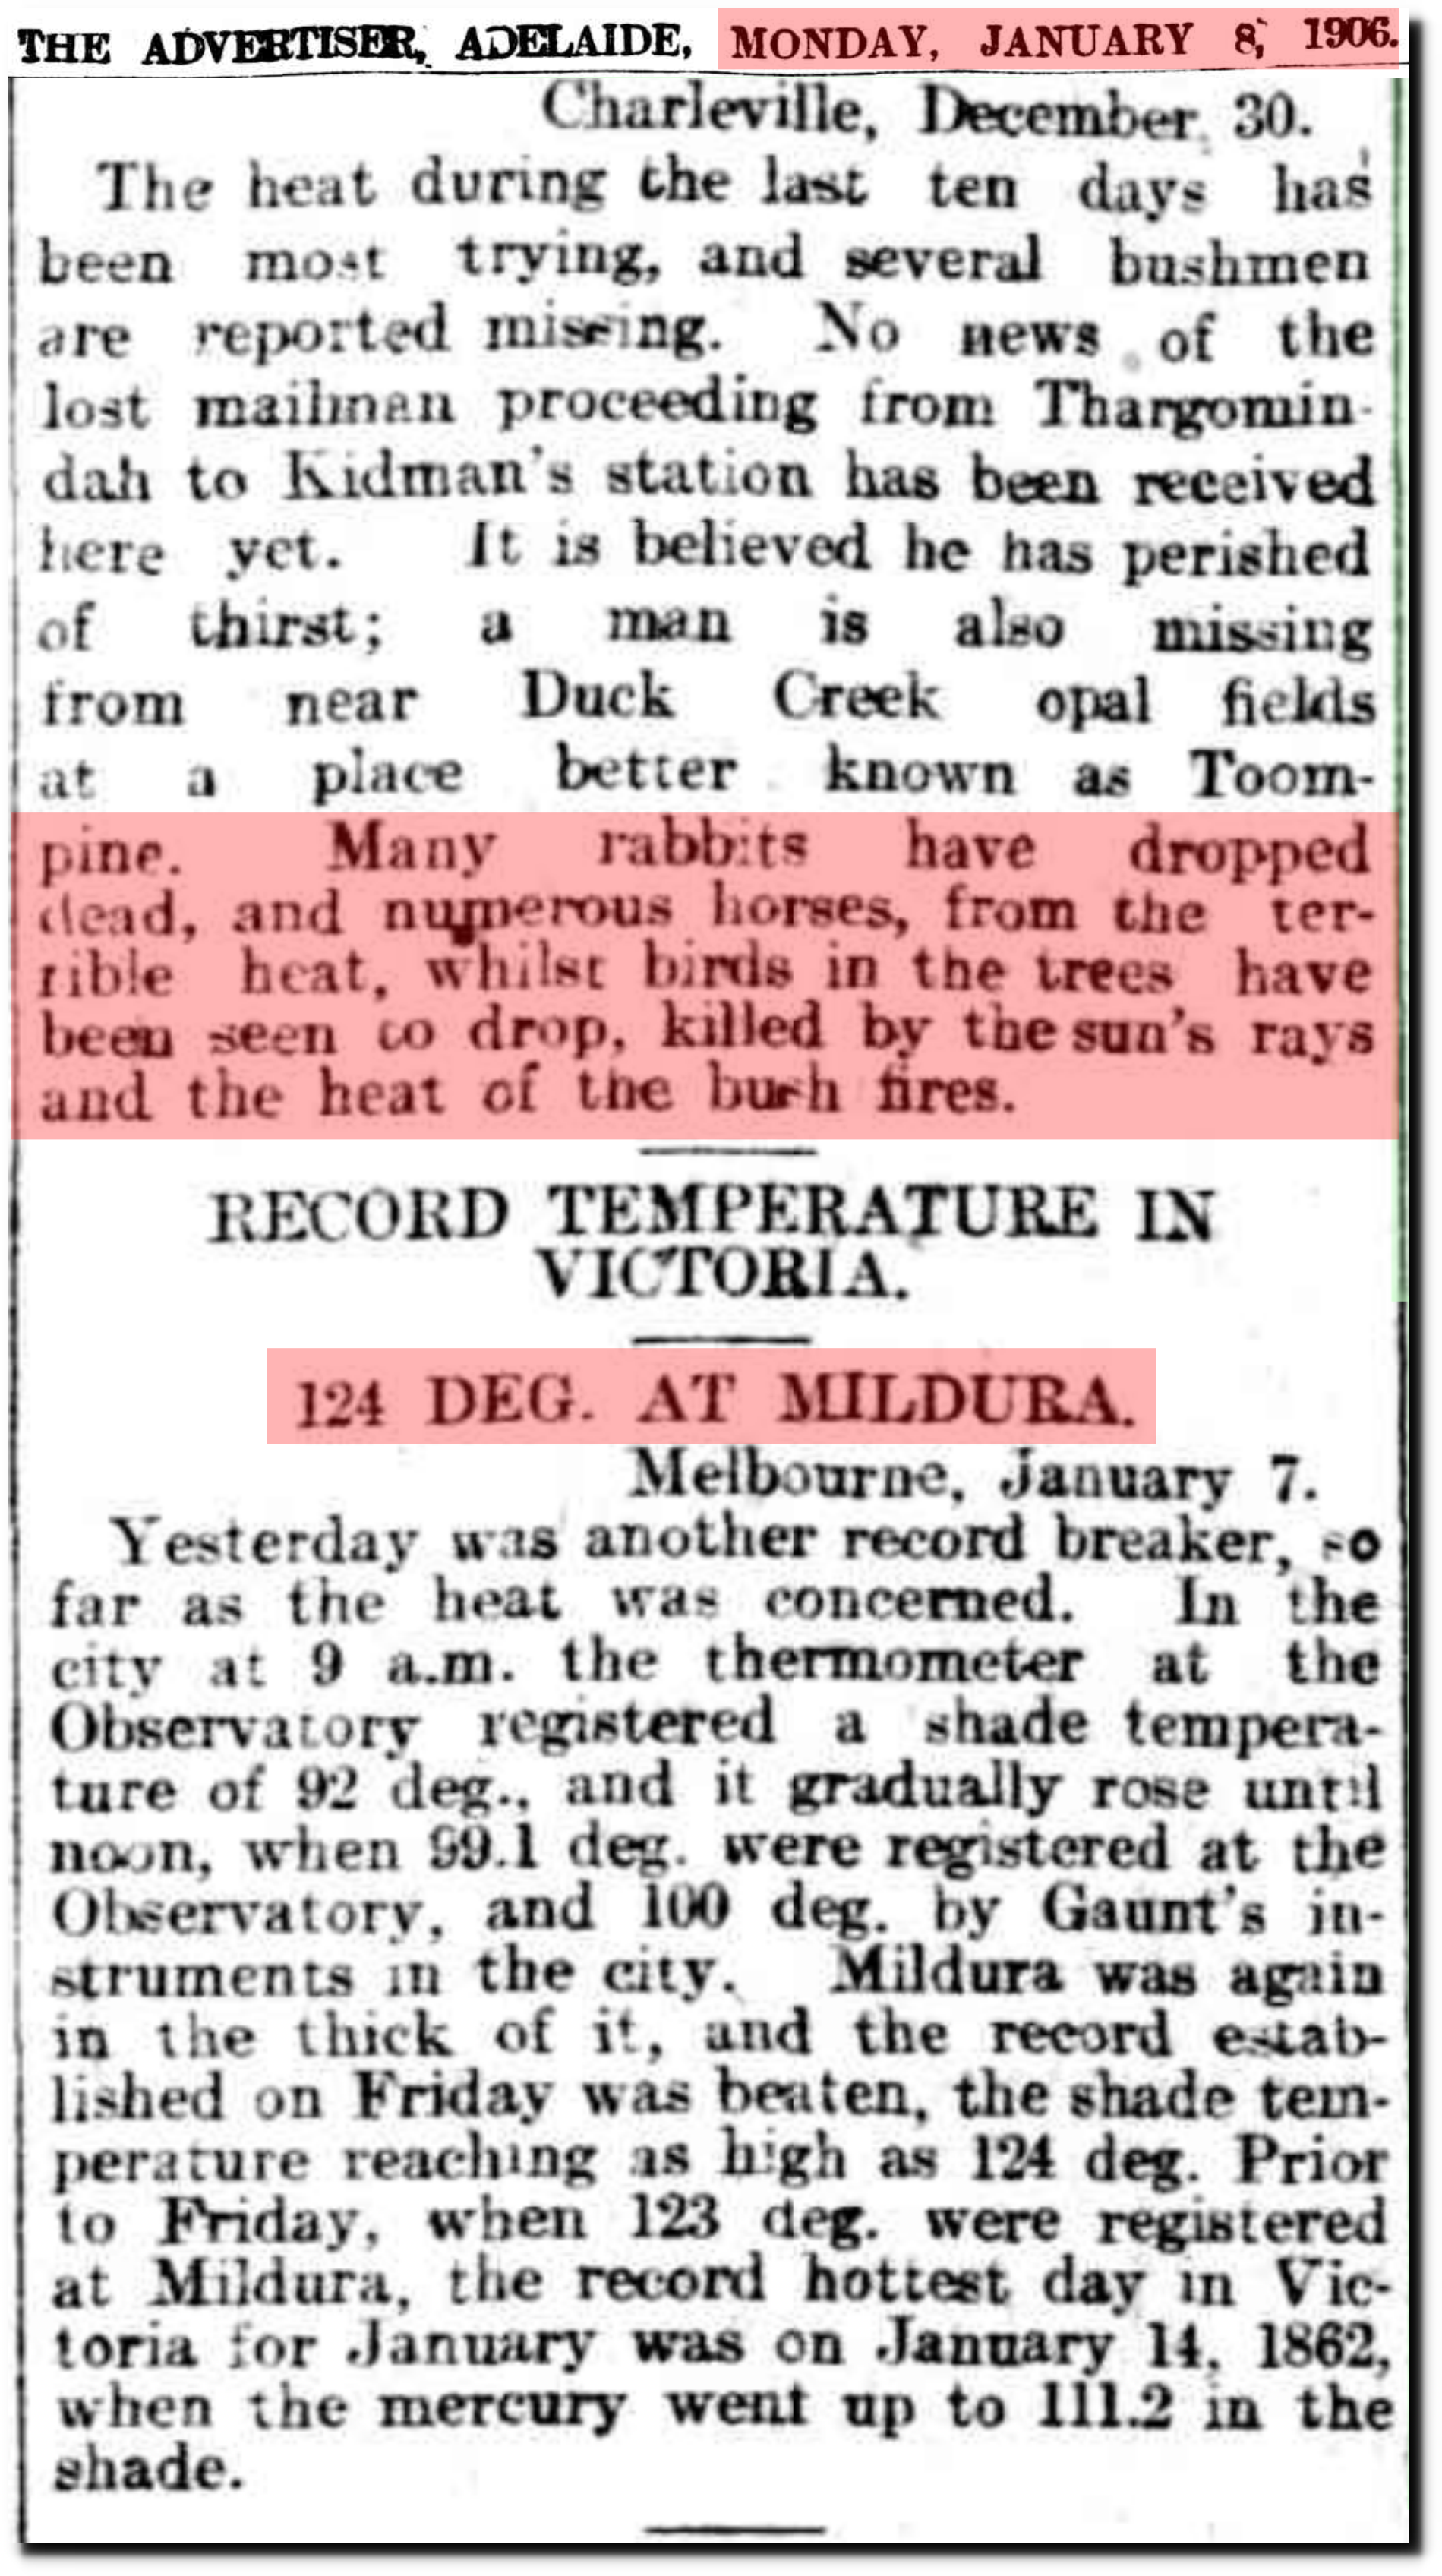
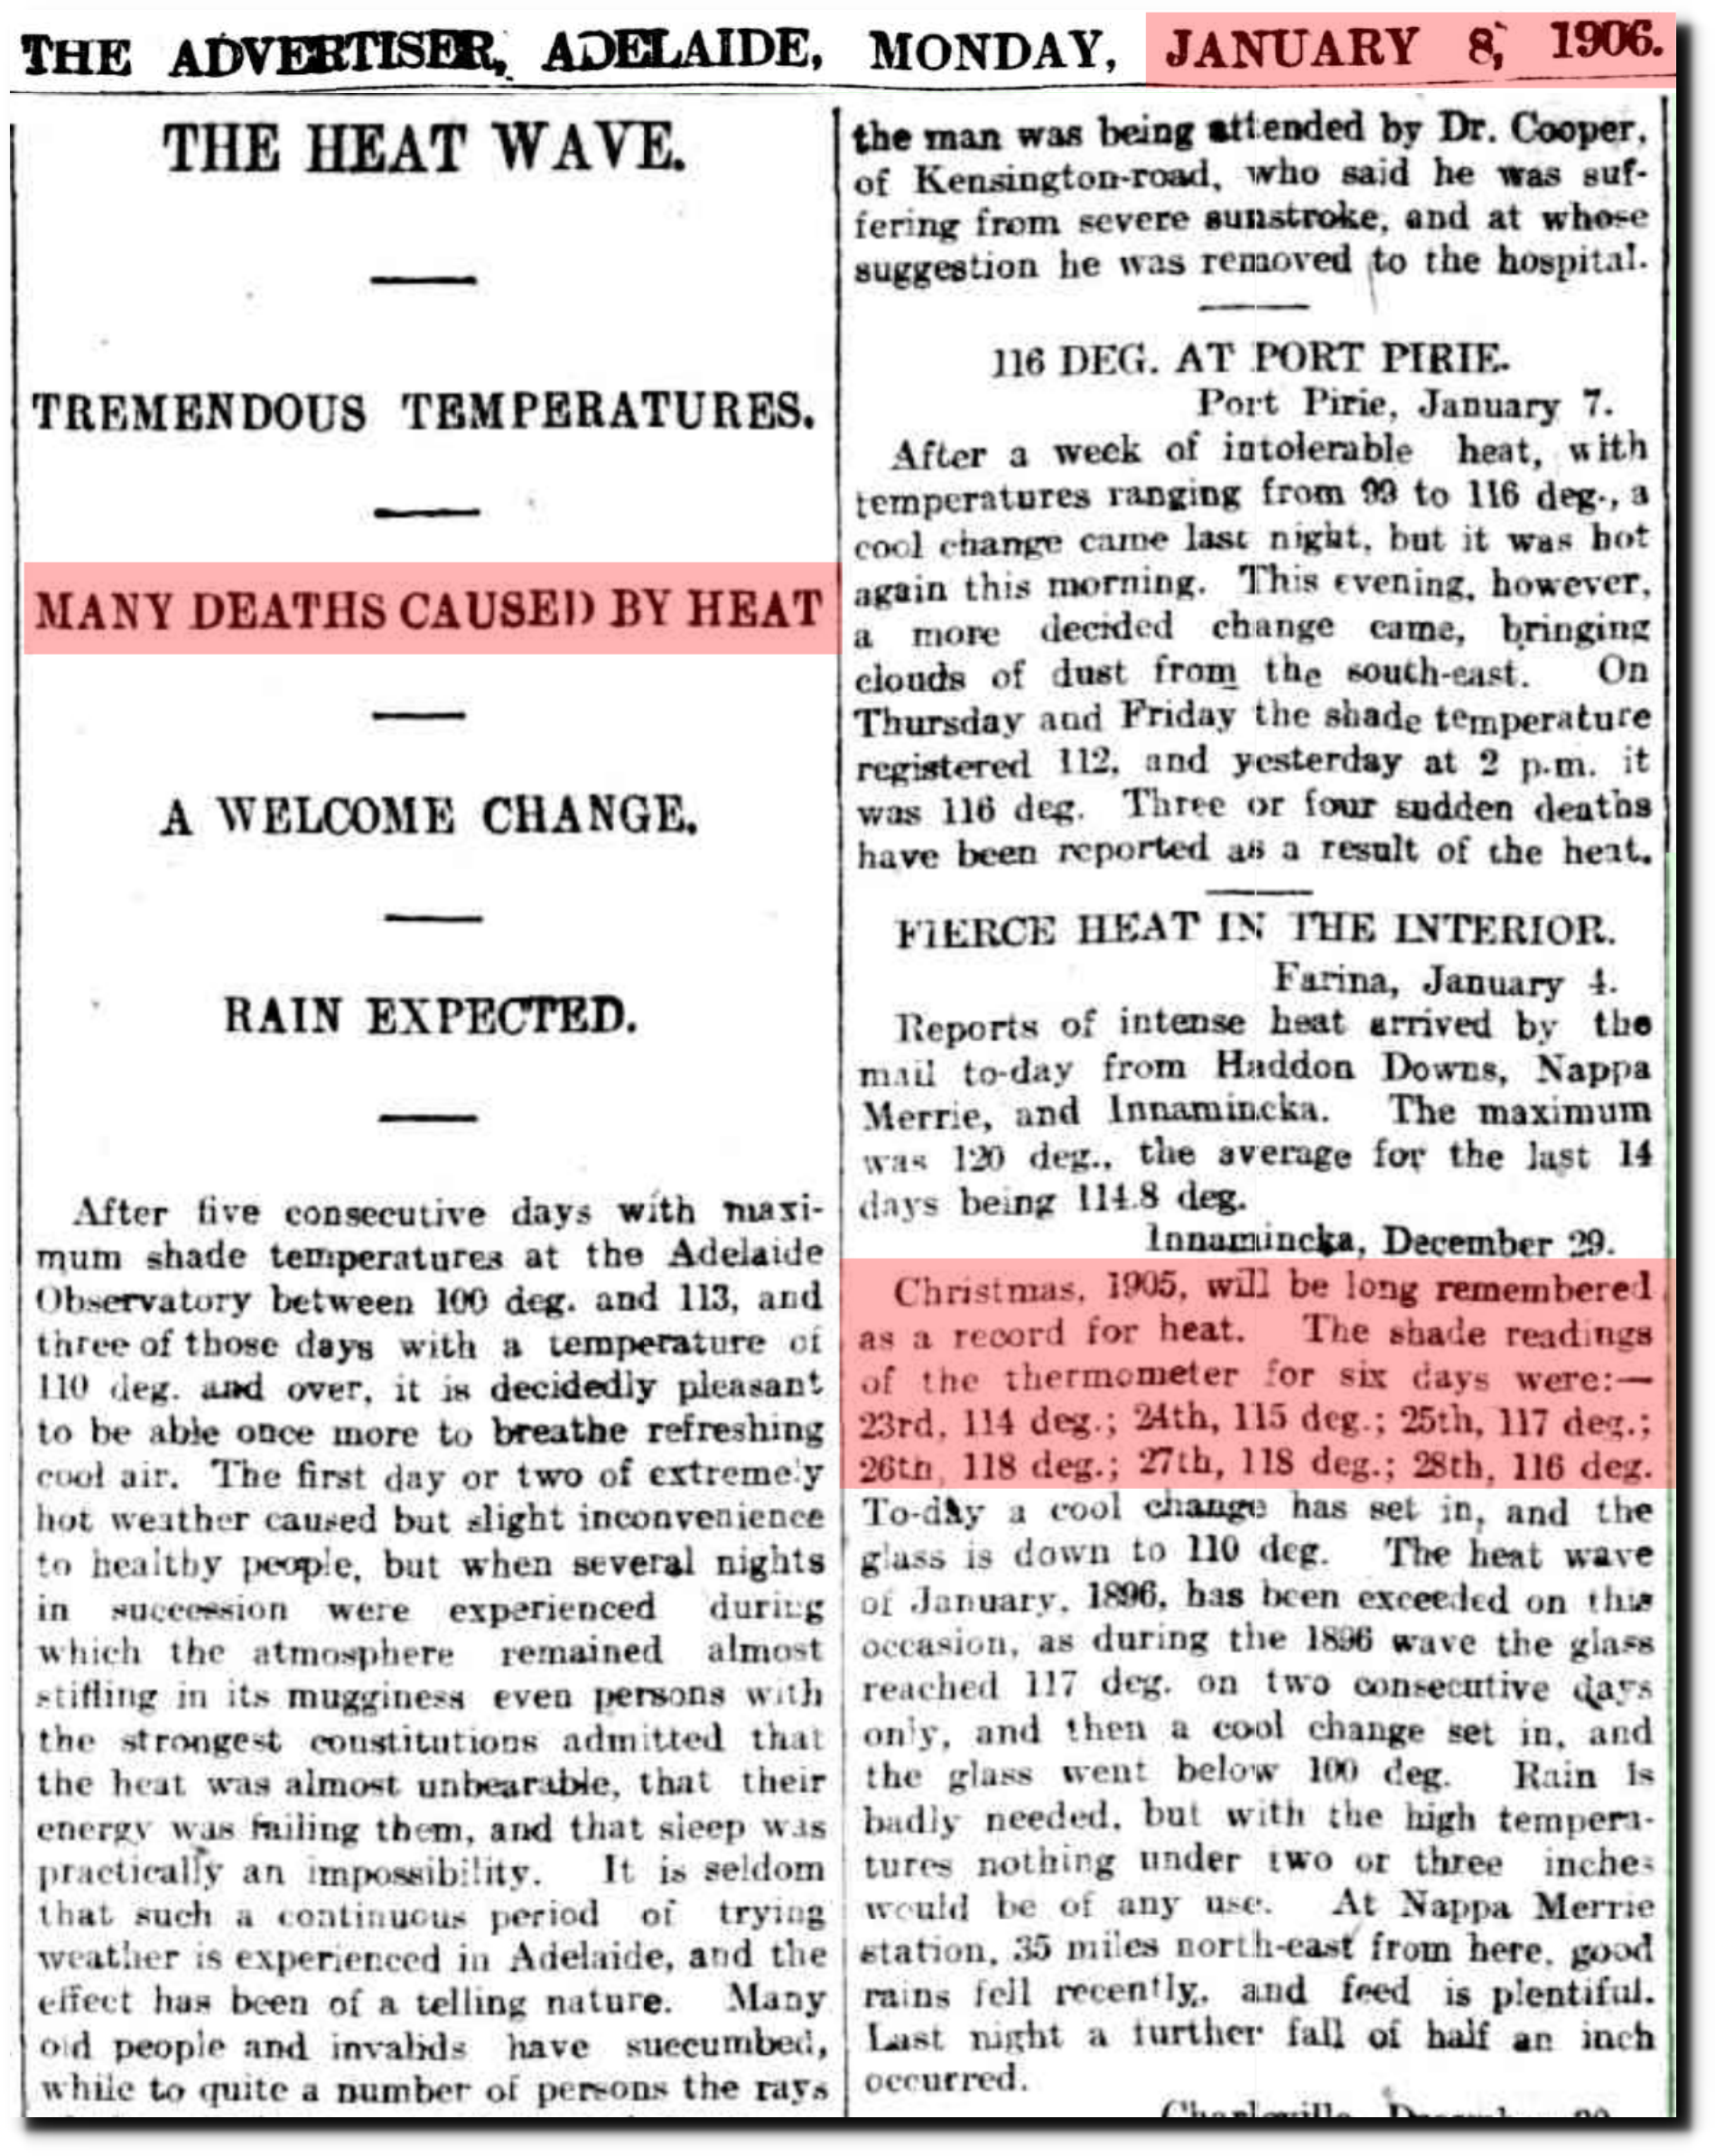
08 Jan 1906 – THE HEAT WAVE. – Trove
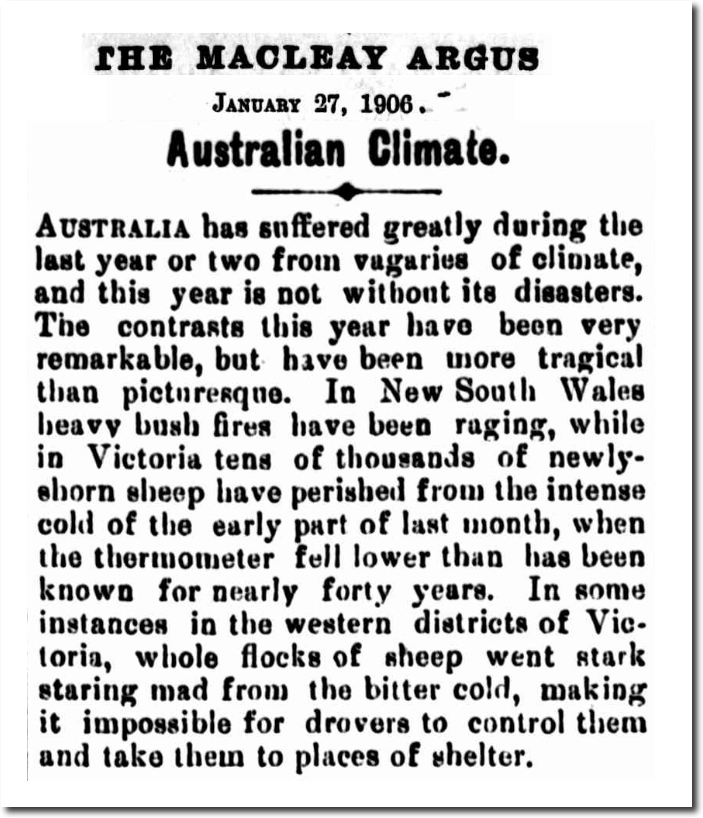
27 Jan 1906 – Australian Climate. – Trove

08 Jan 1906 – TOPICS OF THE DAY – Trove
Like in 1878, the January 1906 heatwave was global – with a very mild winter in Minnesota.

23 Mar 1906, Page 5 – The Minneapolis Journal at Newspapers.com
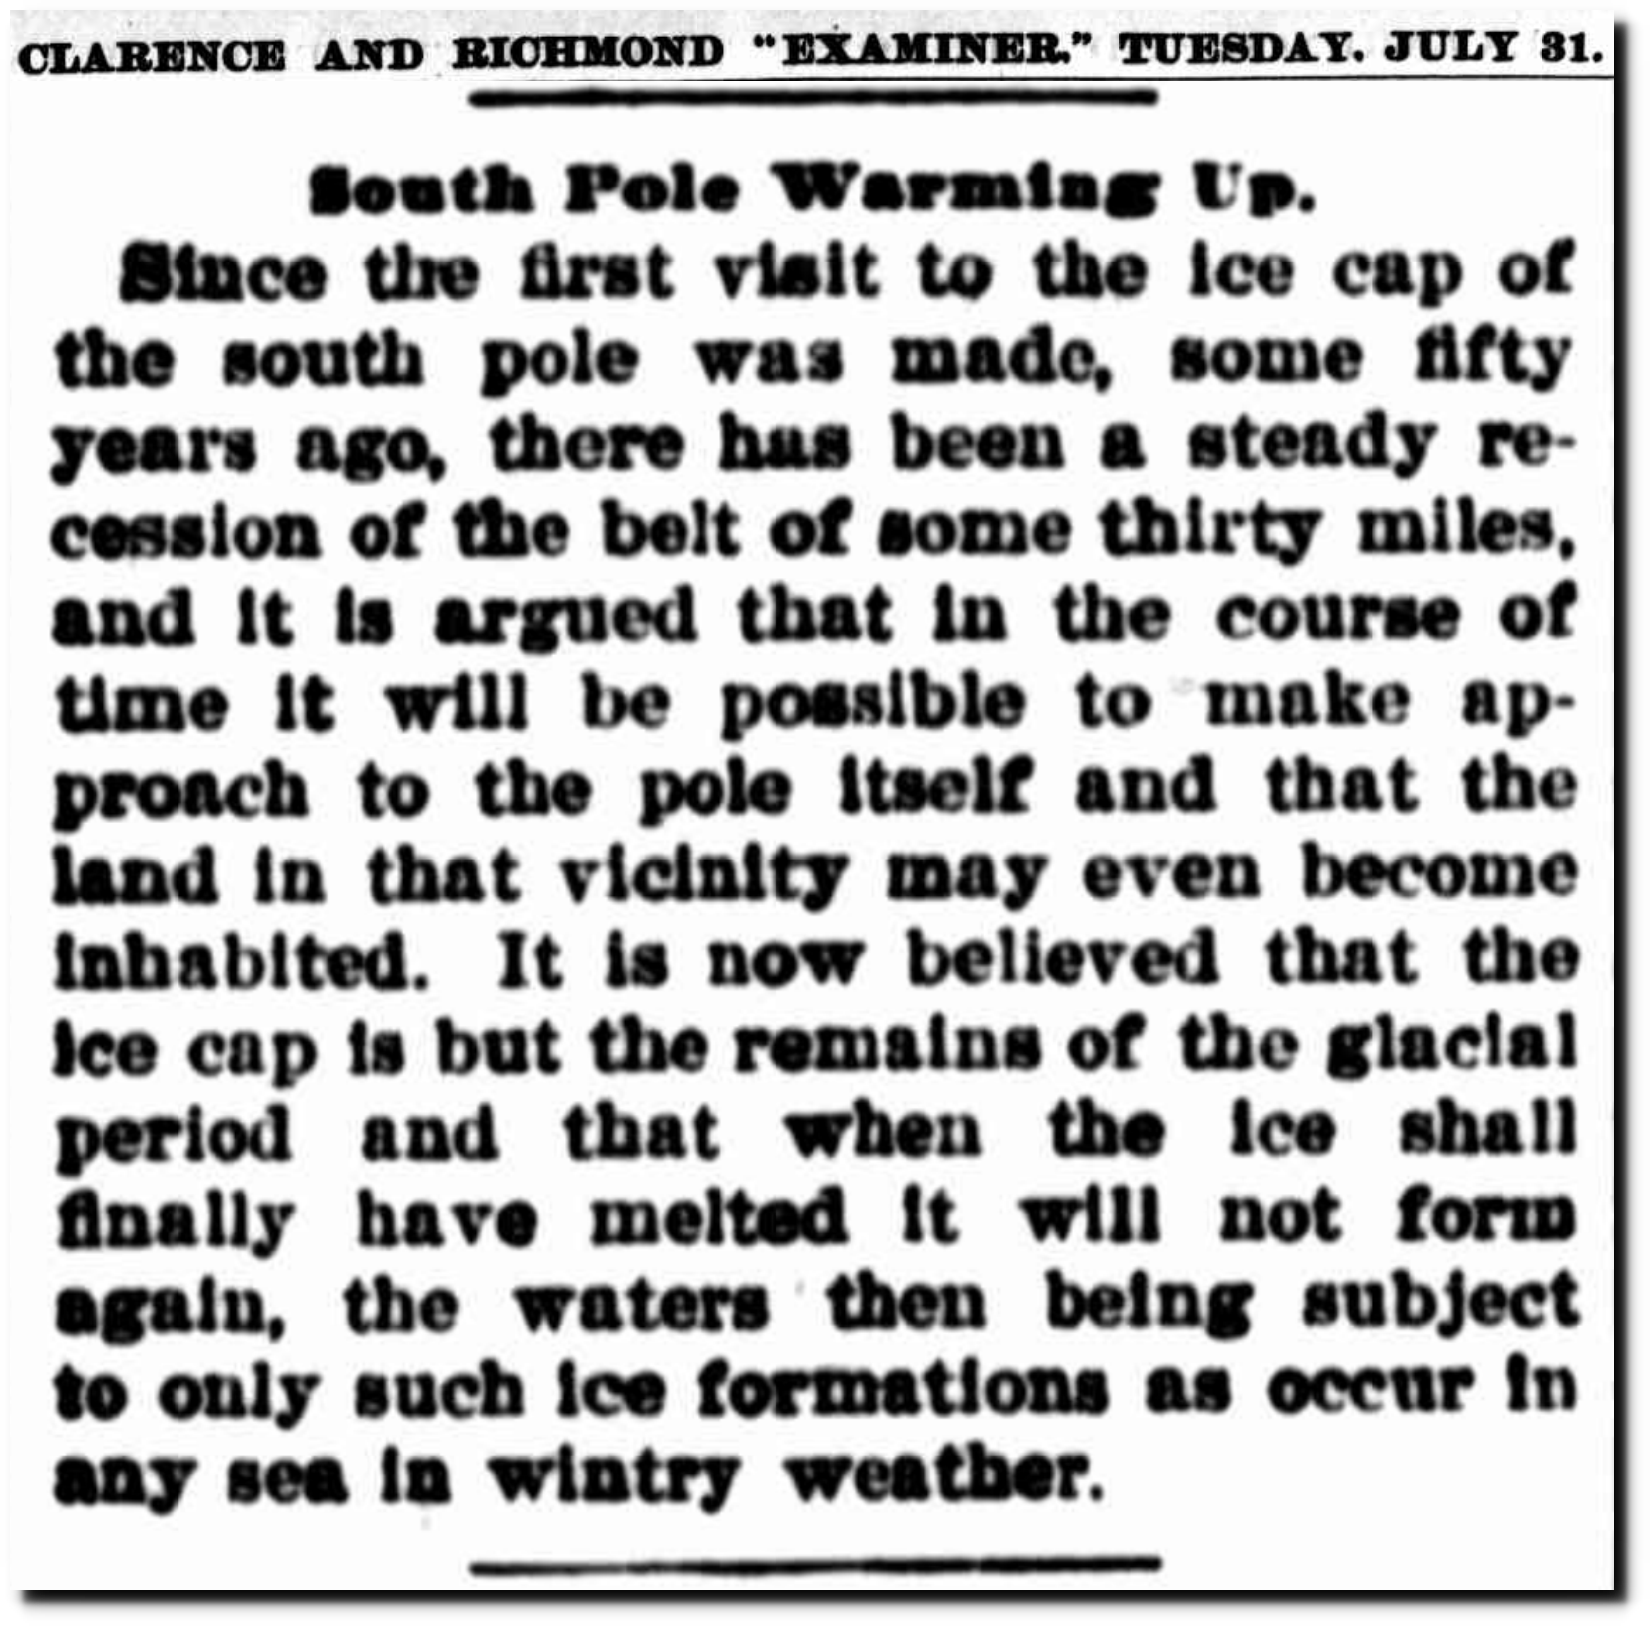
31 Jul 1906 – South Pole Warming Up
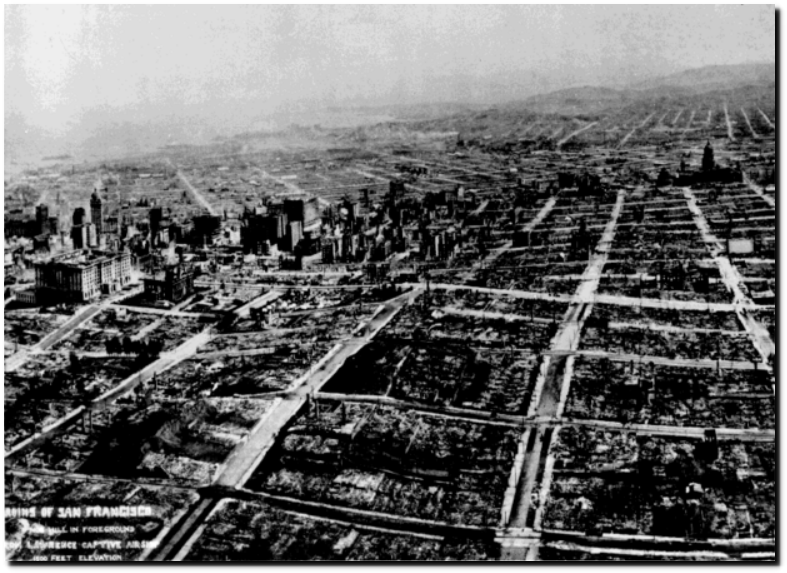
San Francisco was destroyed by earthquake and fire a few weeks later.
1934 brought a global heatwave and drought.
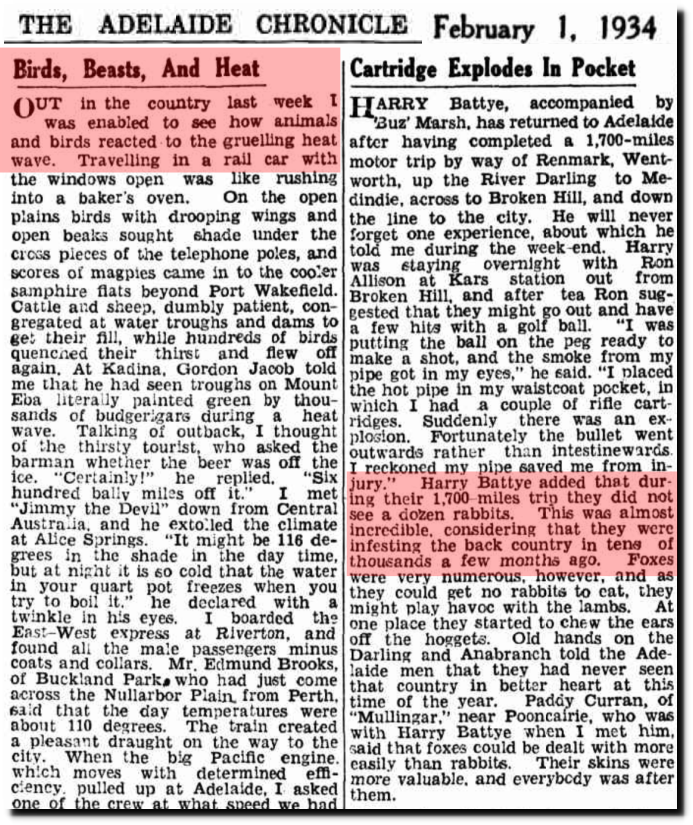
01 Feb 1934 – Out among the People – Trove
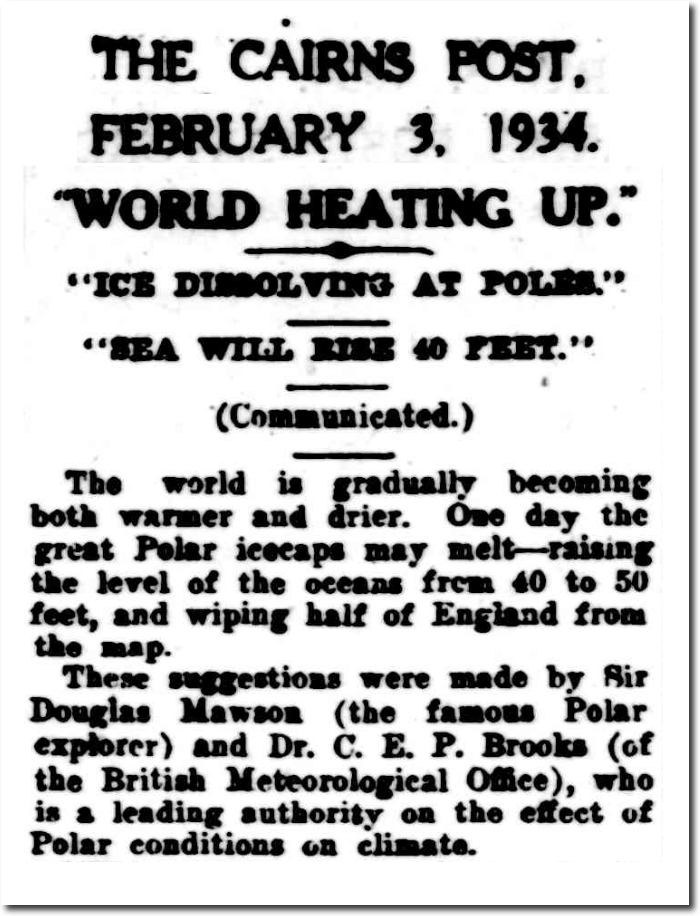
03 Feb 1934 – “WORLD HEATING UP.” – Trove

18 Feb 1934 – Actress Sunburned In Heat Wave At North Pole – Trove
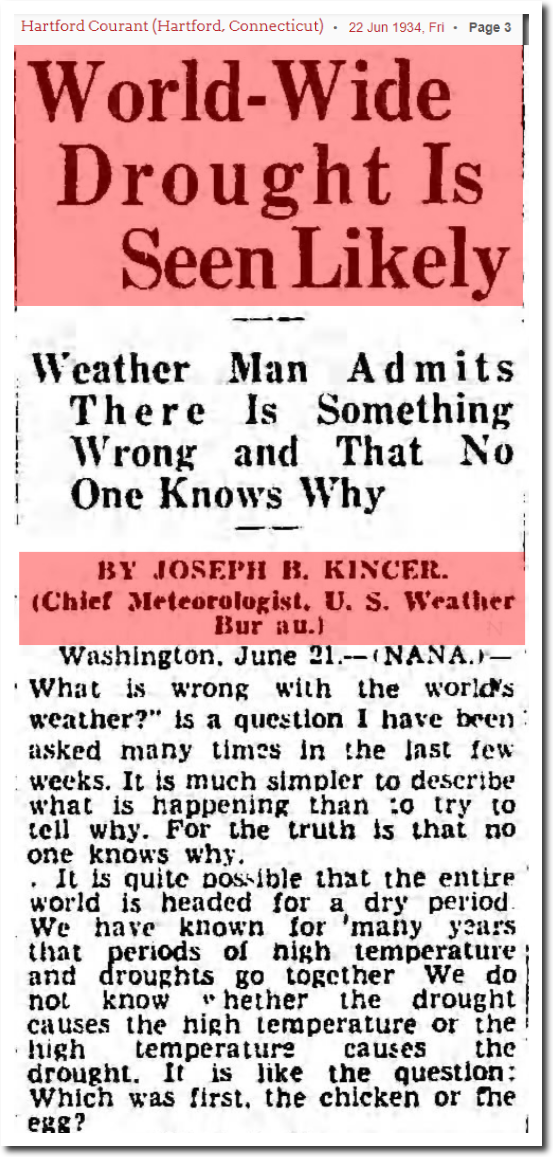
22 Jun 1934, Page 3 – Hartford Courant at Newspapers.com
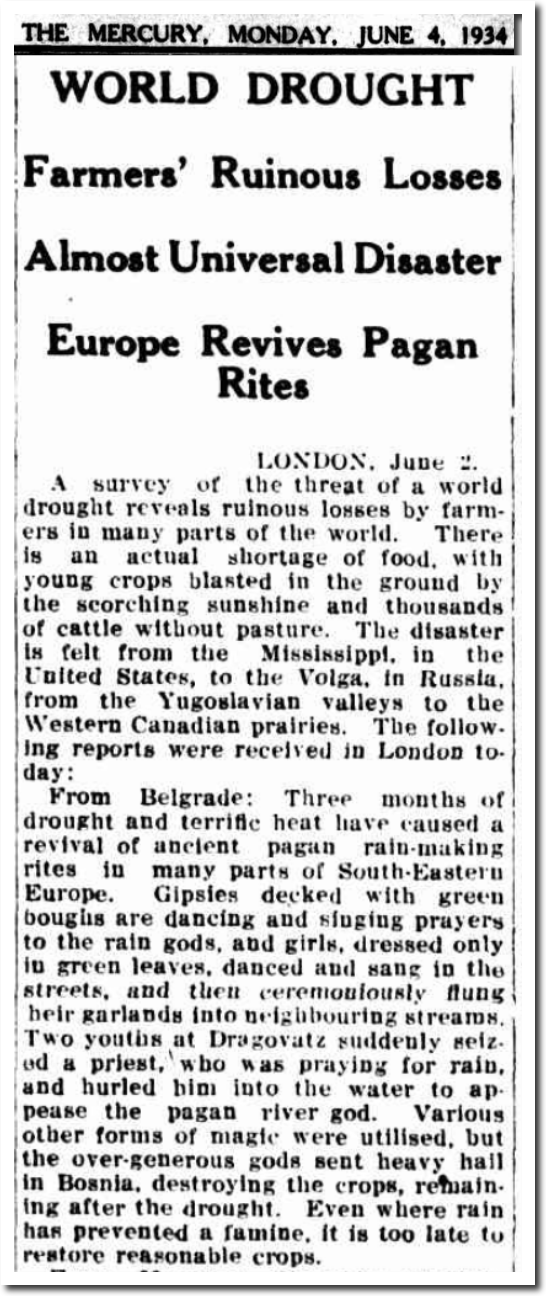
04 Jun 1934 – WORLD DROUGHT – Trove
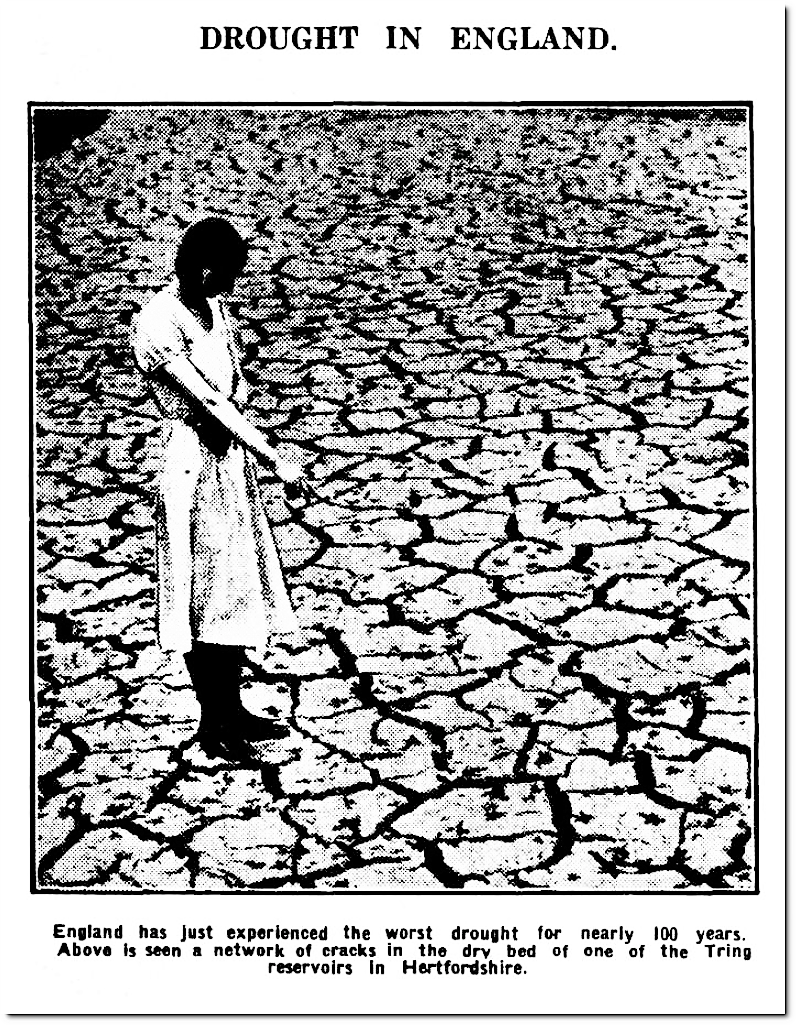
19 Jul 1934 – DROUGHT IN ENGLAND. – Trove
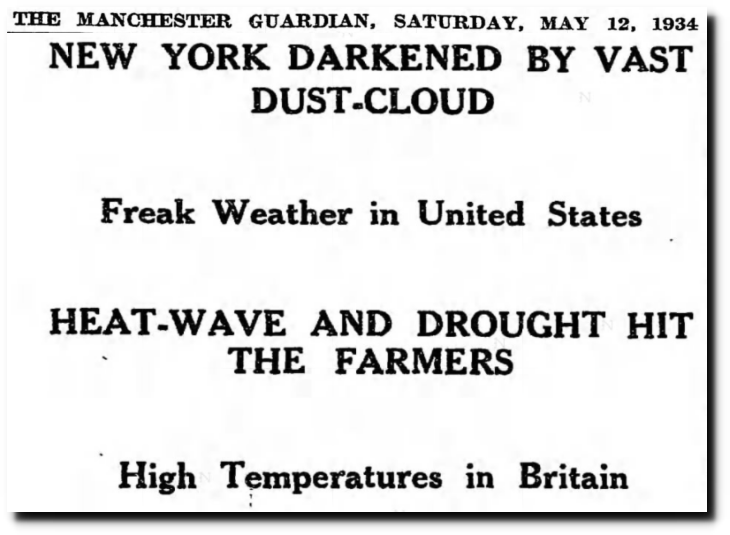
12 May 1934, 13 – The Guardian at Newspapers.com
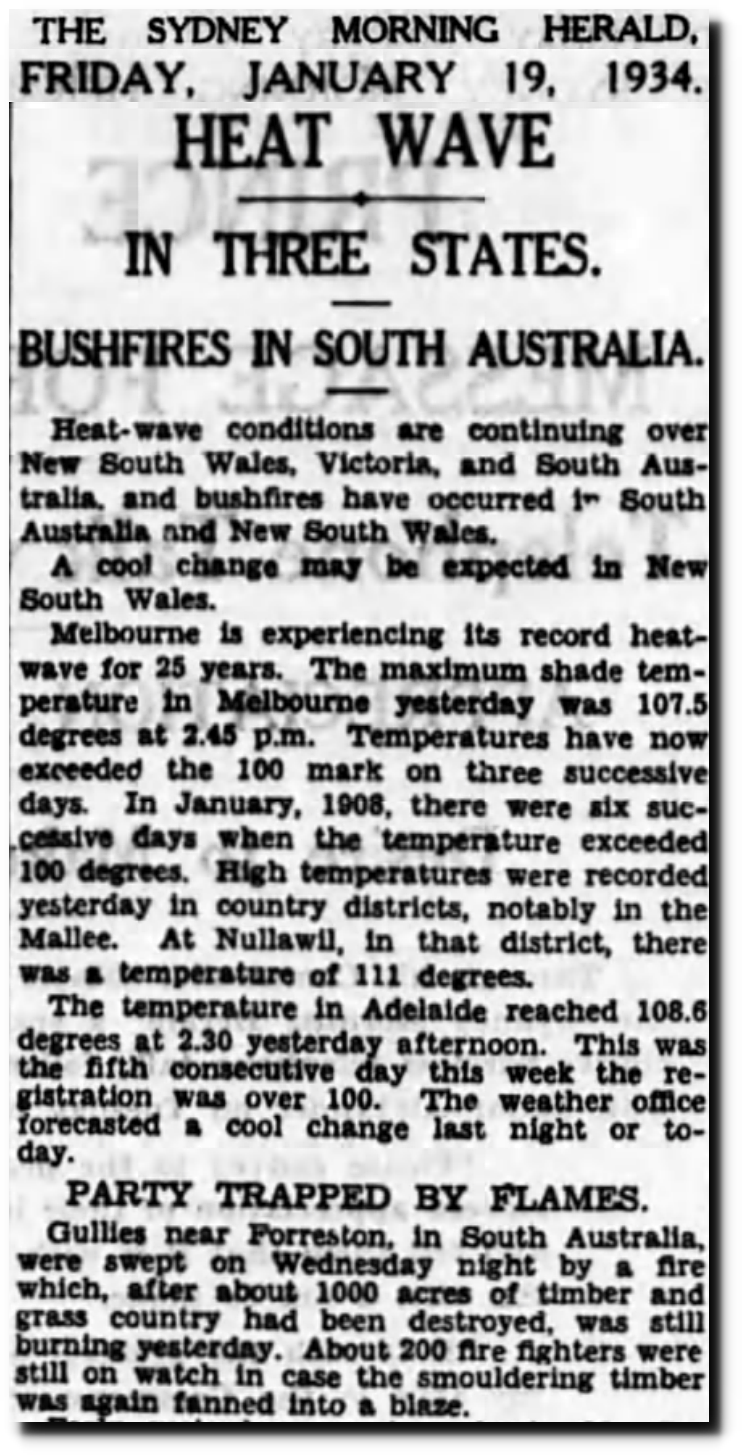
19 Jan 1934, Page 10 – The Sydney Morning Herald at Newspapers.com
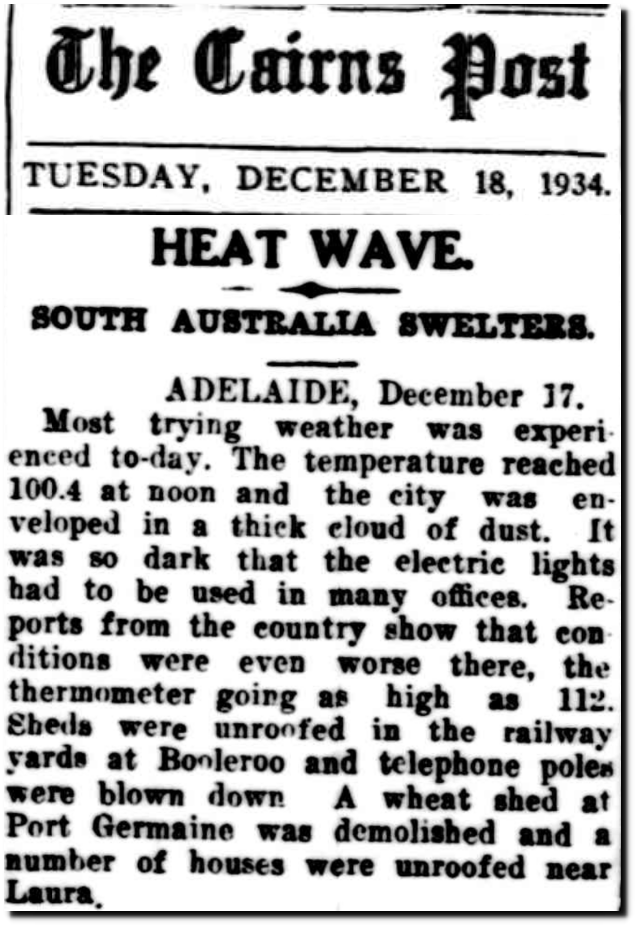
18 Dec 1934 – HEAT WAVE. – Trove
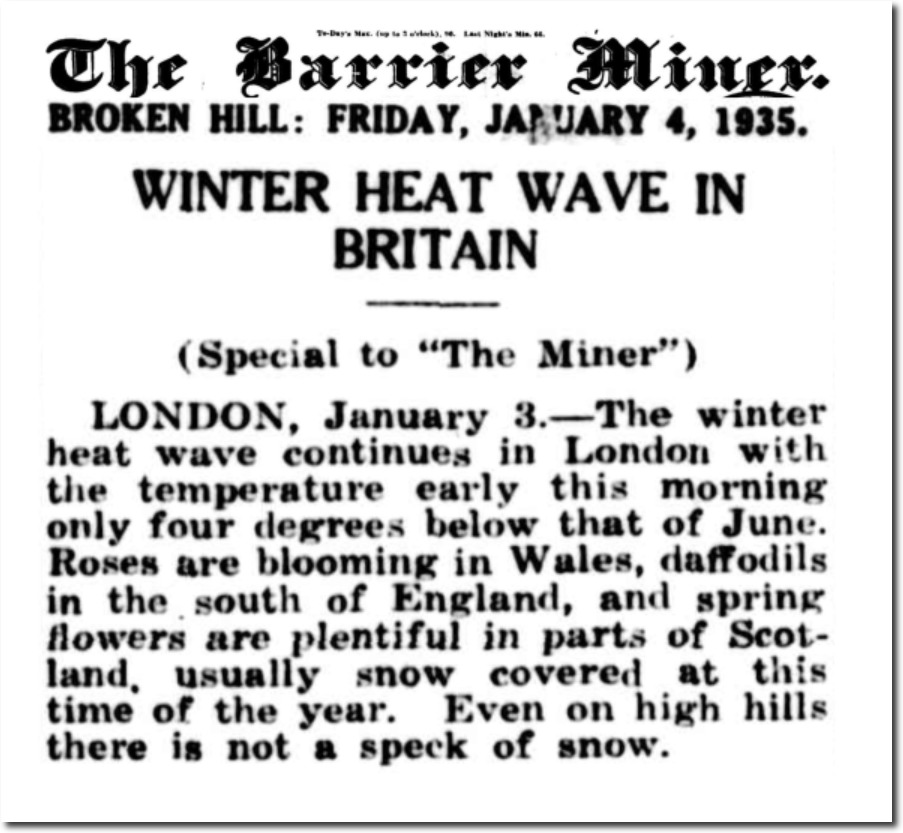
04 Jan 1935 – WINTER HEAT WAVE IN BRITAIN
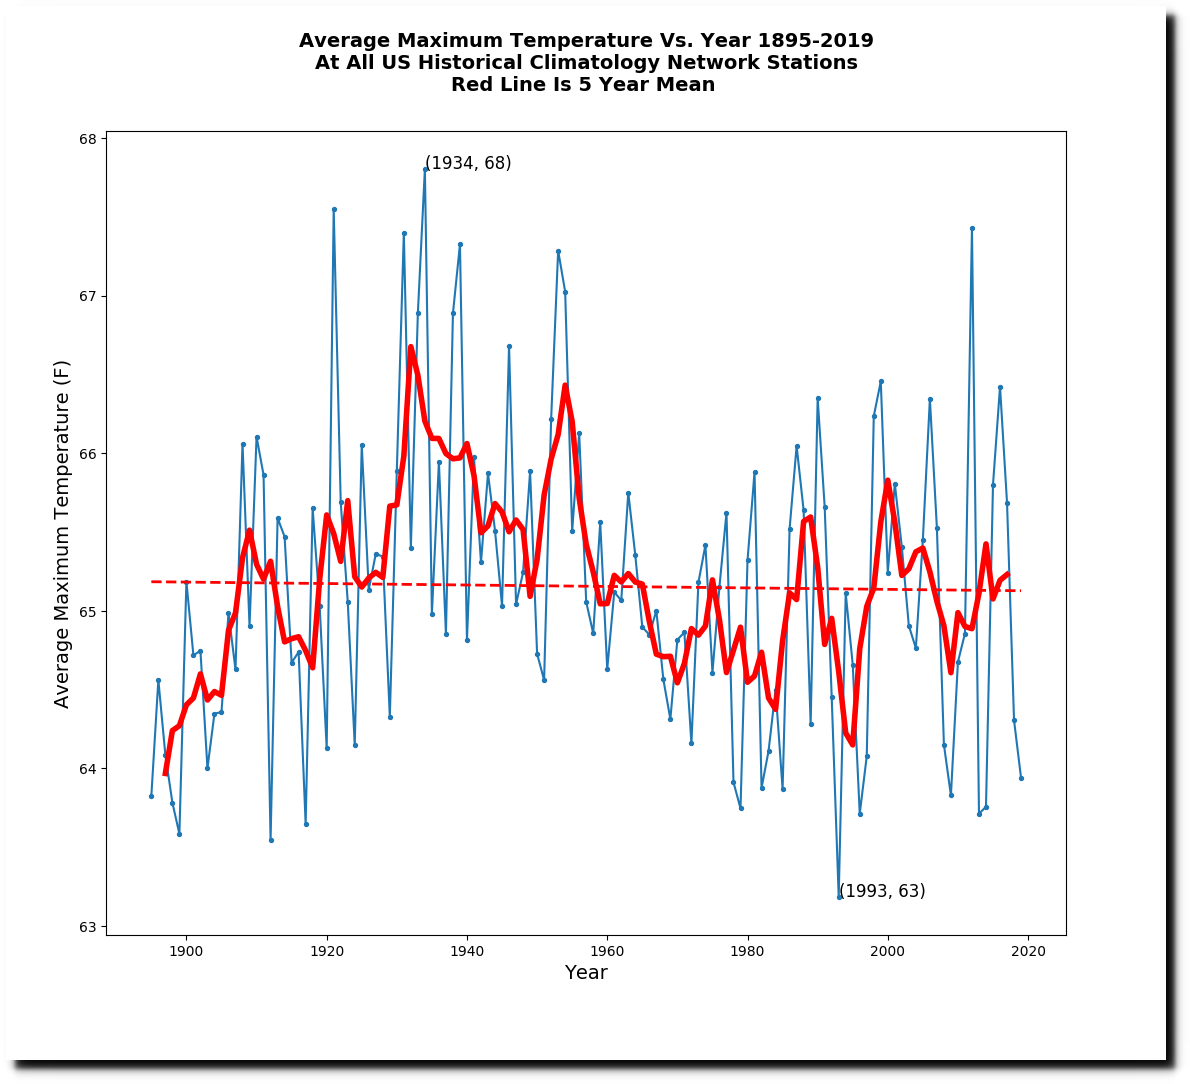
1934 was the hottest year on record in the US, which forced massive data tampering by US government scientists.
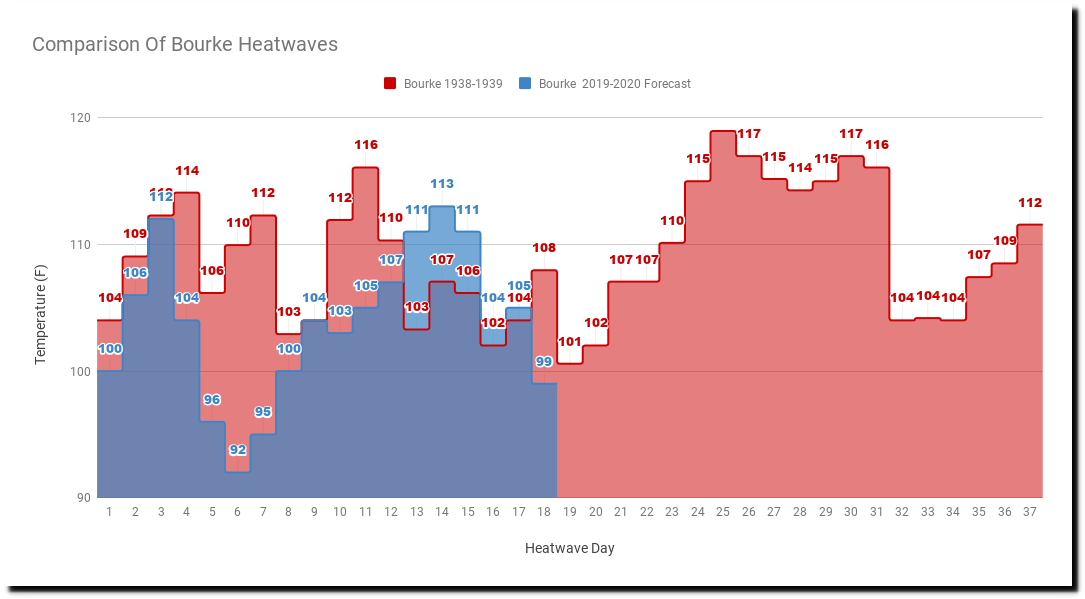
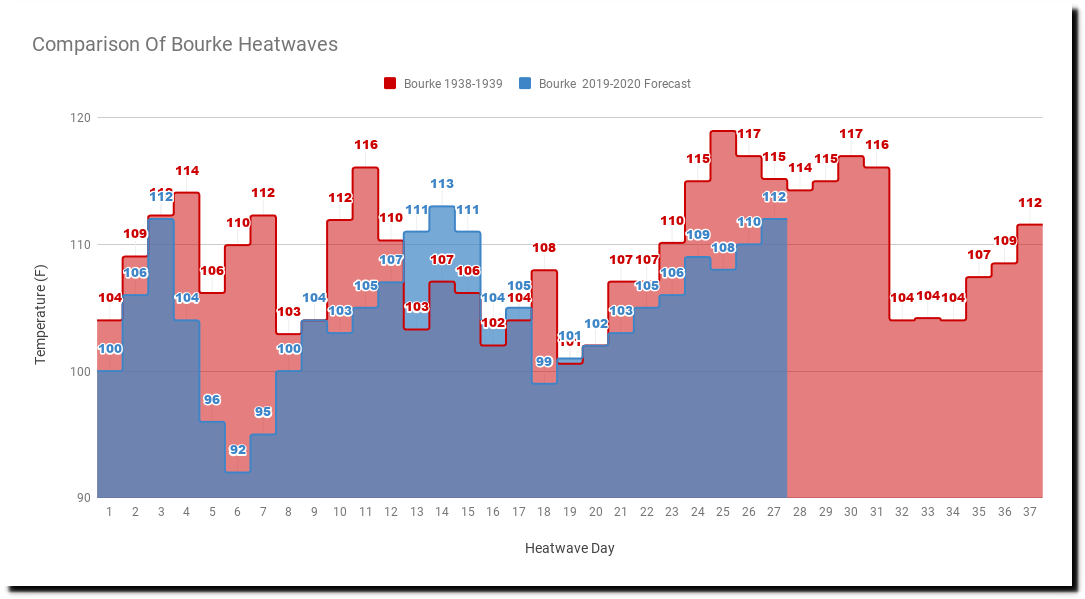
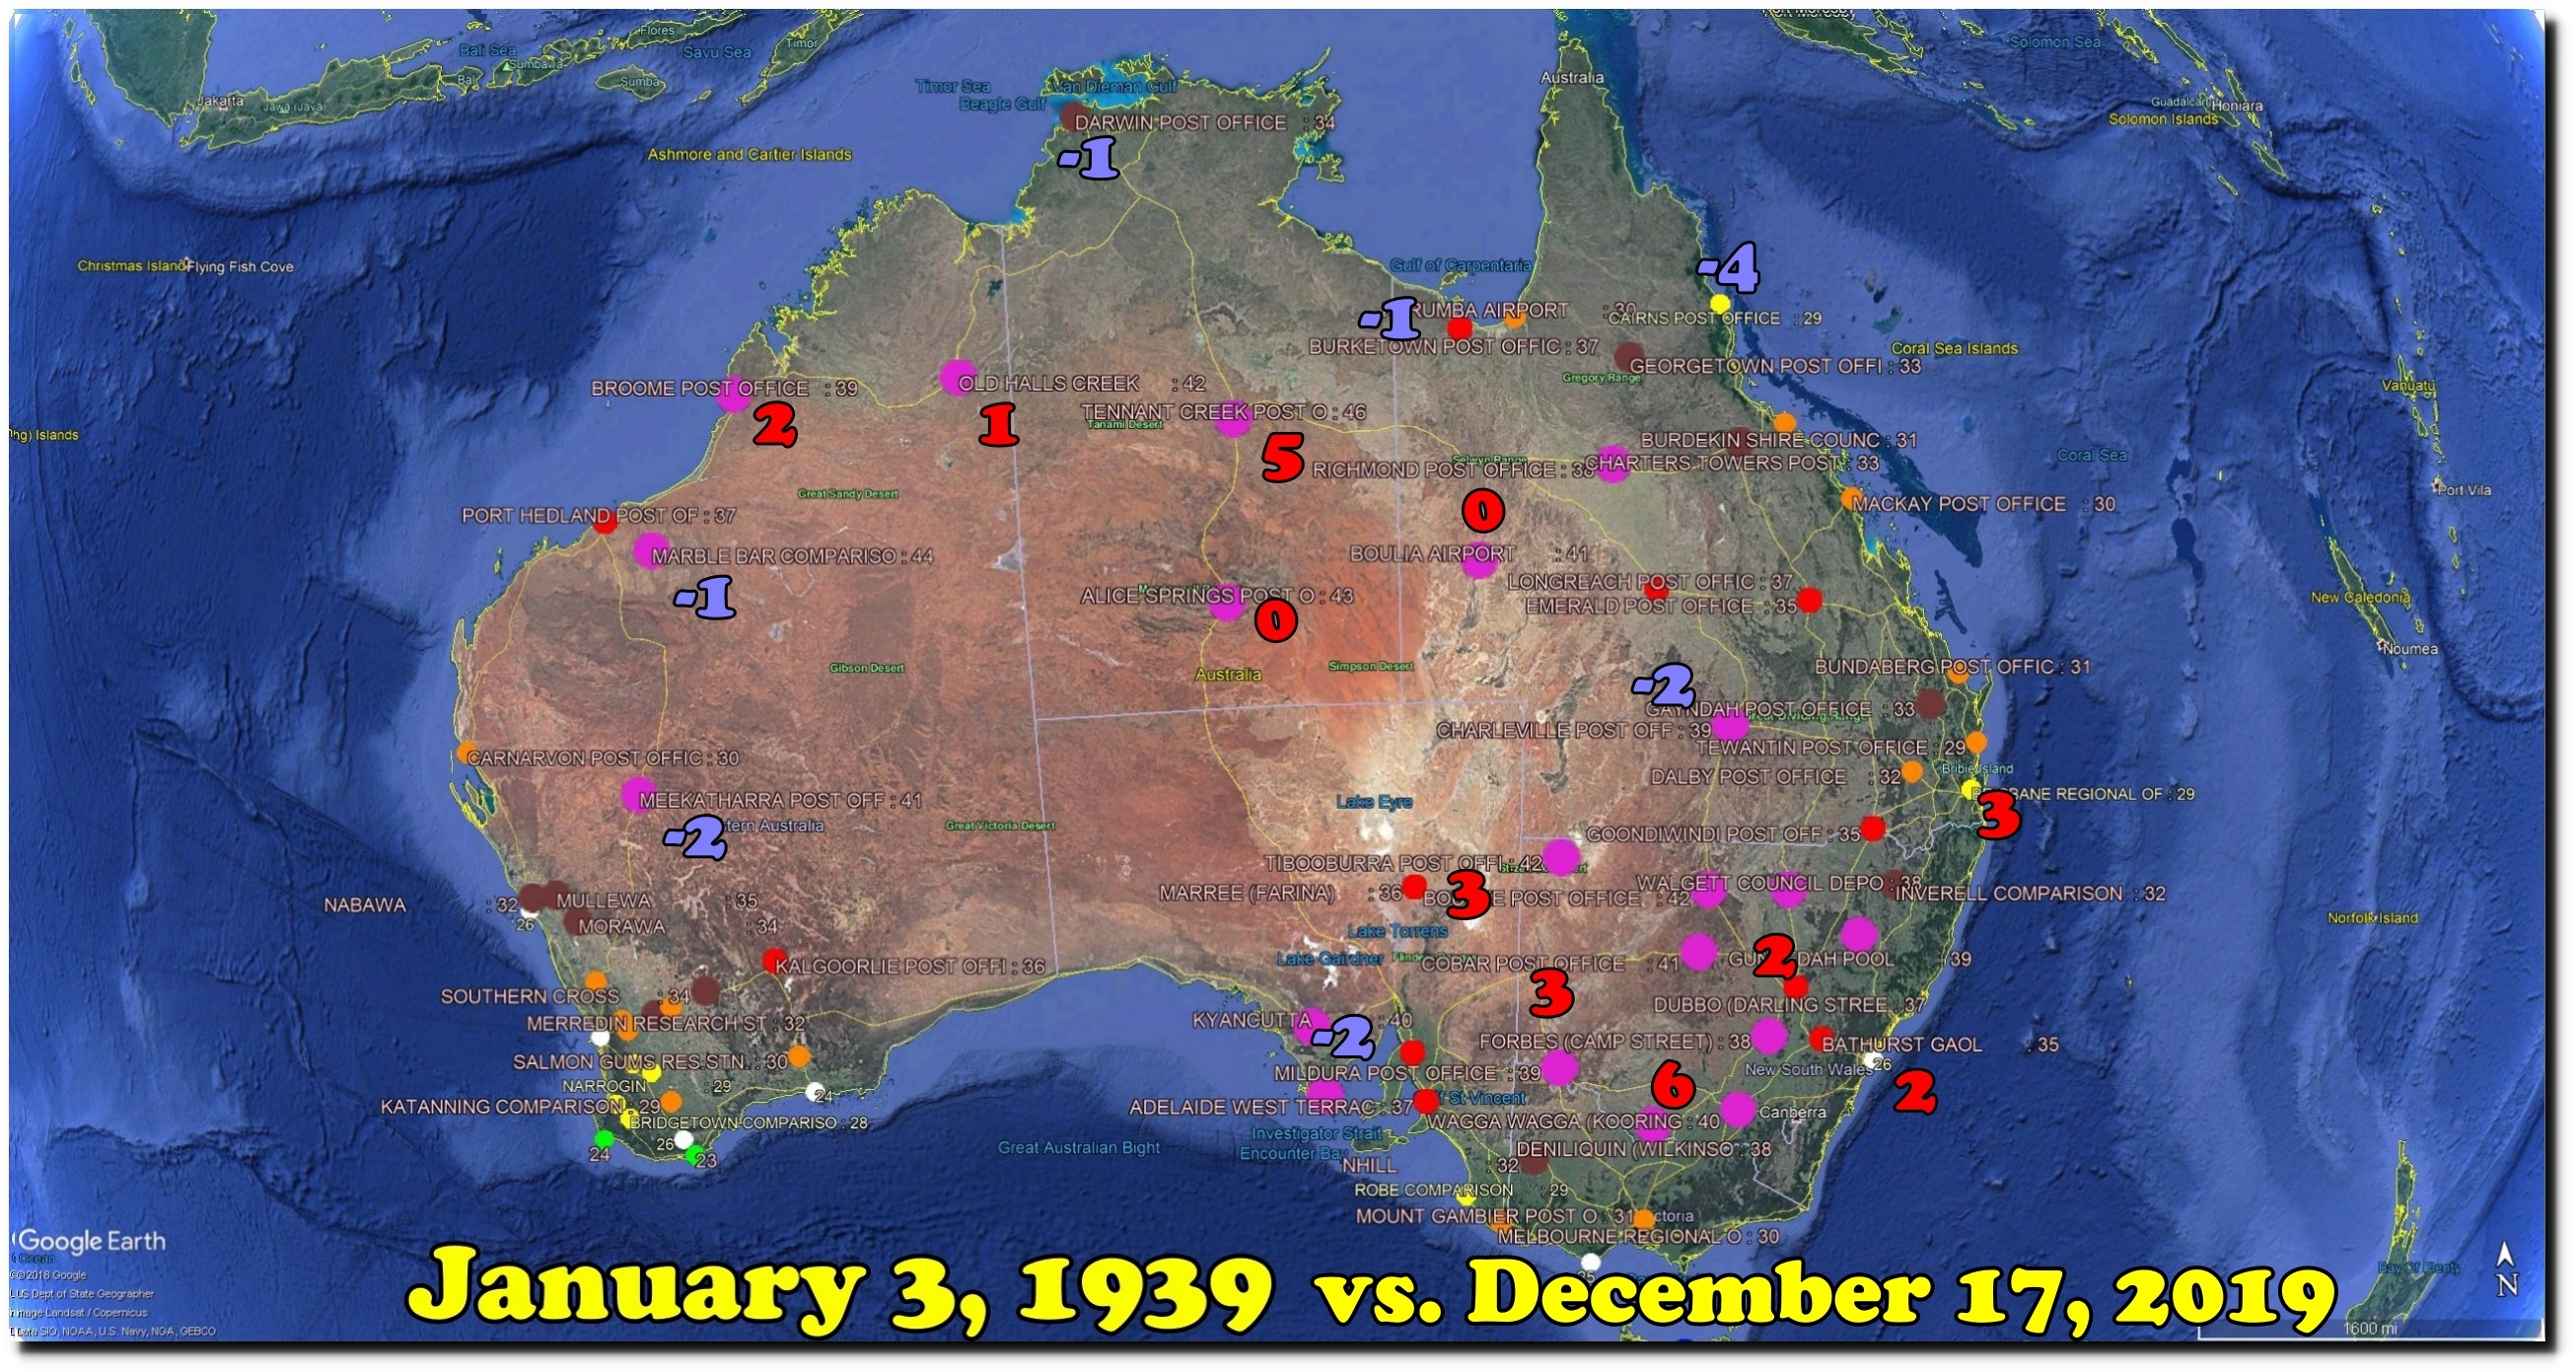
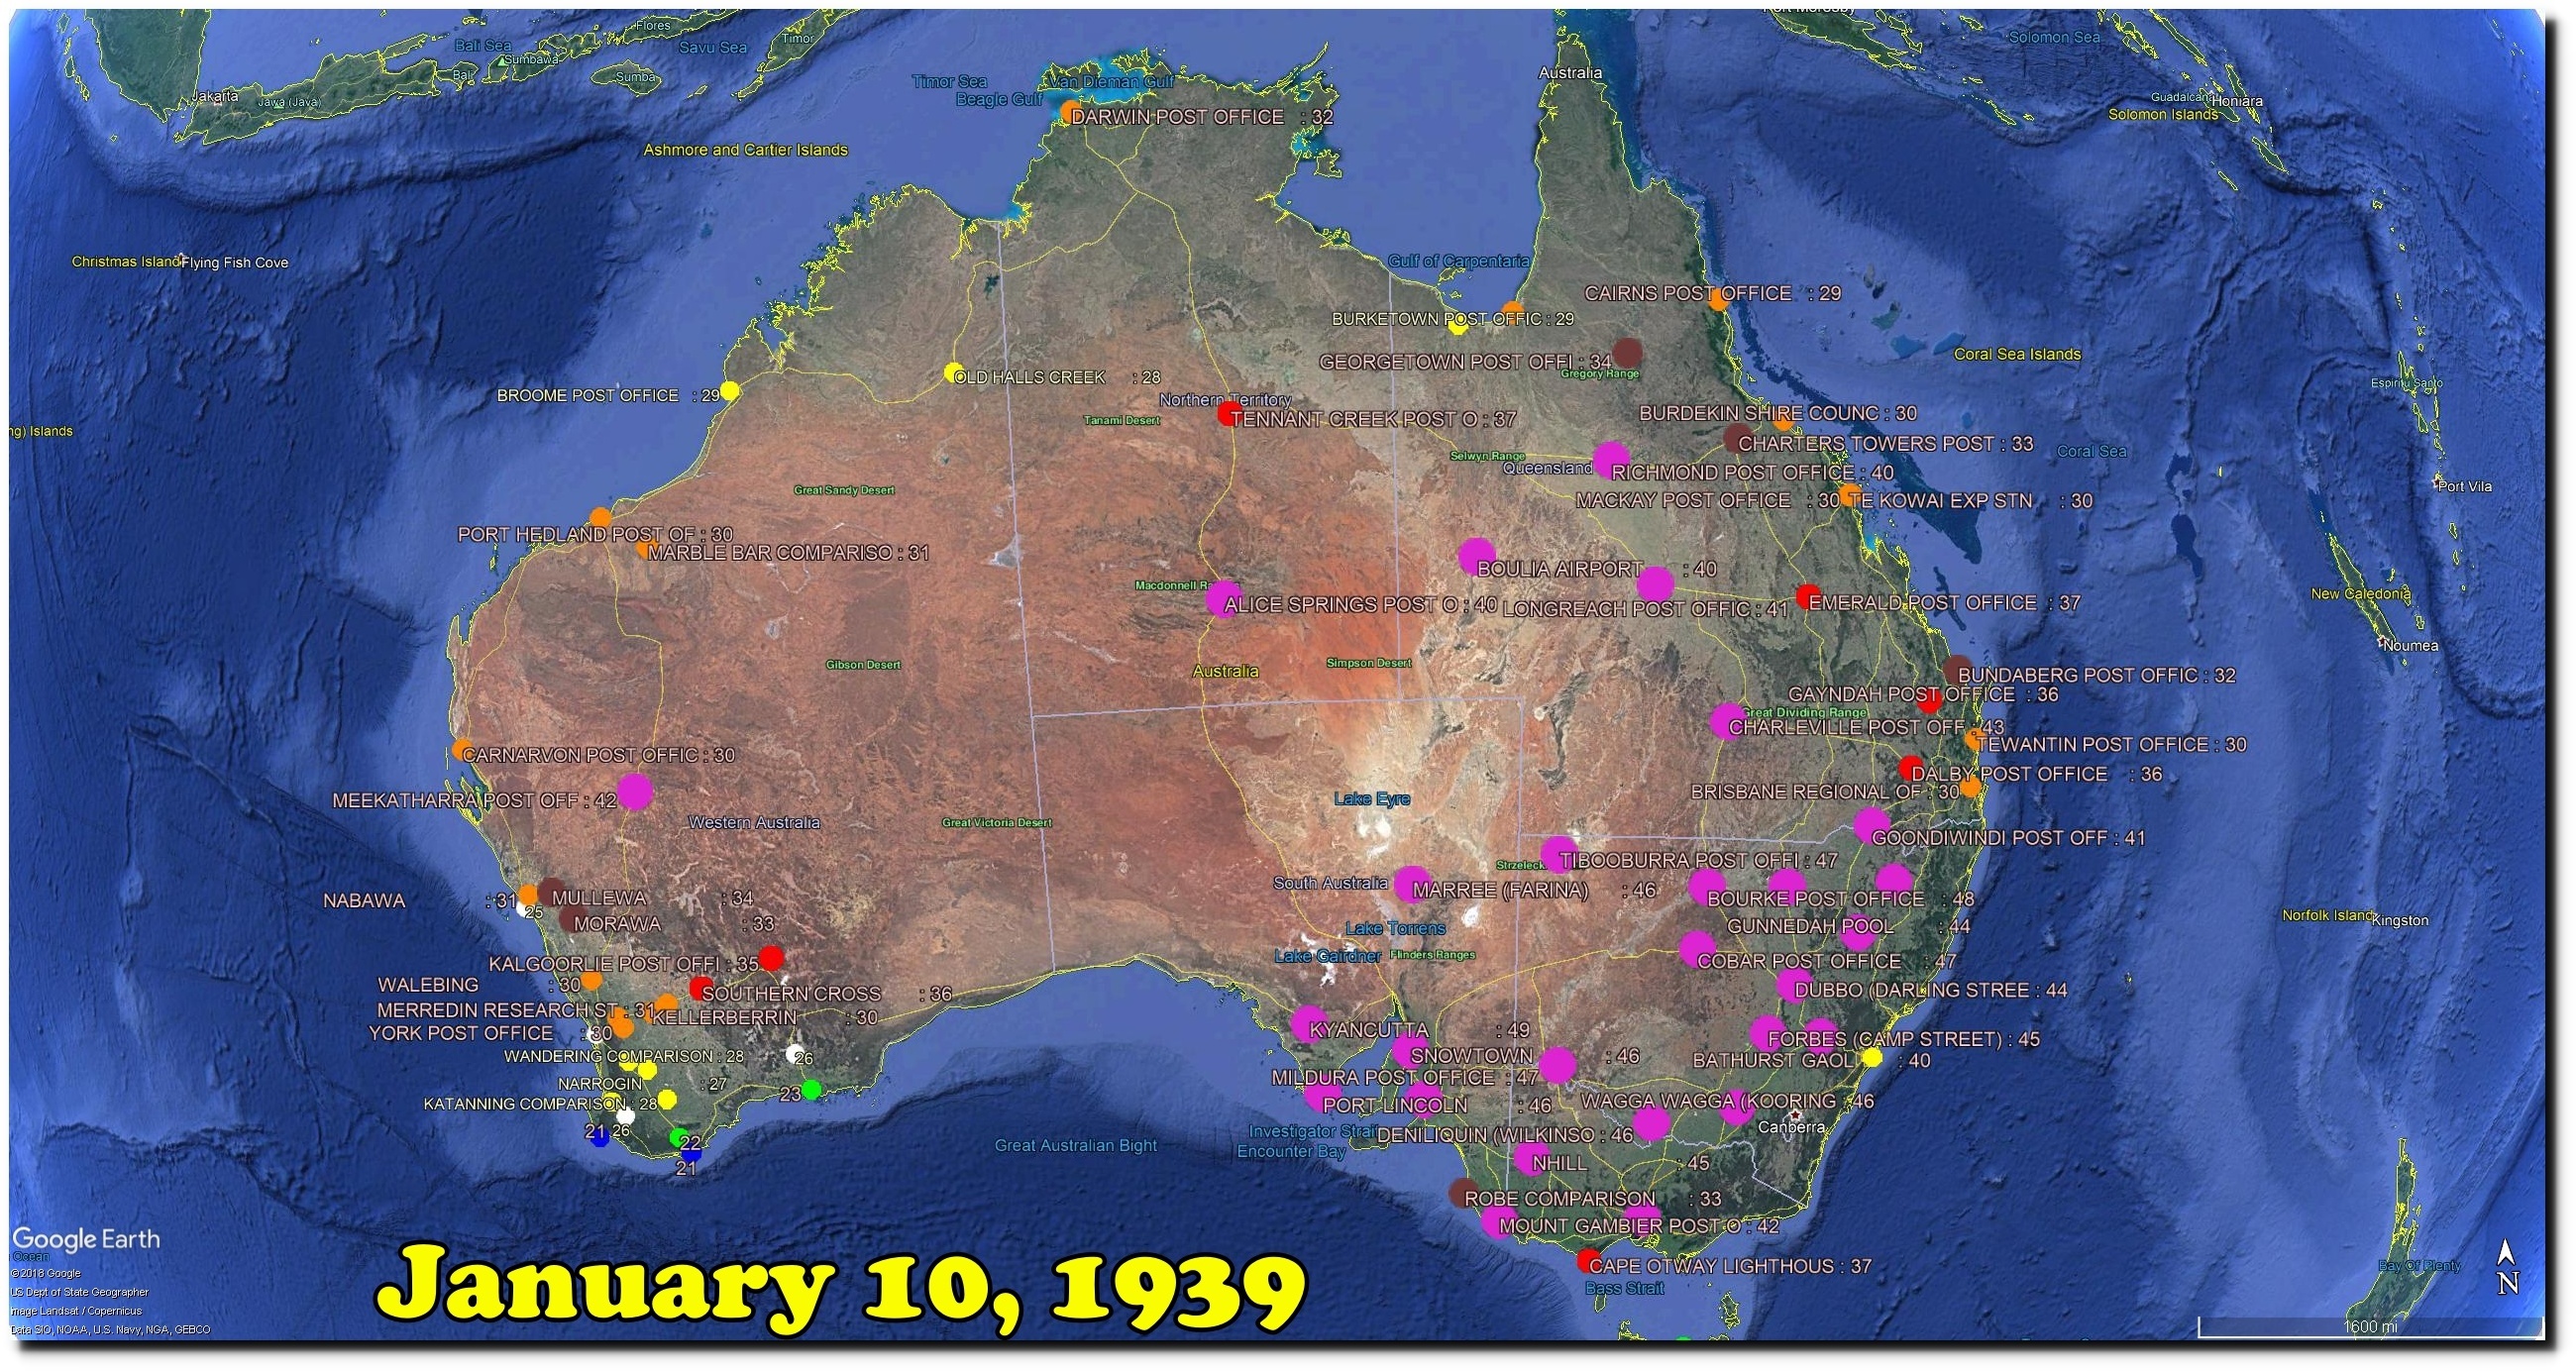
Australia’s had another massive heatwave in 1939, which was much hotter than this year.
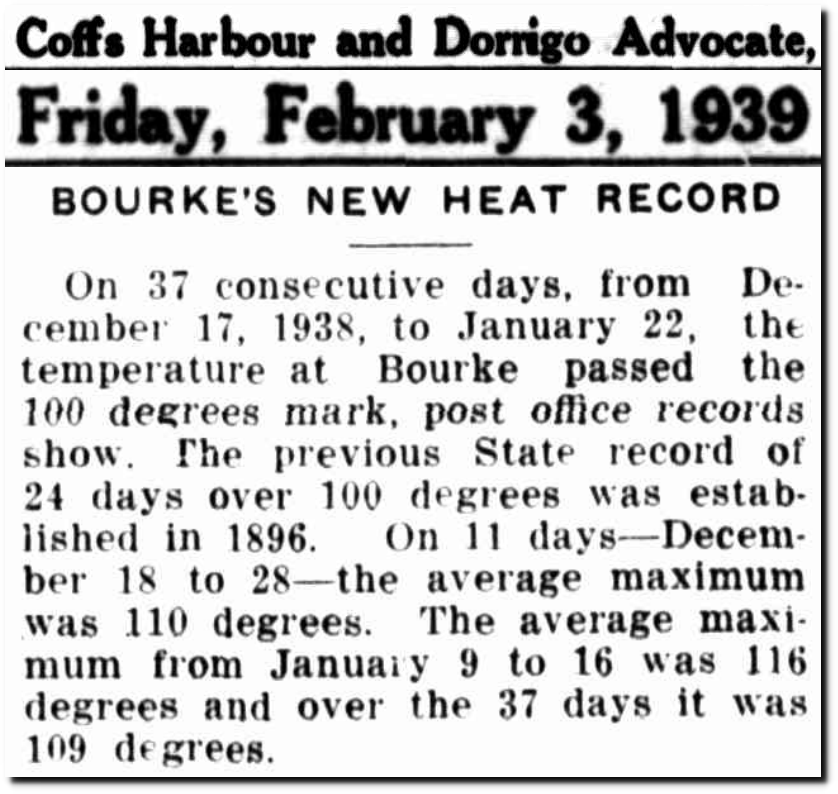
03 Feb 1939 – BOURKE’S NEW HEAT RECORD – Trove

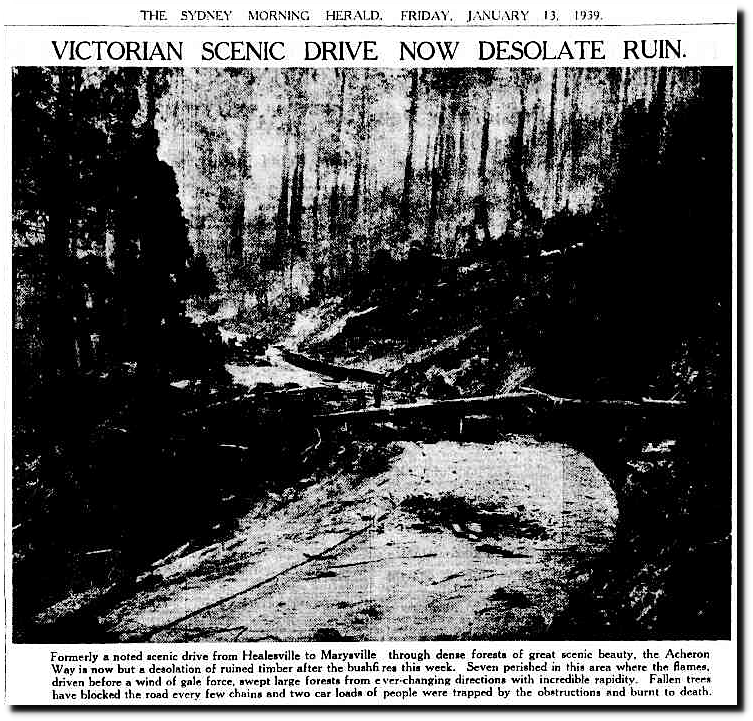
13 Jan 1939 – STATE’S BLANKET OF HEAT. – Trove
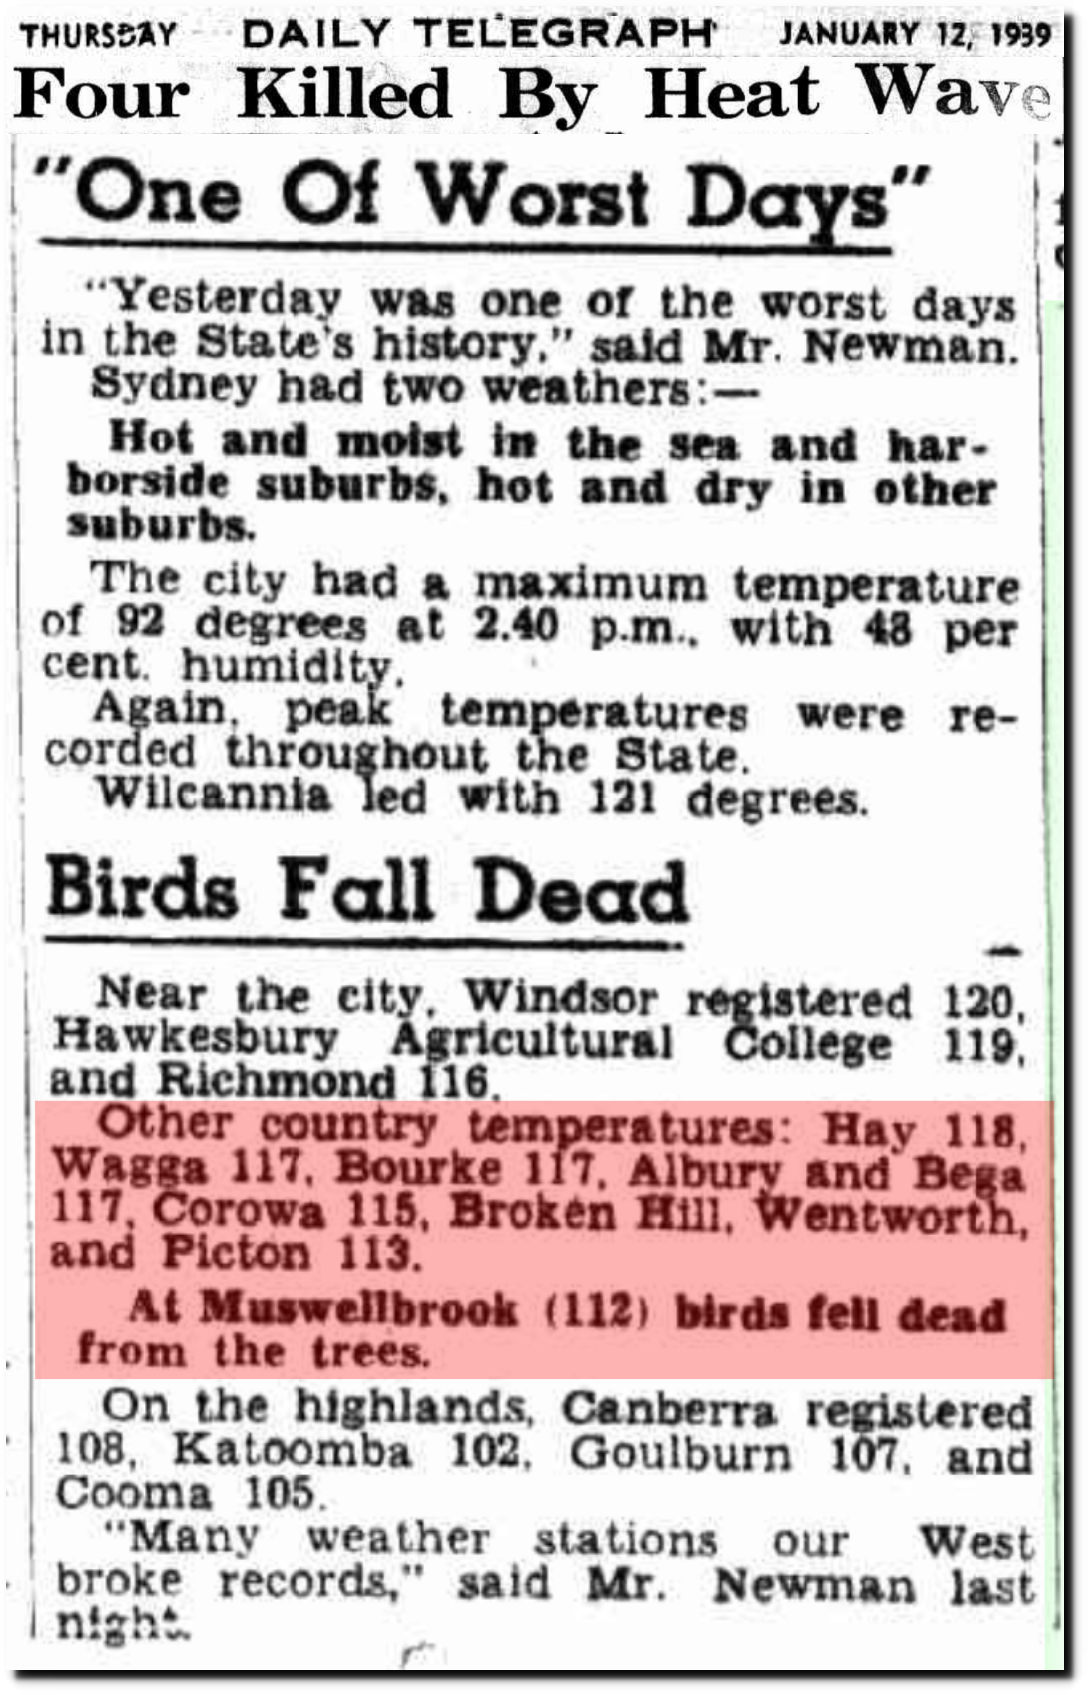
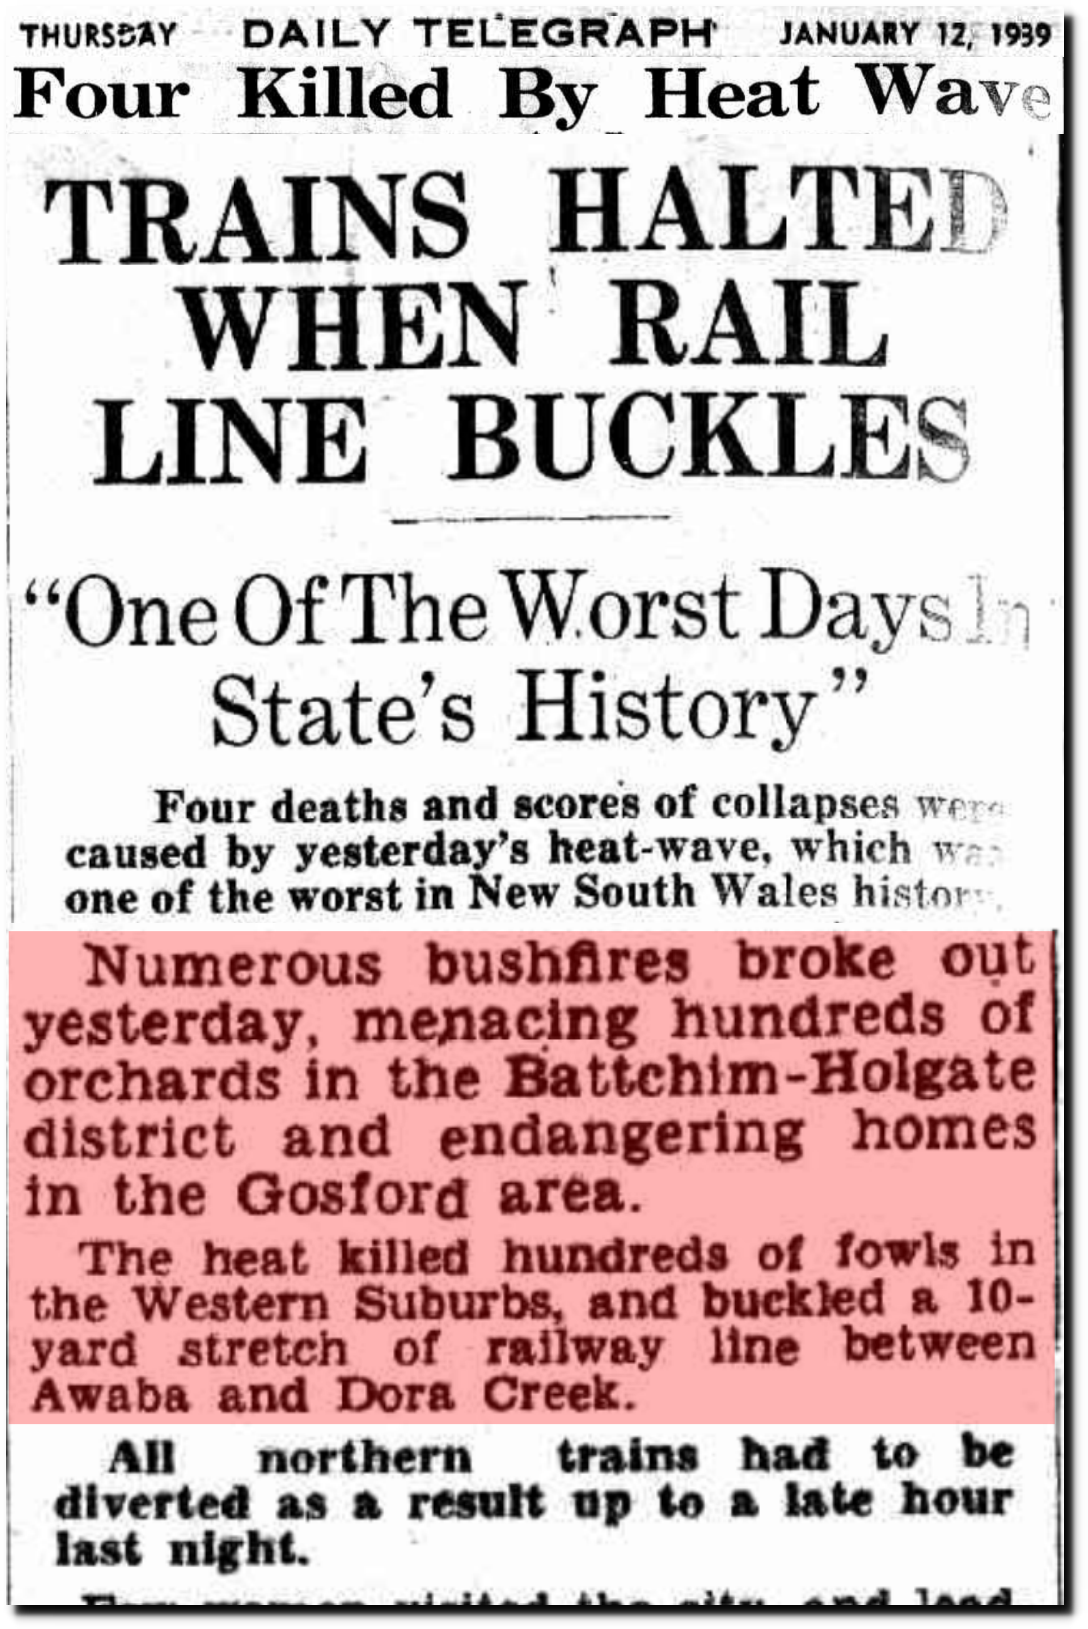
12 Jan 1939 – Four Killed By Heat Wave – Trove
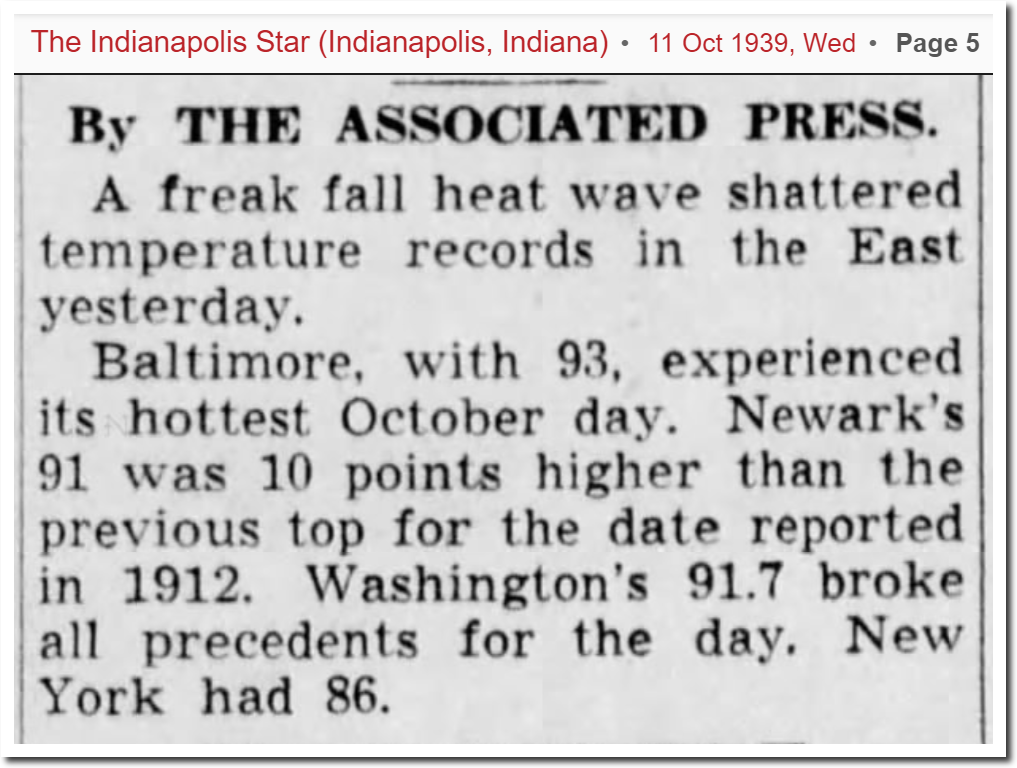
11 Oct 1939, Page 5 – The Indianapolis Star at Newspapers.com
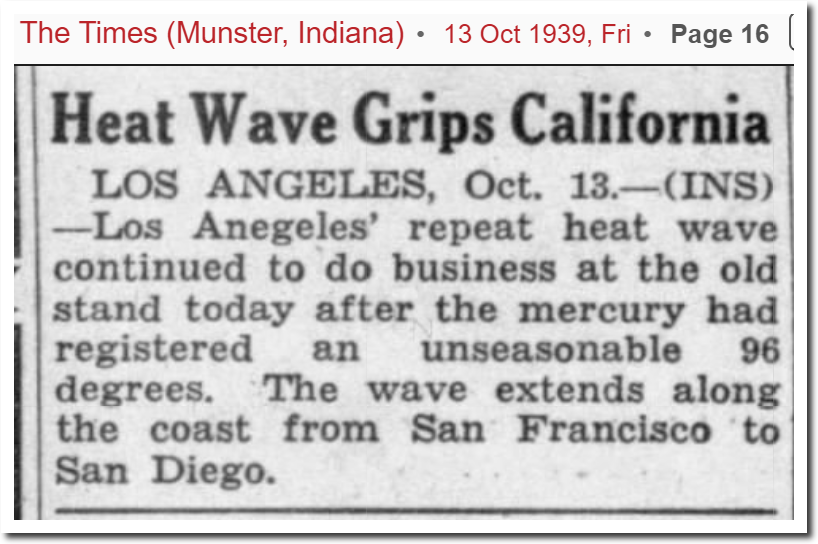
13 Oct 1939, 16 – The Times at Newspapers.com
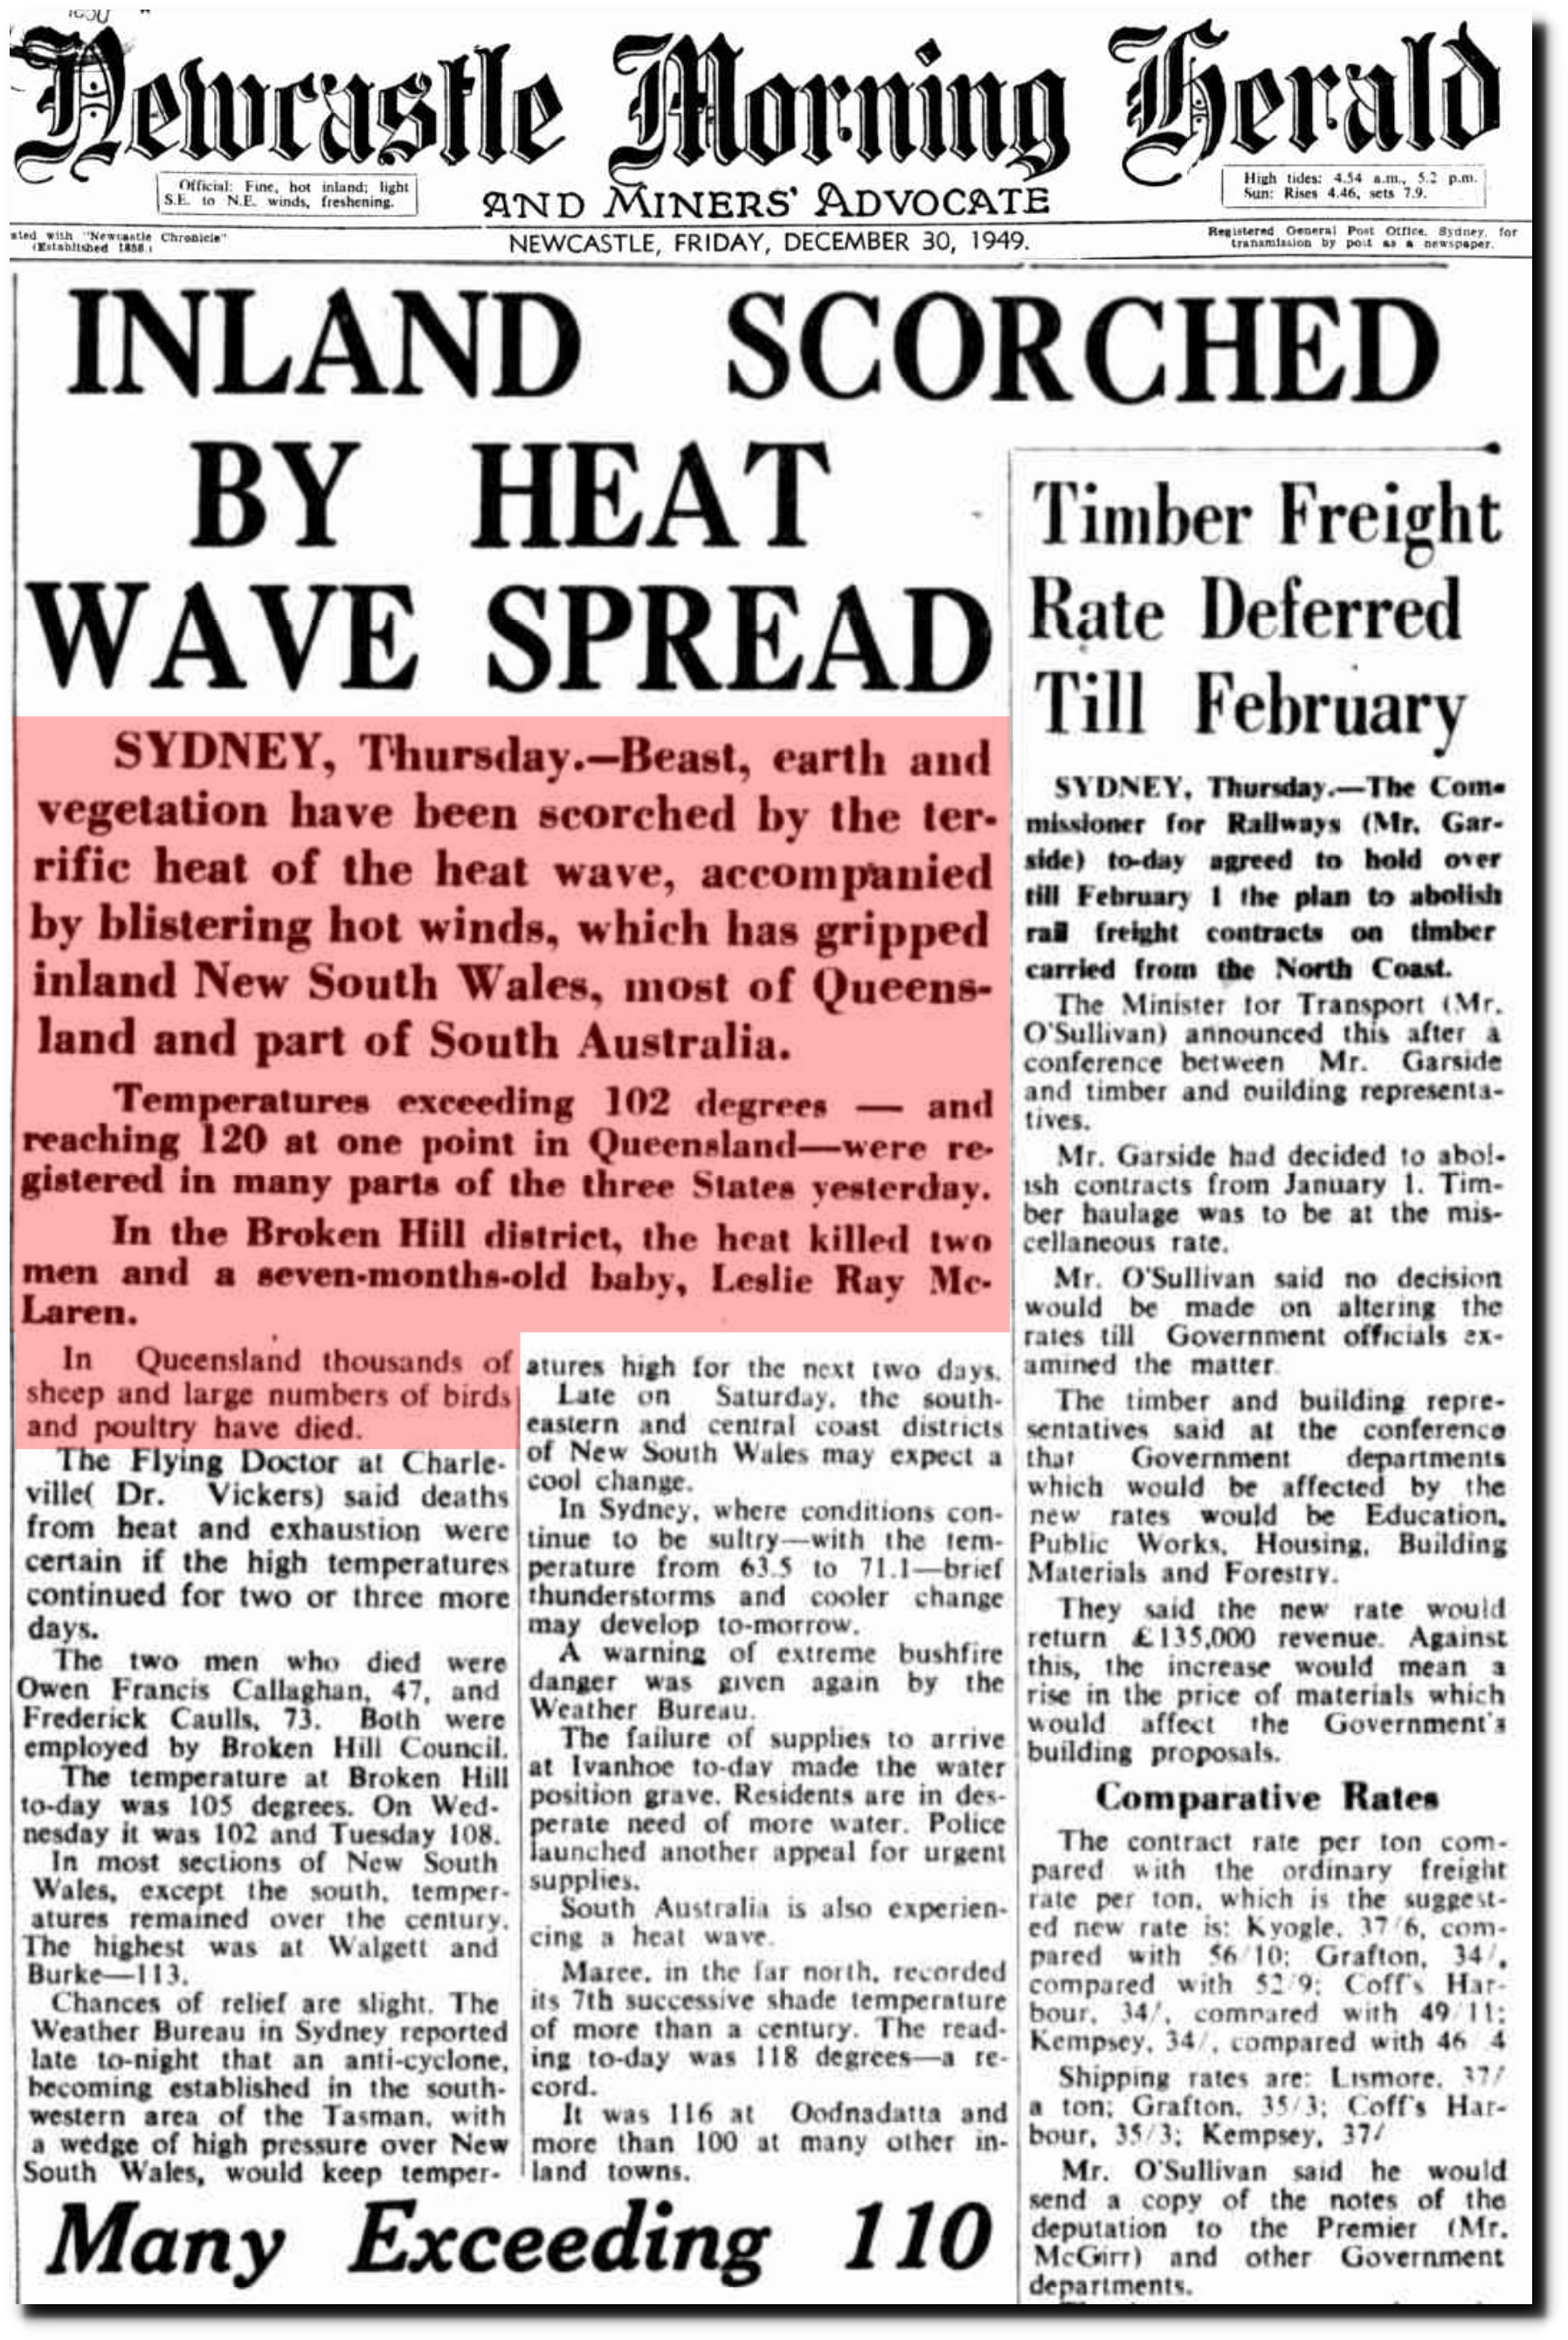
30 Dec 1949 – INLAND SCORCHED BY HEAT WAVE SPREAD – Trove
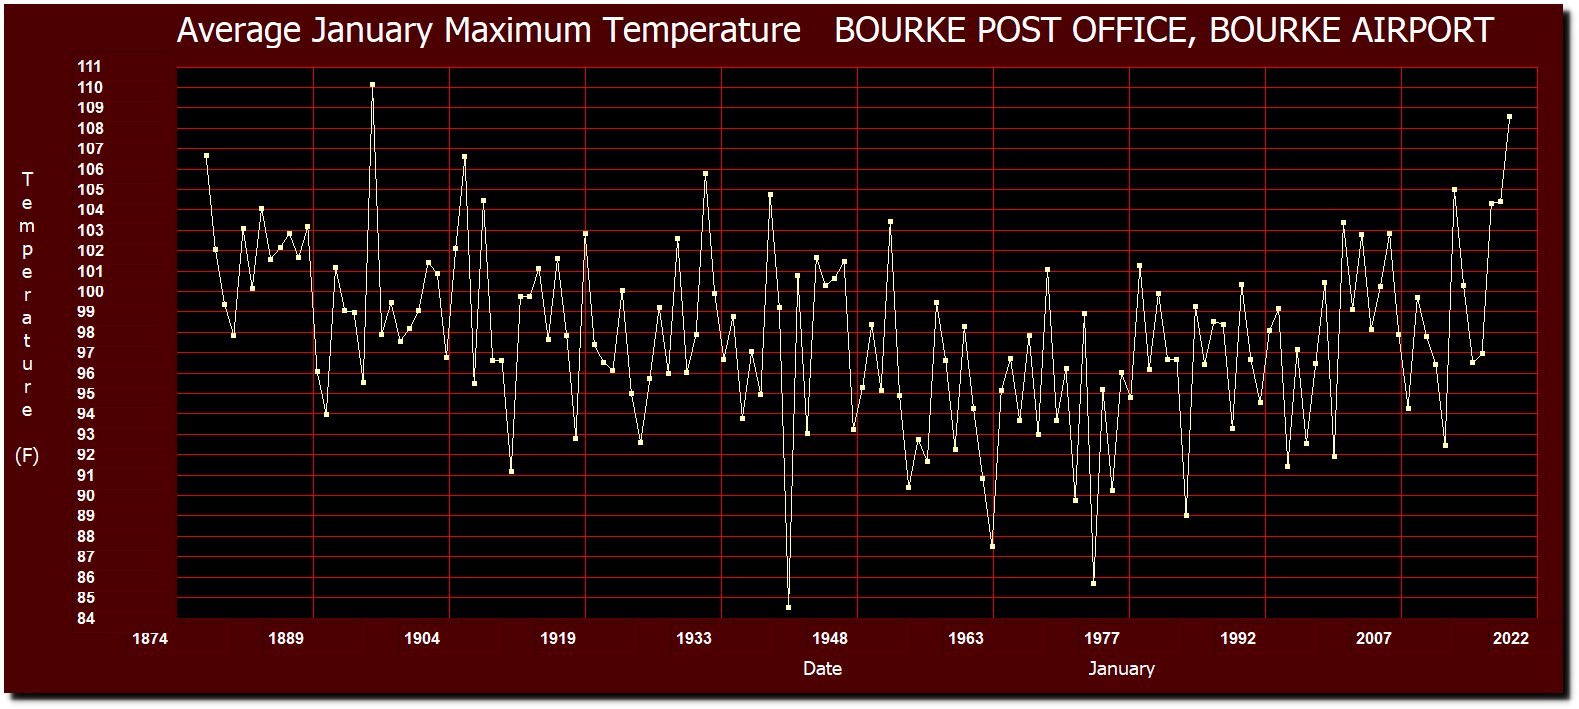
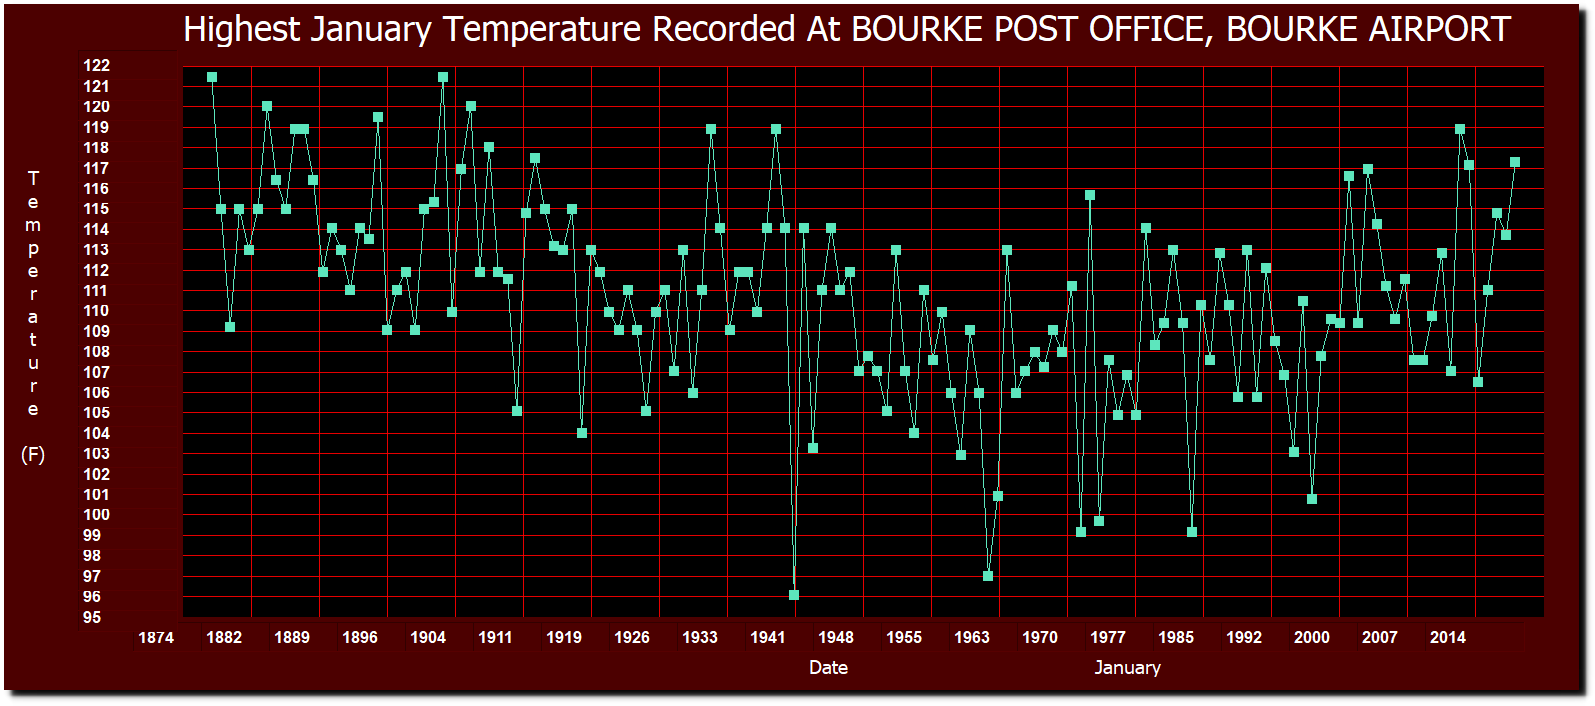
BOM claims that a change to the thermometer housing at Bourke in 1908 caused a step change of 2C cooling, but the temperature data shows nothing of the sort. Temperatures at Bouke cooled steadily from he 1870s to the 1970s.


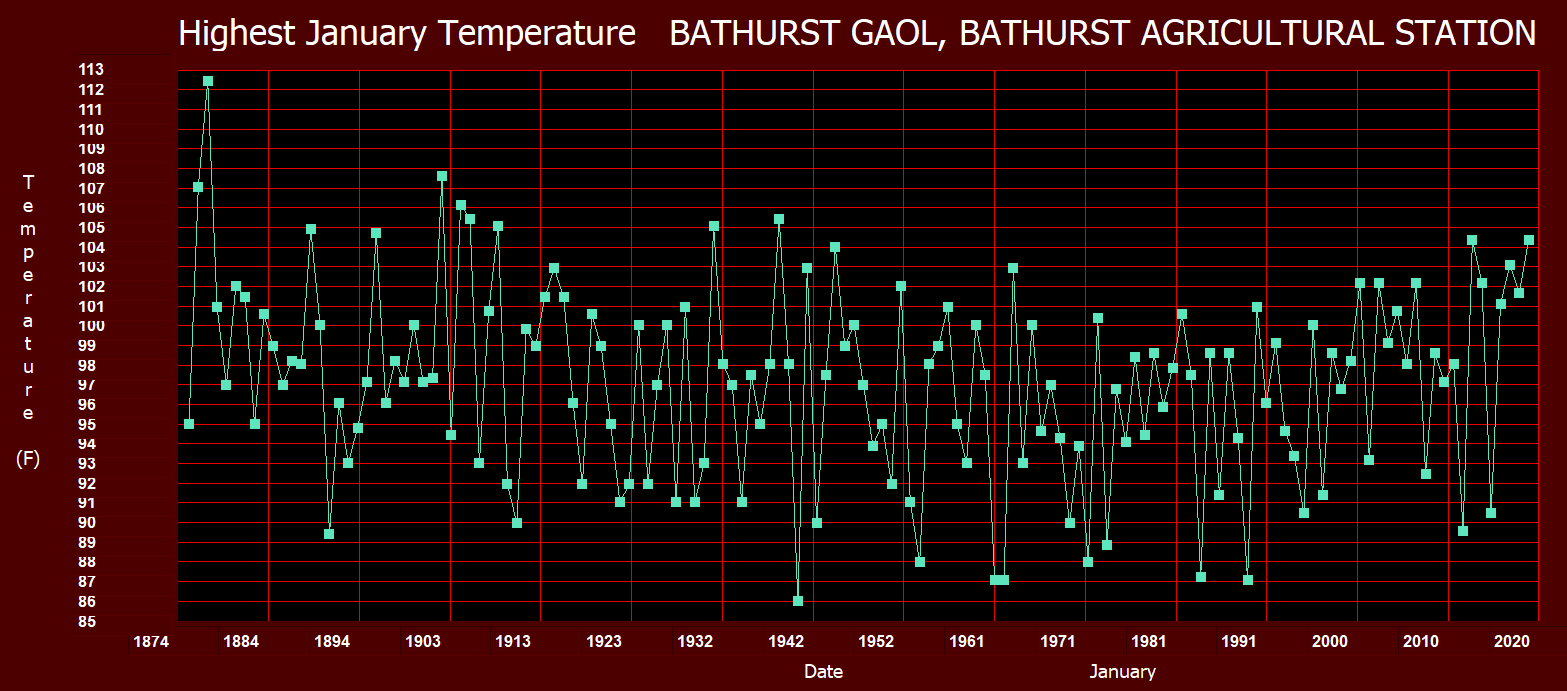
And the same at other locations in southeast Australia

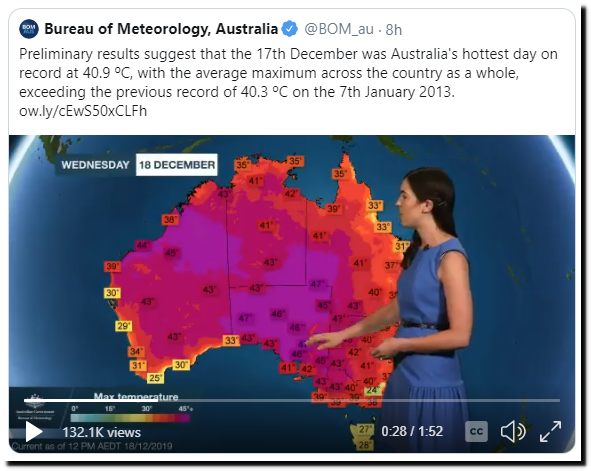
BOM claims that December 17 was the hottest day on record in Australia, but that claim is not defensible.


The National Geographic Archive | November 1976 | page 1
And not surprisingly, the person and money behind all of the fake claims about Australian fires is being controlled by Tim Flannery.

Subscribe to The Australian | Newspaper home delivery, website, iPad, iPhone & Android apps
None of the claims being made about record heat or fires are credible, but that is standard operating procedure for climate scientists.
