
DMI’s explanation for why the altered the data. They claim the new model doesn’t change the relative positioning between years and primarily affects melt season volume.
“We have improved the DMI operational ocean and sea-ice model HYCOM-CICE with higher horizontal resolution and updated HYCOM and CICE code. In particular, the sea ice code has been greatly improved with meltponds, sea-ice salinity, improved thermodynamics and much more.
The freshwater discharge from Greenland has also been greatly improved using freshwater product from GEUS, which especially improves the coastal ocean currents and thus the ice transport nearshore Greenland. The model has been running continuously since September 1990.
The model has been running continuously since September 1990. Therefore, we have by December 07, 2021 updated the graphics of sea-ice thickness and volume using the new and improved data on Polarportal and ocean.dmi.dk.
The improved model setup has led to higher variability as well as less adrupt melting during the melt season, which gives a shift of approximately half a month for the time of minimum ice volume. The trend between the years is almost unchanged. Thereby, a year with a large sea-ice volume in the old setup also has a large volume in the new setup, and similar for years with low sea-ice volume.”
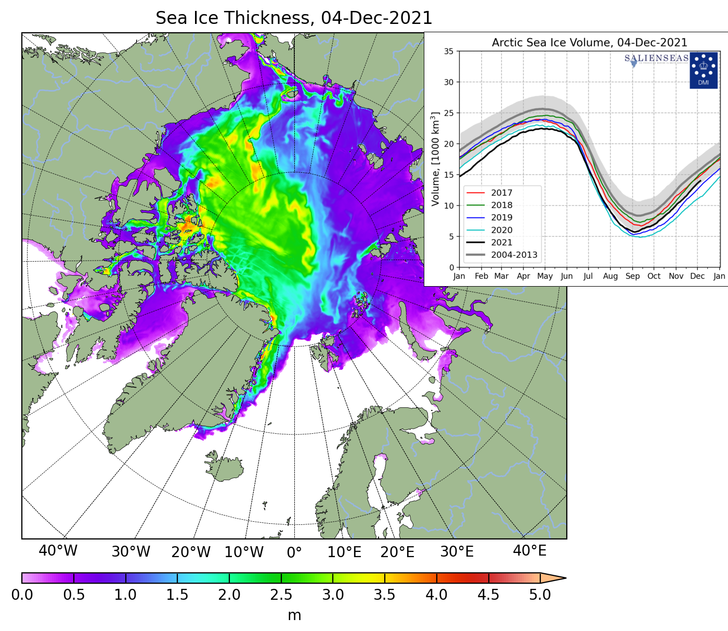
The “new and improved” version put 2021 below the 2004-2013 mean, below 2017 and below 2018. The two years which saw a large reduction in December volume were 2020 and 2021. There aren’t any melt ponds in December. The 2004-2013 mean, and 2017, 2018, 2019 didn’t change significantly – but 2020 and 2021 dropped sharply.
CICE_combine_thick_SM_EN_20211204.png (728×631)
FullSize_CICE_combine_thick_SM_EN_20211204.png
There was very little change to the 2021 summer volume, but lots of change to the winter volume. The is the opposite of other years and the opposite of their description of the changes.
The changes they made occurred during winter, not summer. It appears they rotated the 2021 data several degrees clockwise, which brought spring volume up and winter volume down.
The sailors are trapped in the ice because of an early freeze up, and DMI has altered the data to show the exact opposite.
The 2017 data is rotated counter-clockwise in the new version, but the 2021 data is rotated the other direction. Their changes aren’t credible and are a complete mess.
