
July 13 Arctic sea ice extent is almost identical to the same date in 1995.

The 1990 and 1995 IPCC reports showed no ice loss from 1972-1995, but the 1995 IPCC report massively altered the data to show a decline.
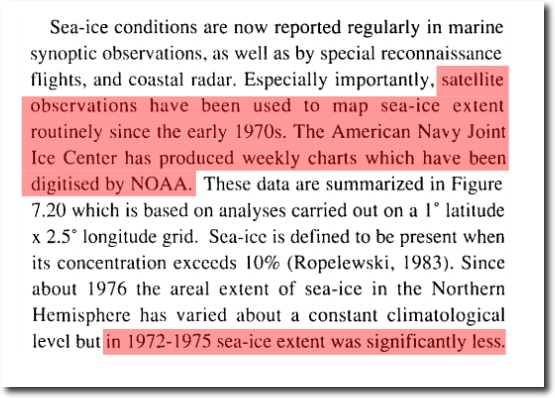
“The American Navy Joint Ice Center has produced weekly charts which have been digitised by NOAA ….. Since about 1976 the areal extent of sea-ice in the Northern Hemisphere has varied about a constant climatological level but in 1972-1975 sea-ice extent was significantly less.
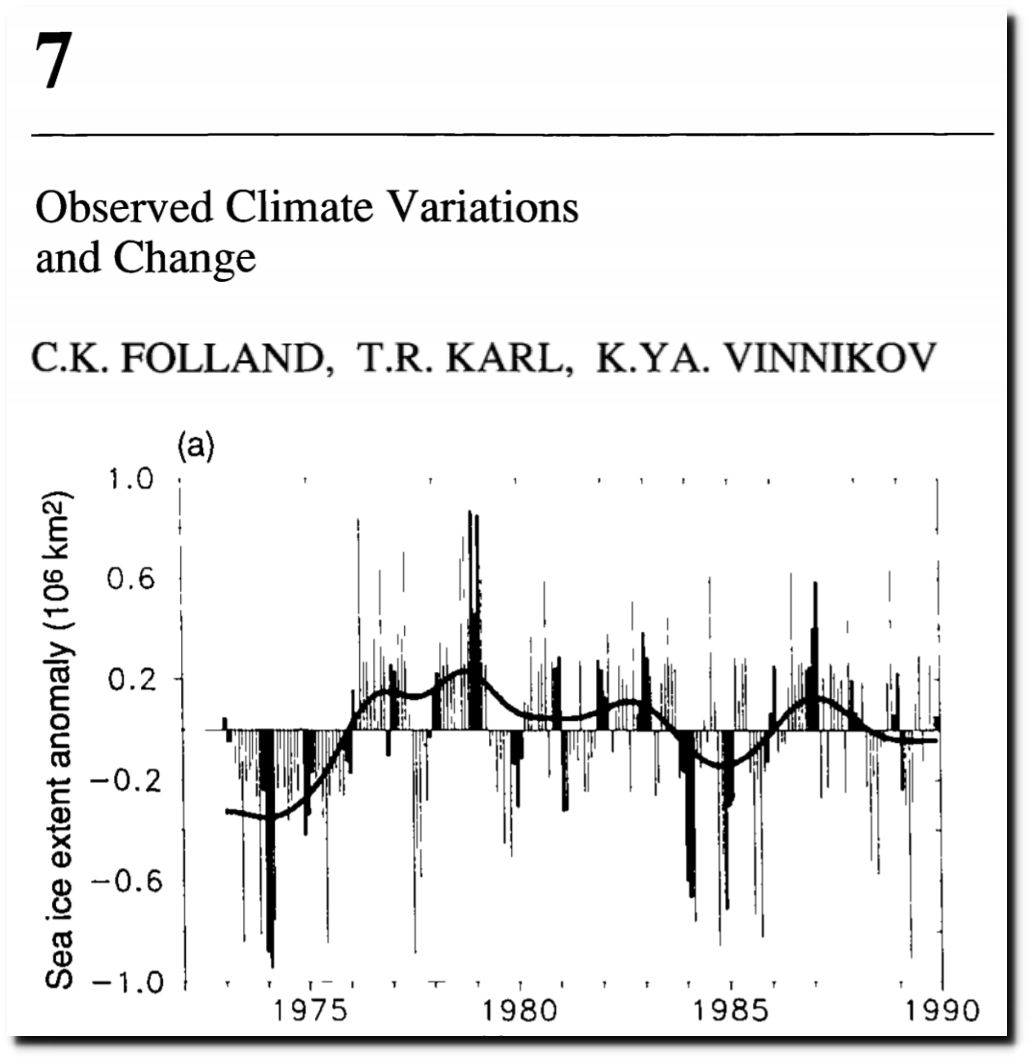
1995 IPCC Report
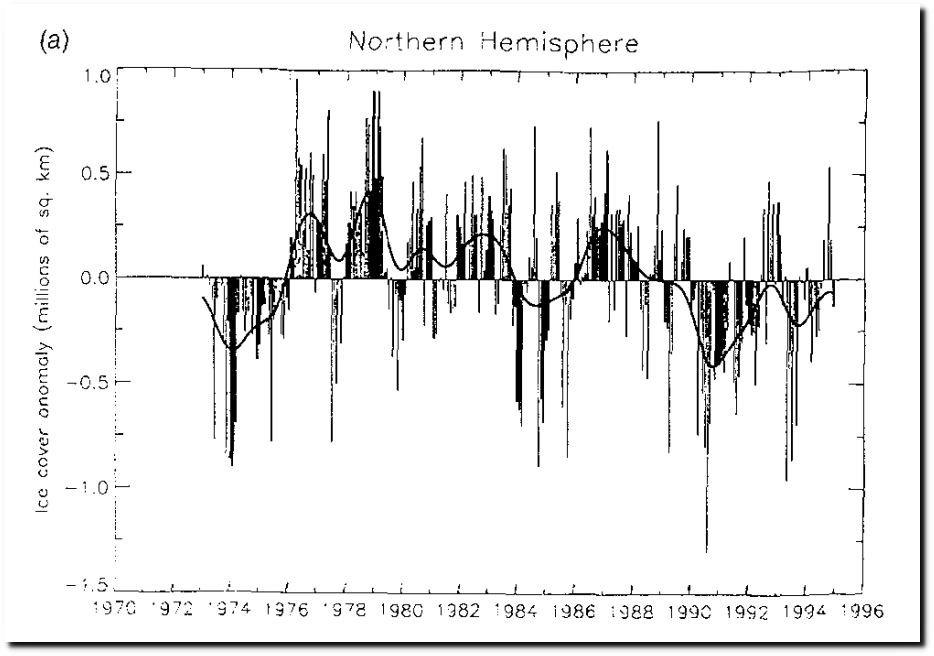
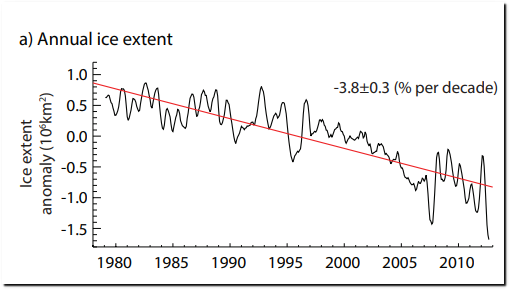
2001 IPCC Report
https://archive.ipcc.ch/ipccreports/tar/wg1/062.htm
Now they hide all the data before 1979.
