
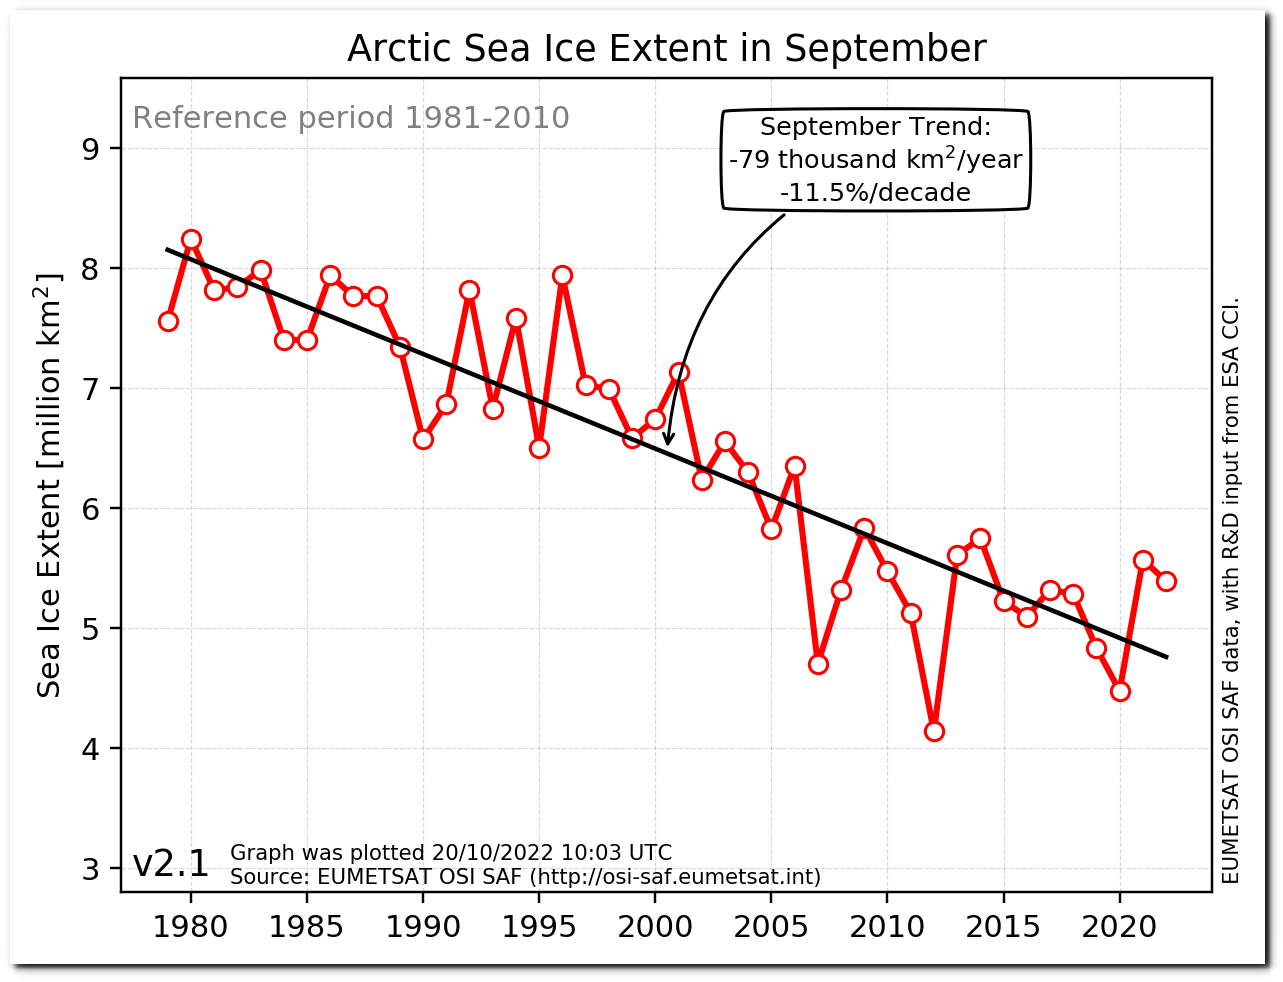
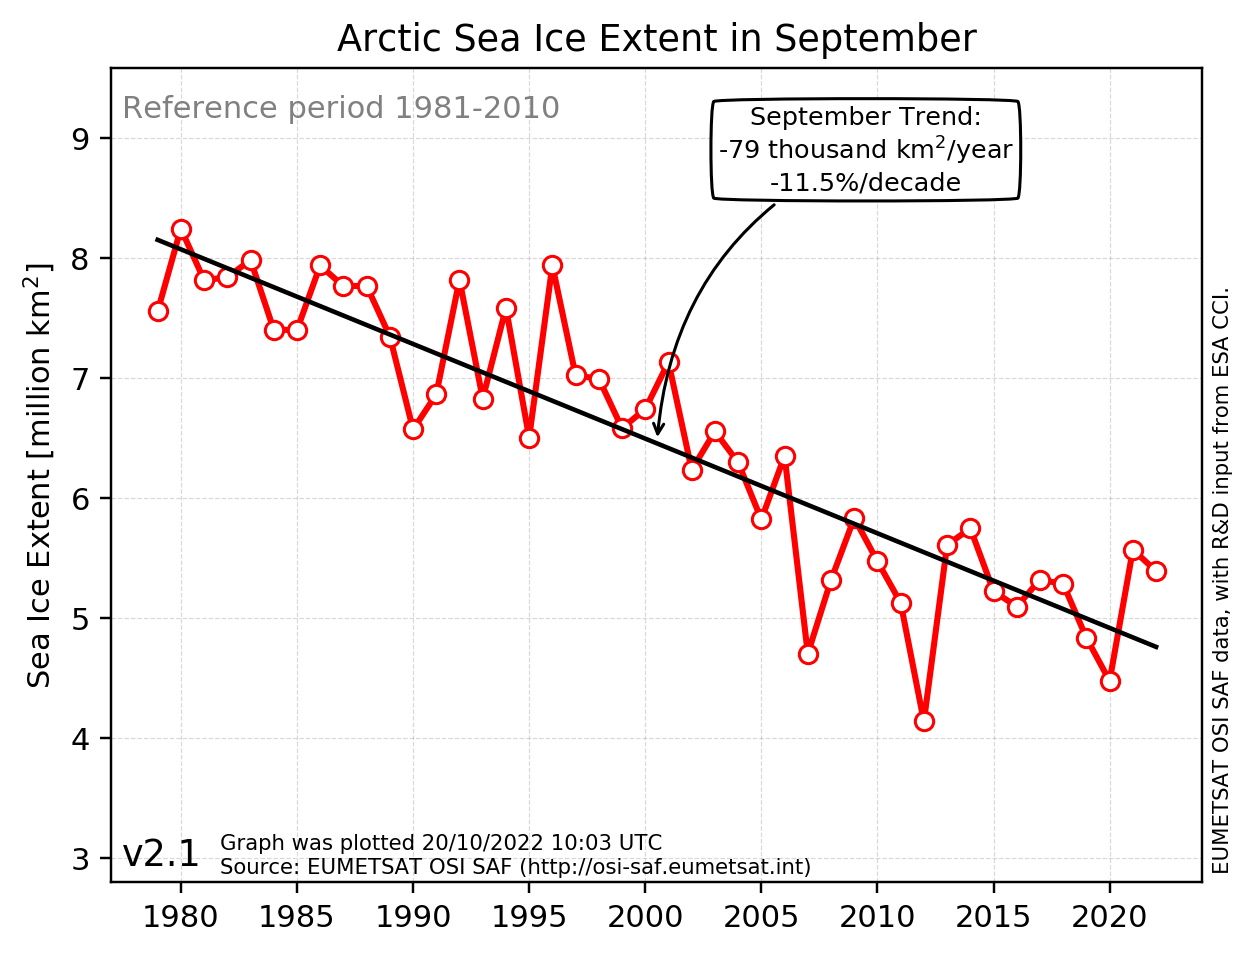
osisaf_nh_sie_monthly-09.png (1255×954)
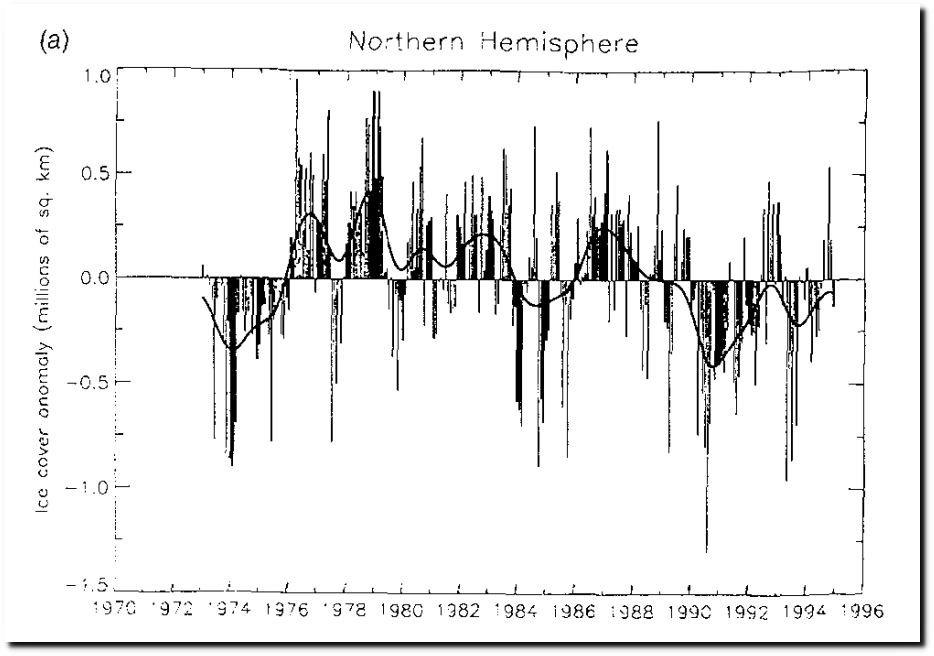
Drawing a straight line through cyclical data is one way to mislead.
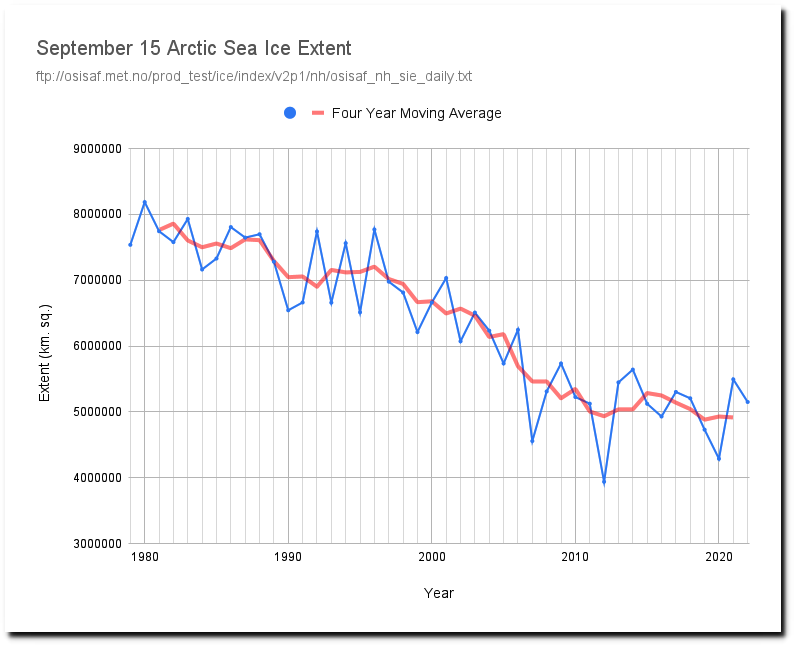
ftp://osisaf.met.no/prod_test/ice/index/v2p1/nh/osisaf_nh_sie_daily.txt
Hiding the inconvenient data before 1979 is another way to mislead.
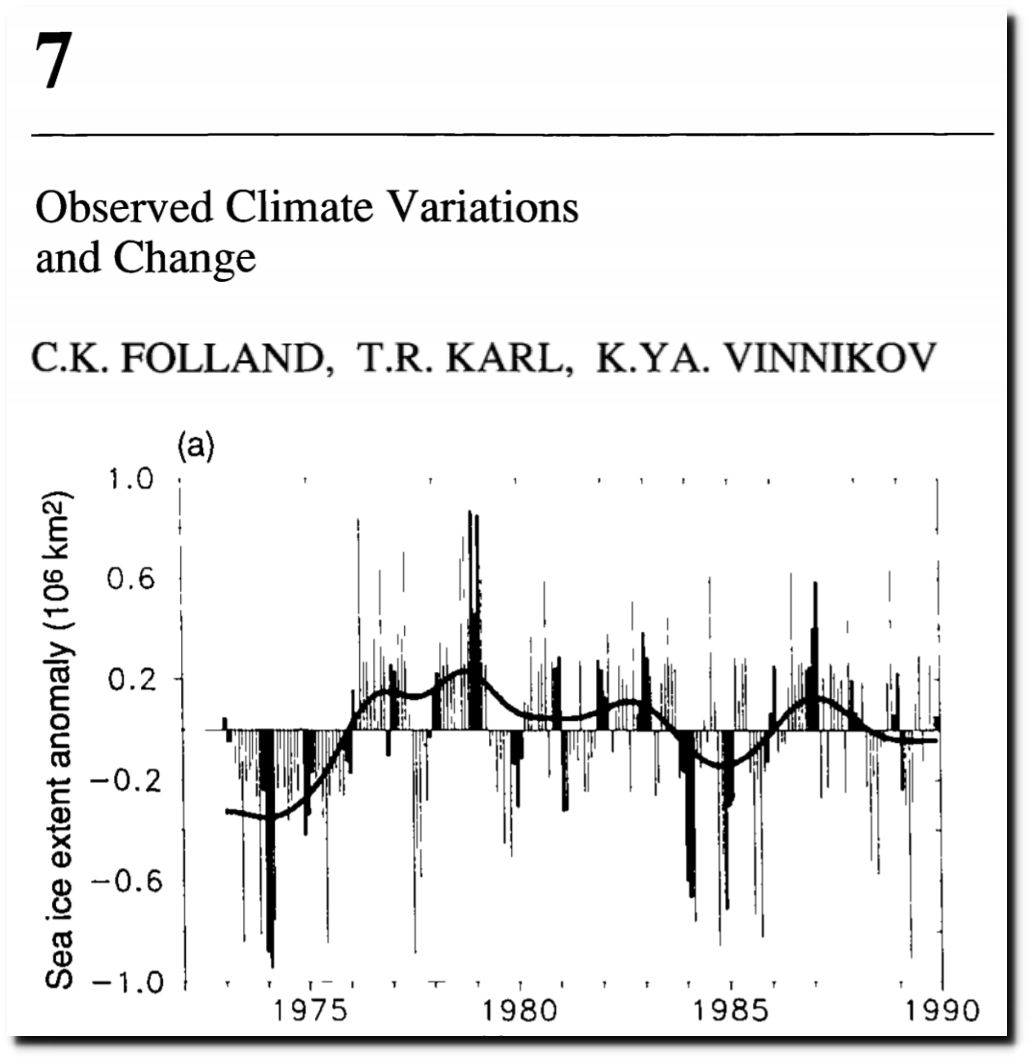
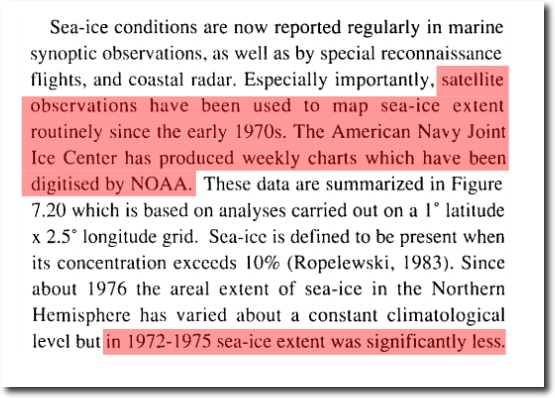
“The American Navy Joint Ice Center has produced weekly charts which have been digitised by NOAA ….. Since about 1976 the areal extent of sea-ice in the Northern Hemisphere has varied about a constant climatological level but in 1972-1975 sea-ice extent was significantly less.
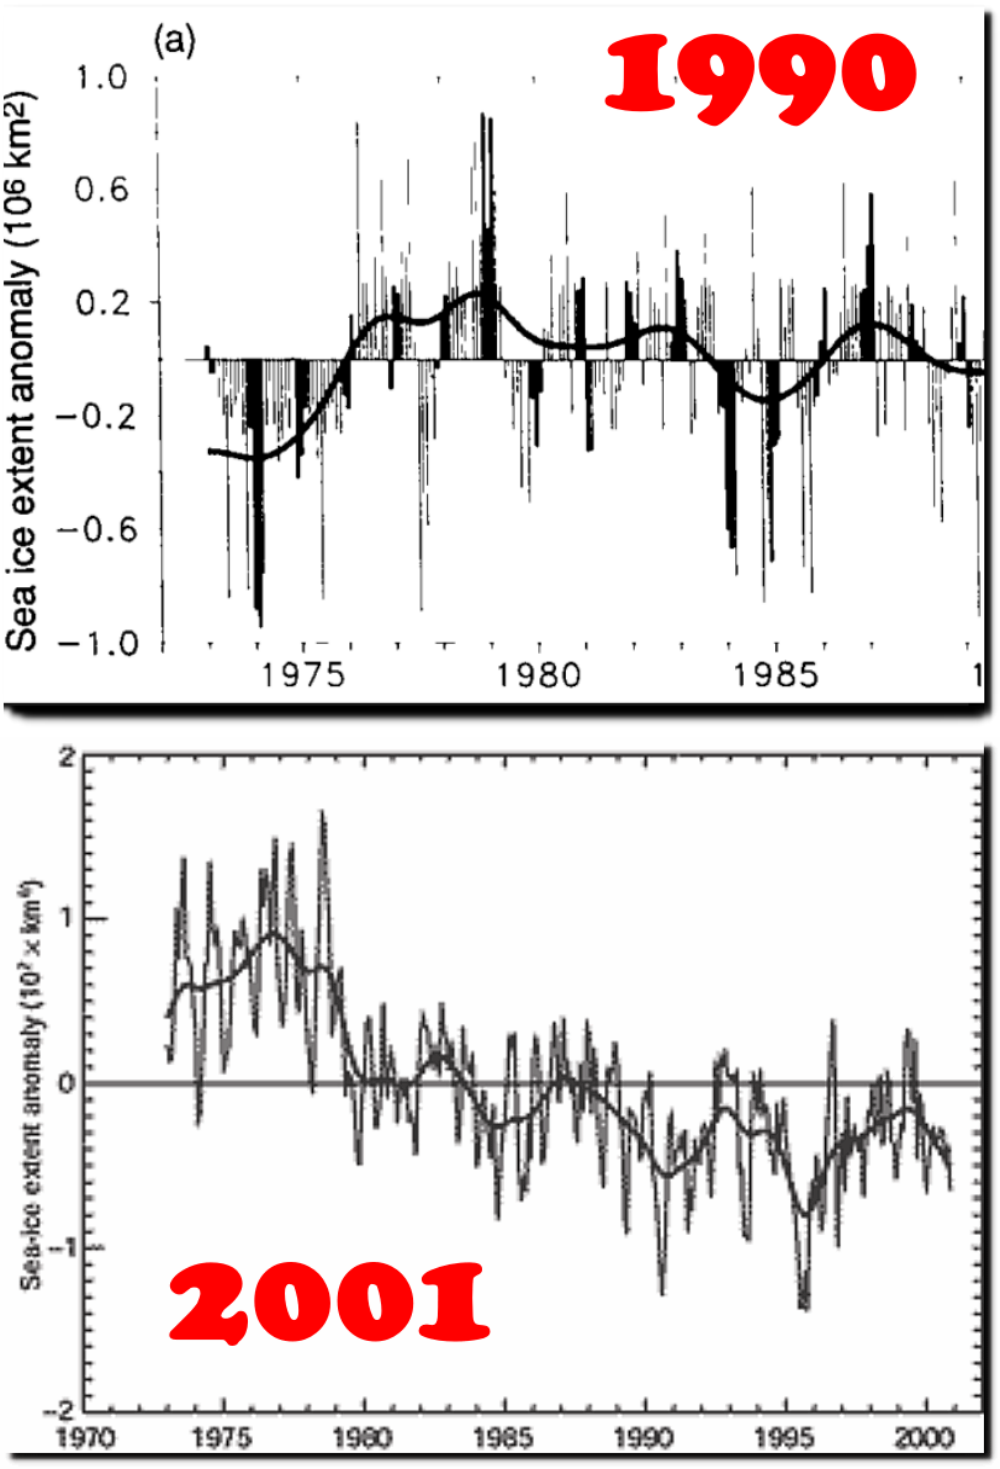
Between 1990 and 2001, the IPCC rewrote the Arctic sea ice satellite record, and changed a trend of ice increasing to ice decreasing.
1995 IPCC Report
2001 IPCC Report
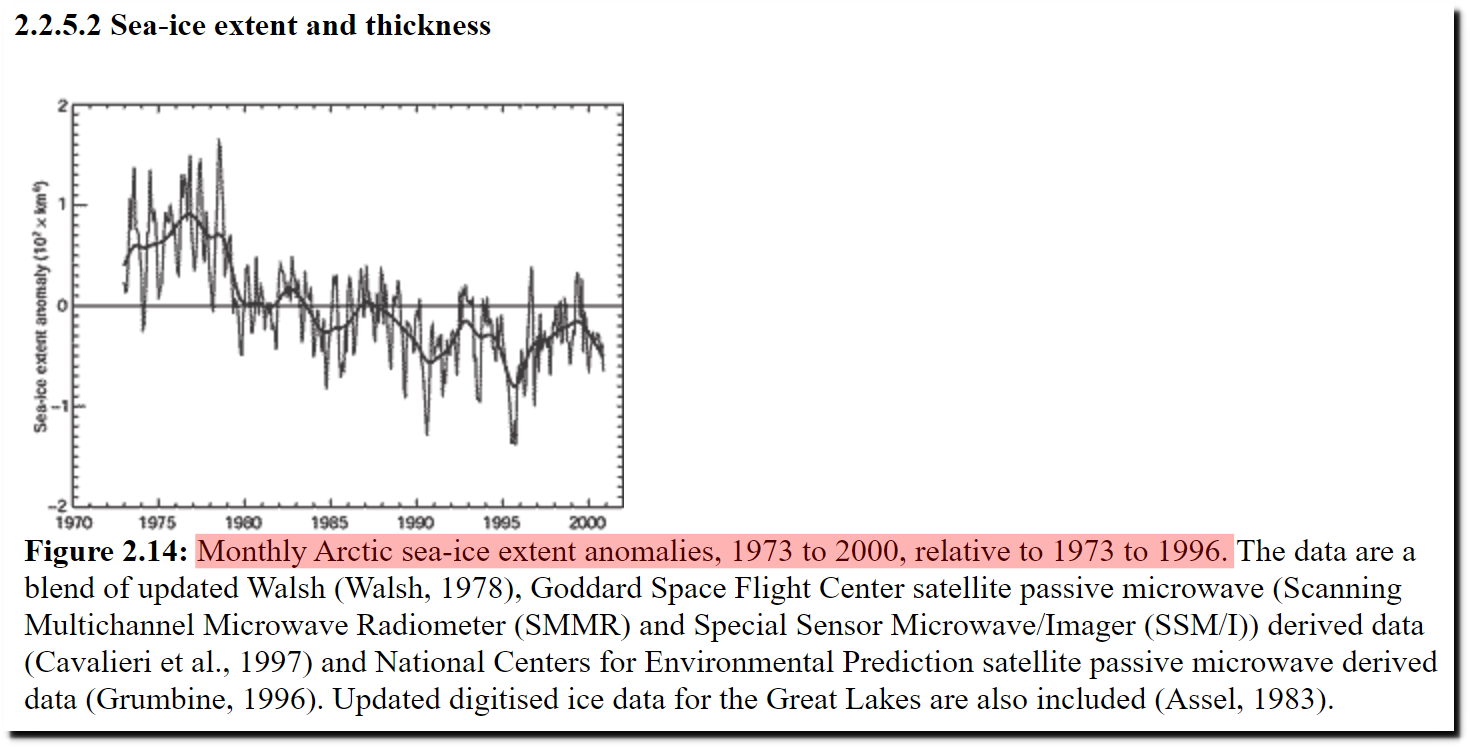
https://archive.ipcc.ch/ipccreports/tar/wg1/062.htm
In the 1985 DOE Report ice increased from the 1950s to the 1970s.
 Projecting the climatic effects of increasing carbon dioxide
in 1958, the USS Skate surfaced at the North Pole. Arctic sea ice averaged two meters thick.
The Changing Face of the Arctic; The Changing Face of the Arctic – The New York Times
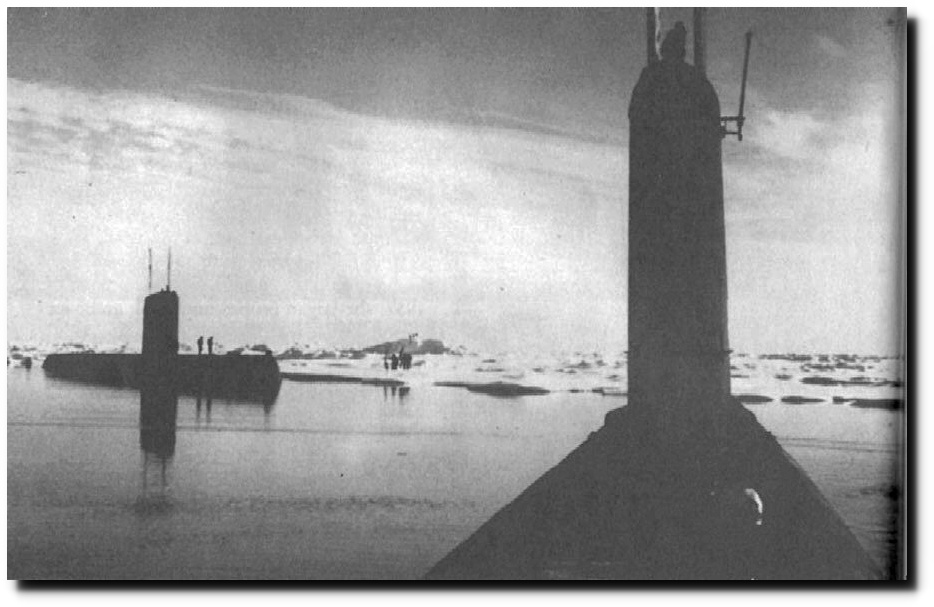
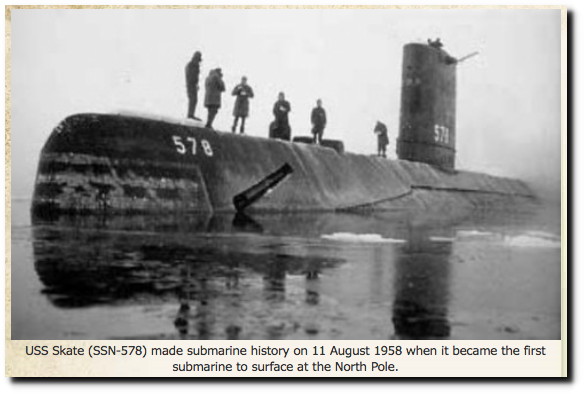
“At 9:47 p.m. Eastern Daylight Time on Aug. 11, 1958, the 265-foot-long Skate the third nuclear-powered submarine in the American fleet poked through a break in the ice near the North Pole. Soon after, Admiral Calvert, then a commander, radioed the news to headquarters in New London, Conn.”
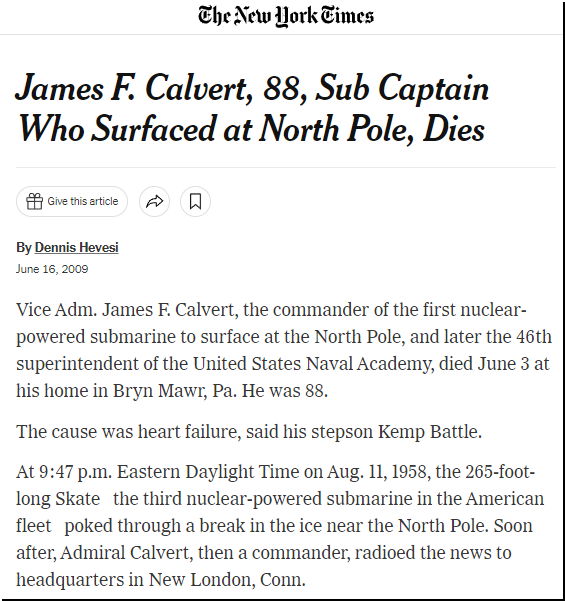
James F. Calvert, 88, Sub Captain Who Surfaced at North Pole, Dies – The New York Times
Now the ice is two meters thick.
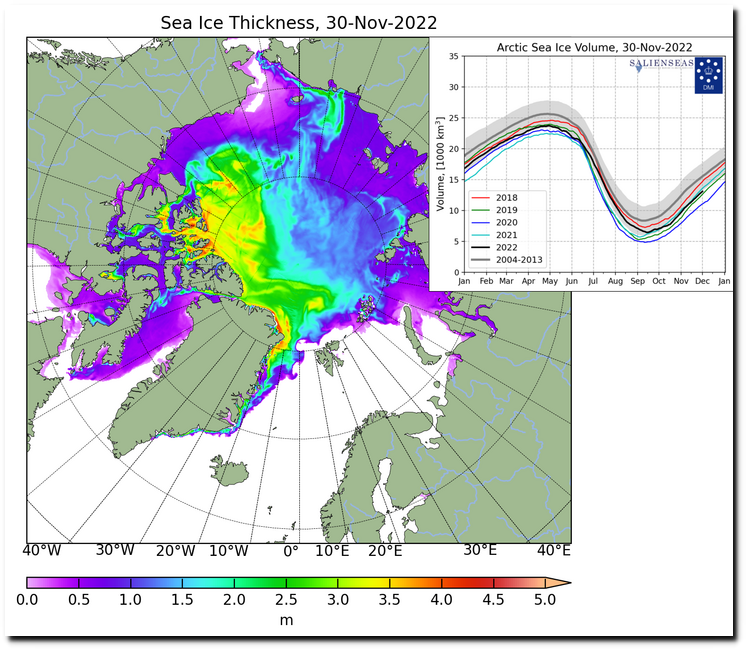
https://ocean.dmi.dk/arctic/icethickness/anim/plots_uk/CICE_combine_thick_SM_EN_20221130.png
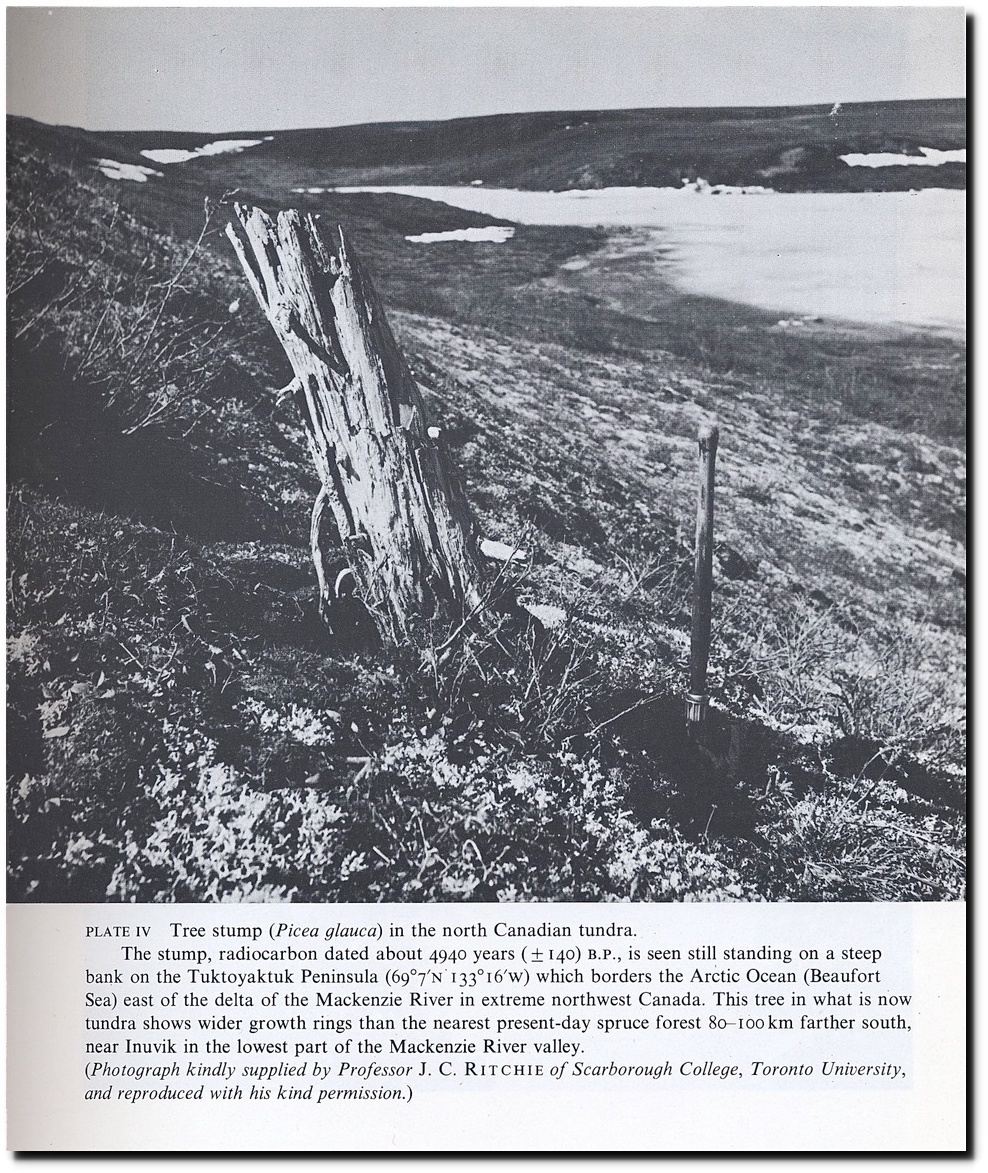
When Stonehenge was built, there was less ice in the Arctic and trees grew all the way to the edge of the Arctic Ocean.
Less Ice In Arctic Ocean 6000-7000 Years Ago — ScienceDaily
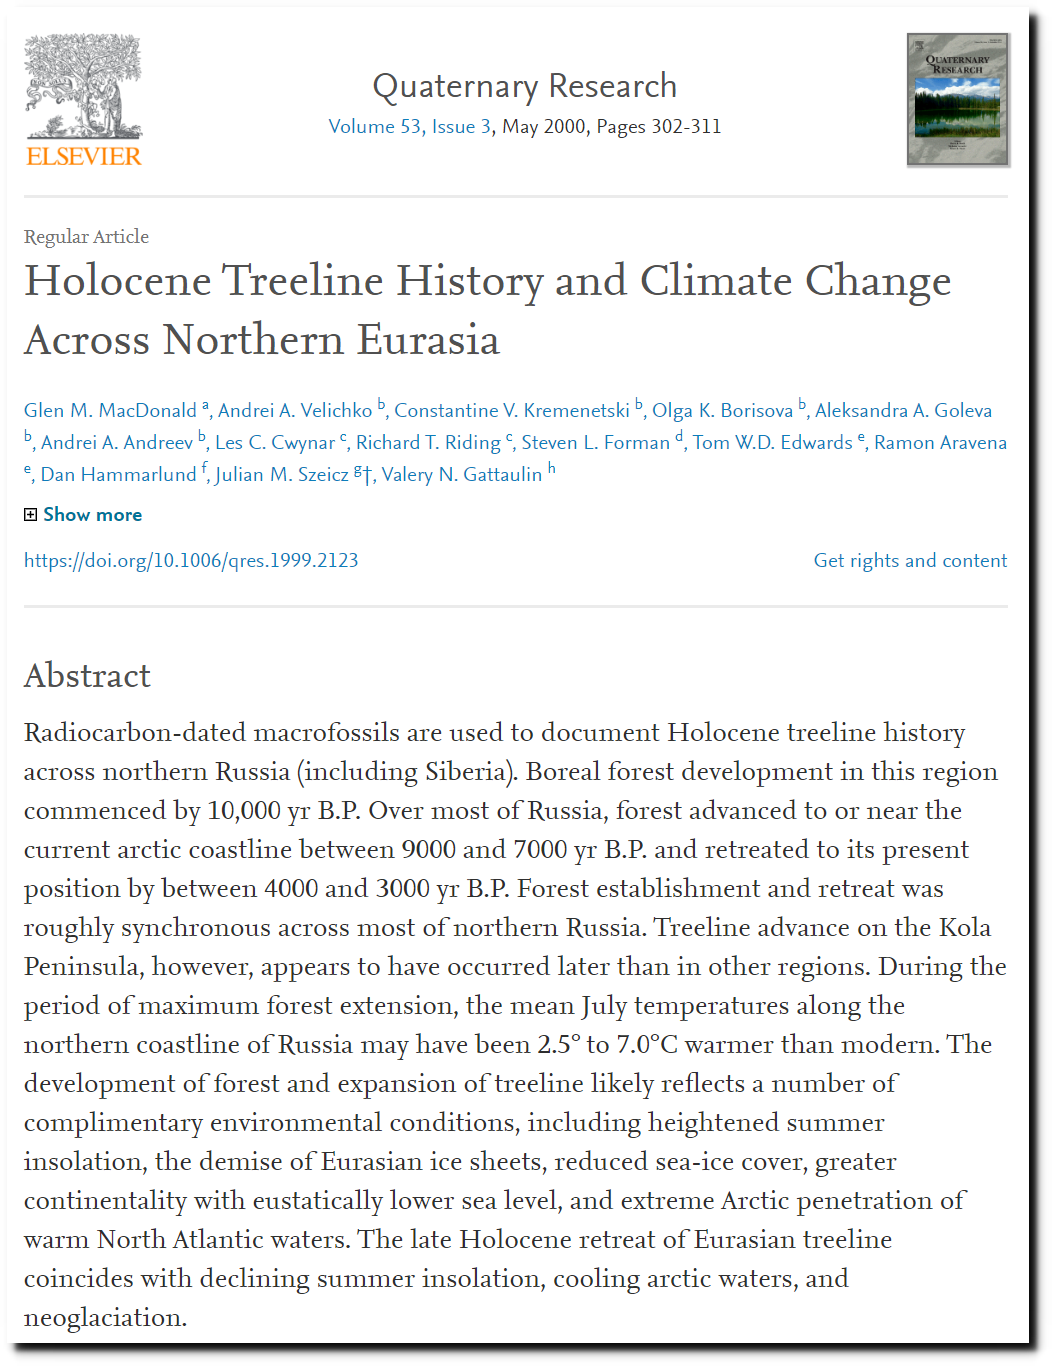
Holocene Treeline History and Climate Change Across Northern Eurasia – ScienceDirect
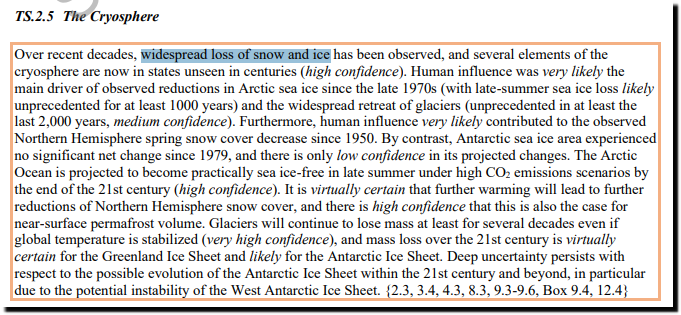
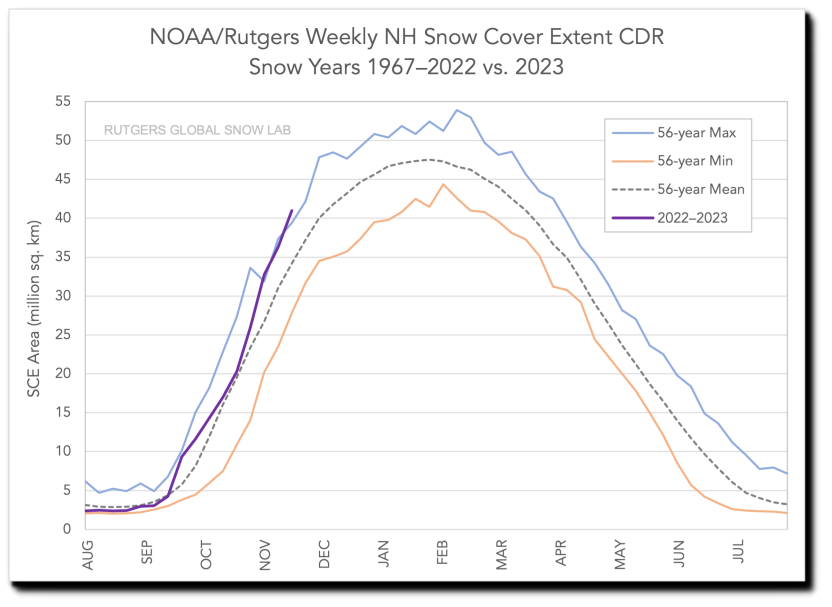
The current IPCC report says snow cover is declining due to human influence.
“Over recent decades, widespread loss of snow and ice has been observed, and several elements of the cryosphere are now in states unseen in centuries (high confidence). Human influence was very likely the main driver of observed reductions in Arctic sea ice since the late 1970s”
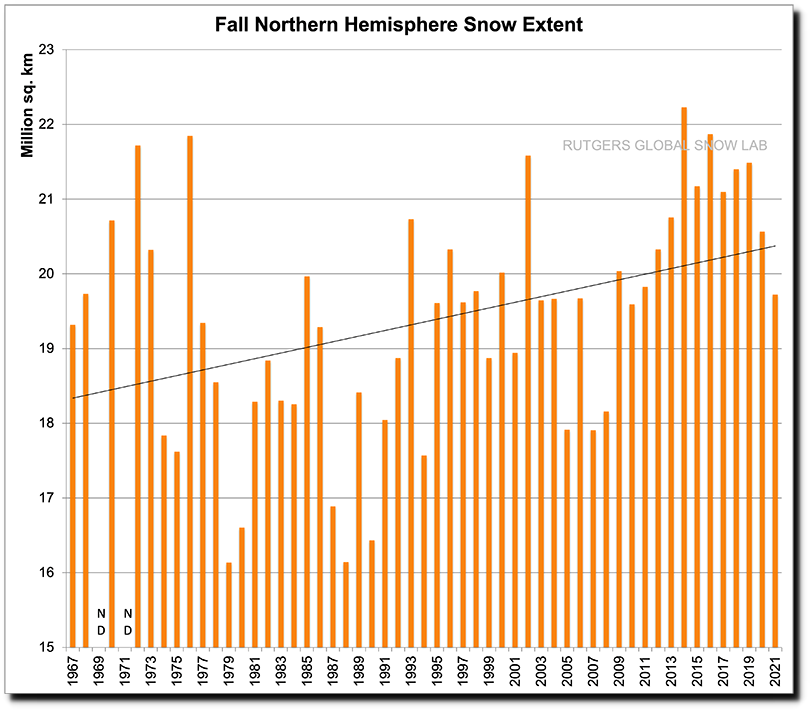
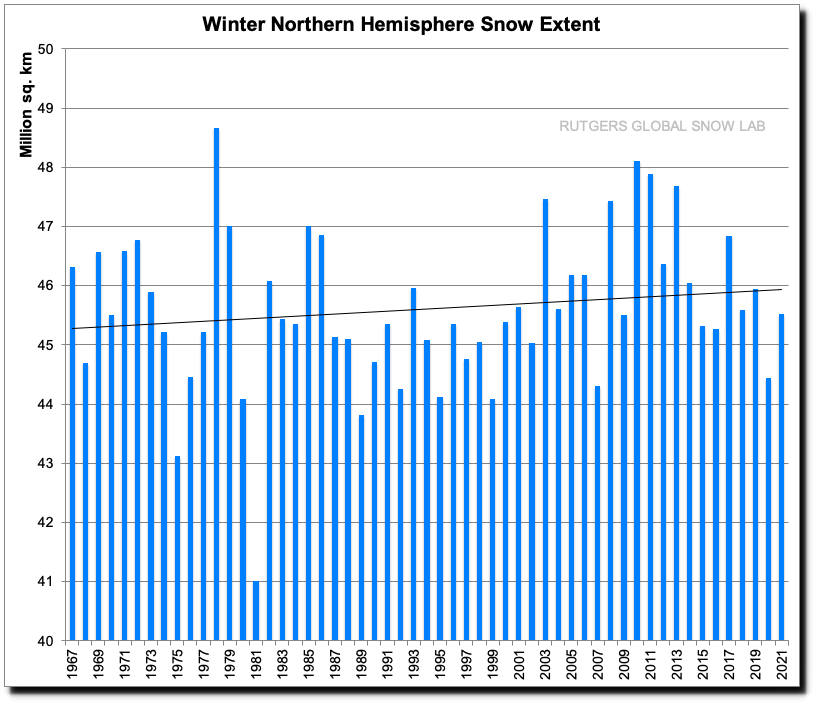
Rutgers University Climate Lab :: Global Snow Lab
Snow cover is at a record high.
![]()
![]()
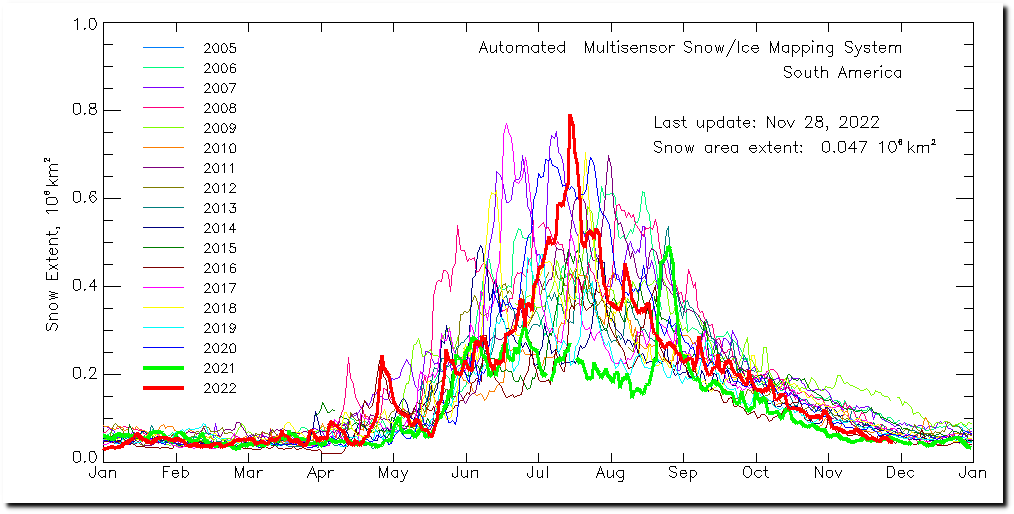
Snow cover in South America reached an all-time record high earlier this year.
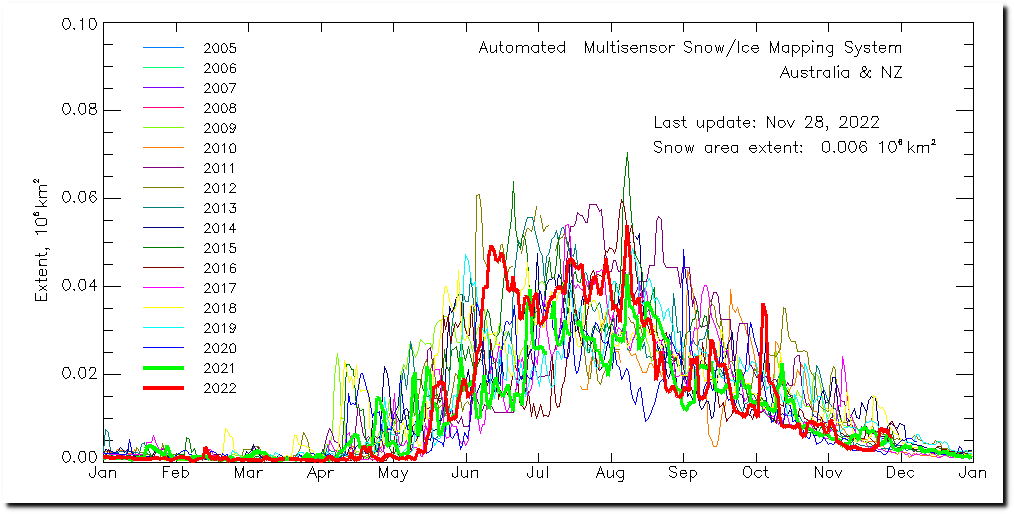
Snow cover in Australia and New Zealand has also been far above normal this year
