Valentines Day Trends

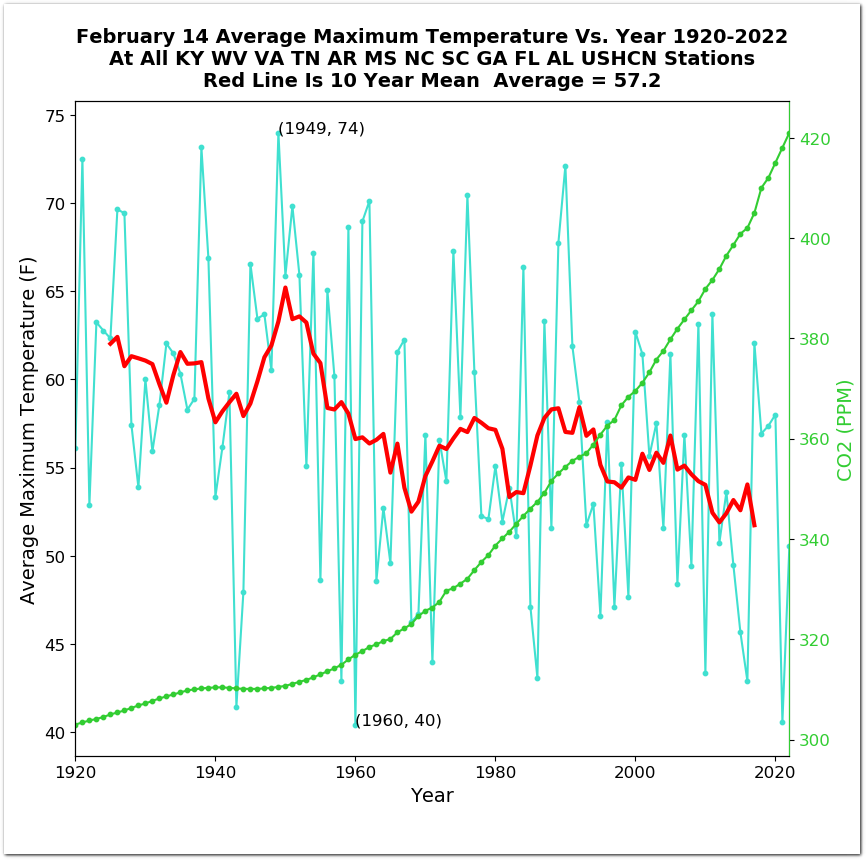
Valentines Day temperatures in the southeast US have declined nearly ten degrees over the past century as CO2 has increased.

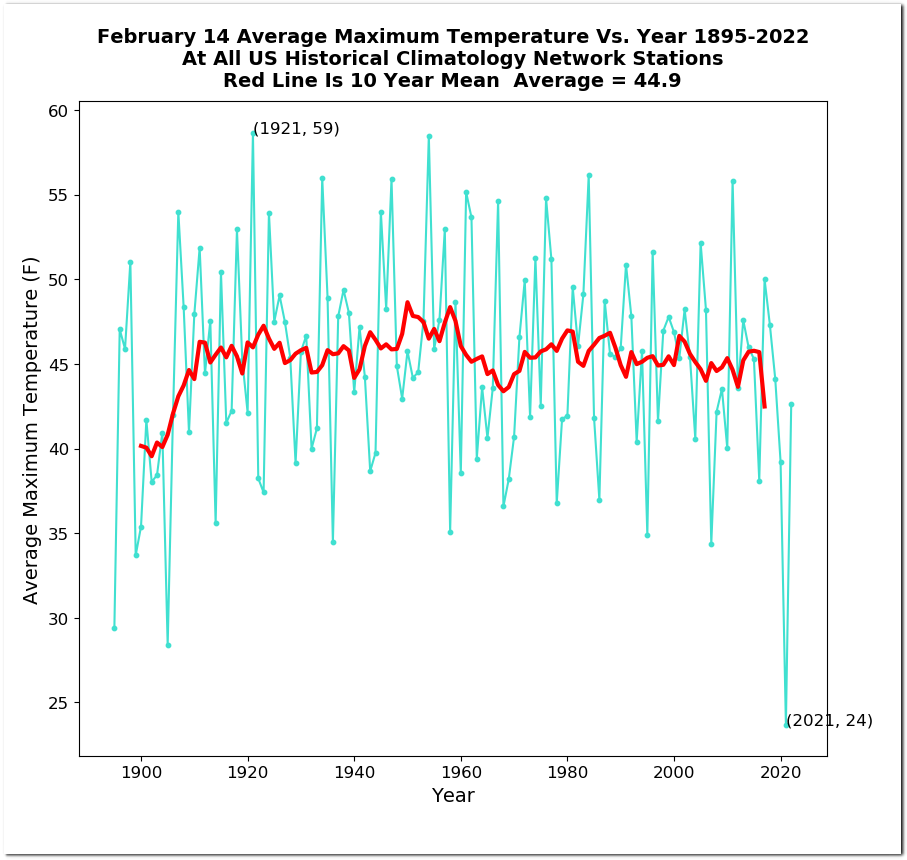
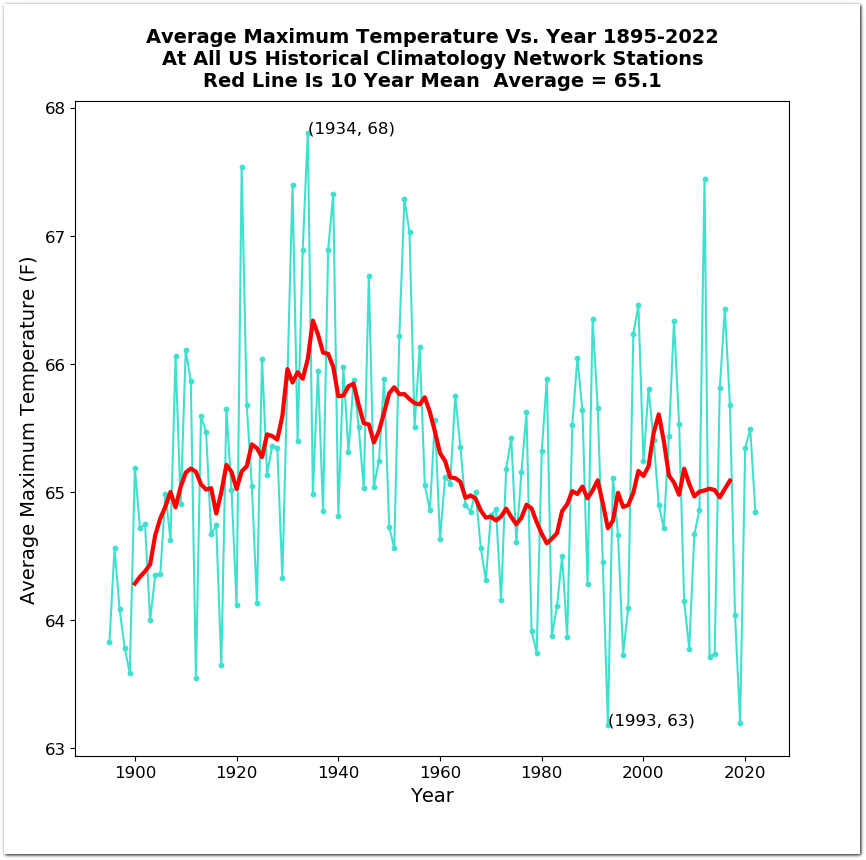
The warmest Valentines Day in the US occurred in 1921, which was the second warmest year in the US since 1895 after 1934. The coldest Valentines Day was a century later in 2021.

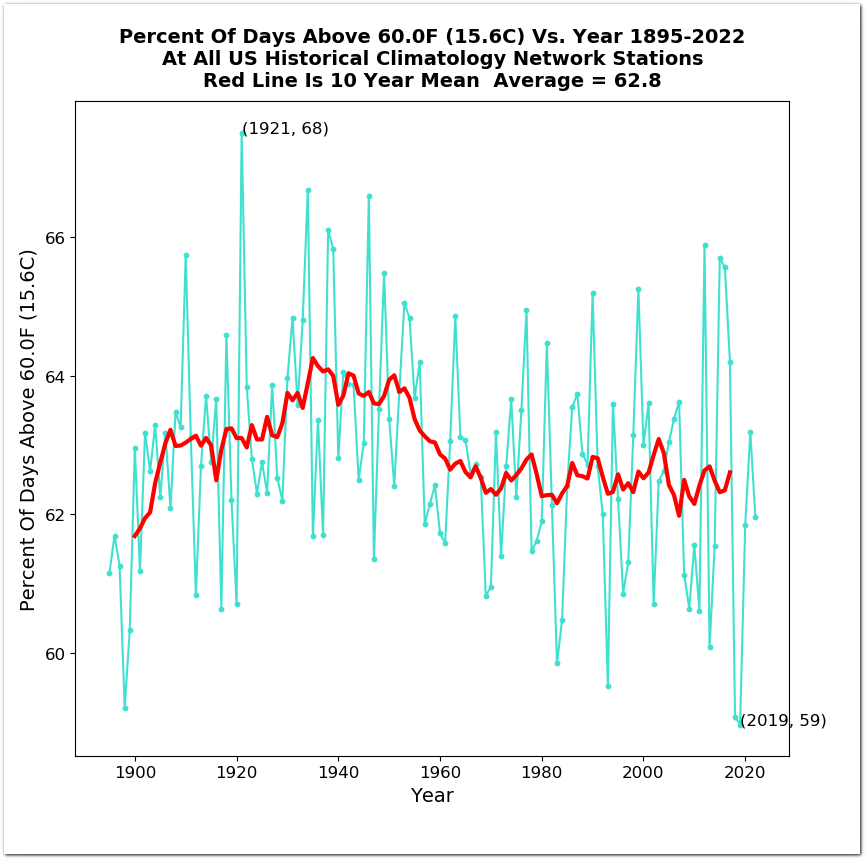
The percent of days over 60F during 1921 was the highest since 1895.

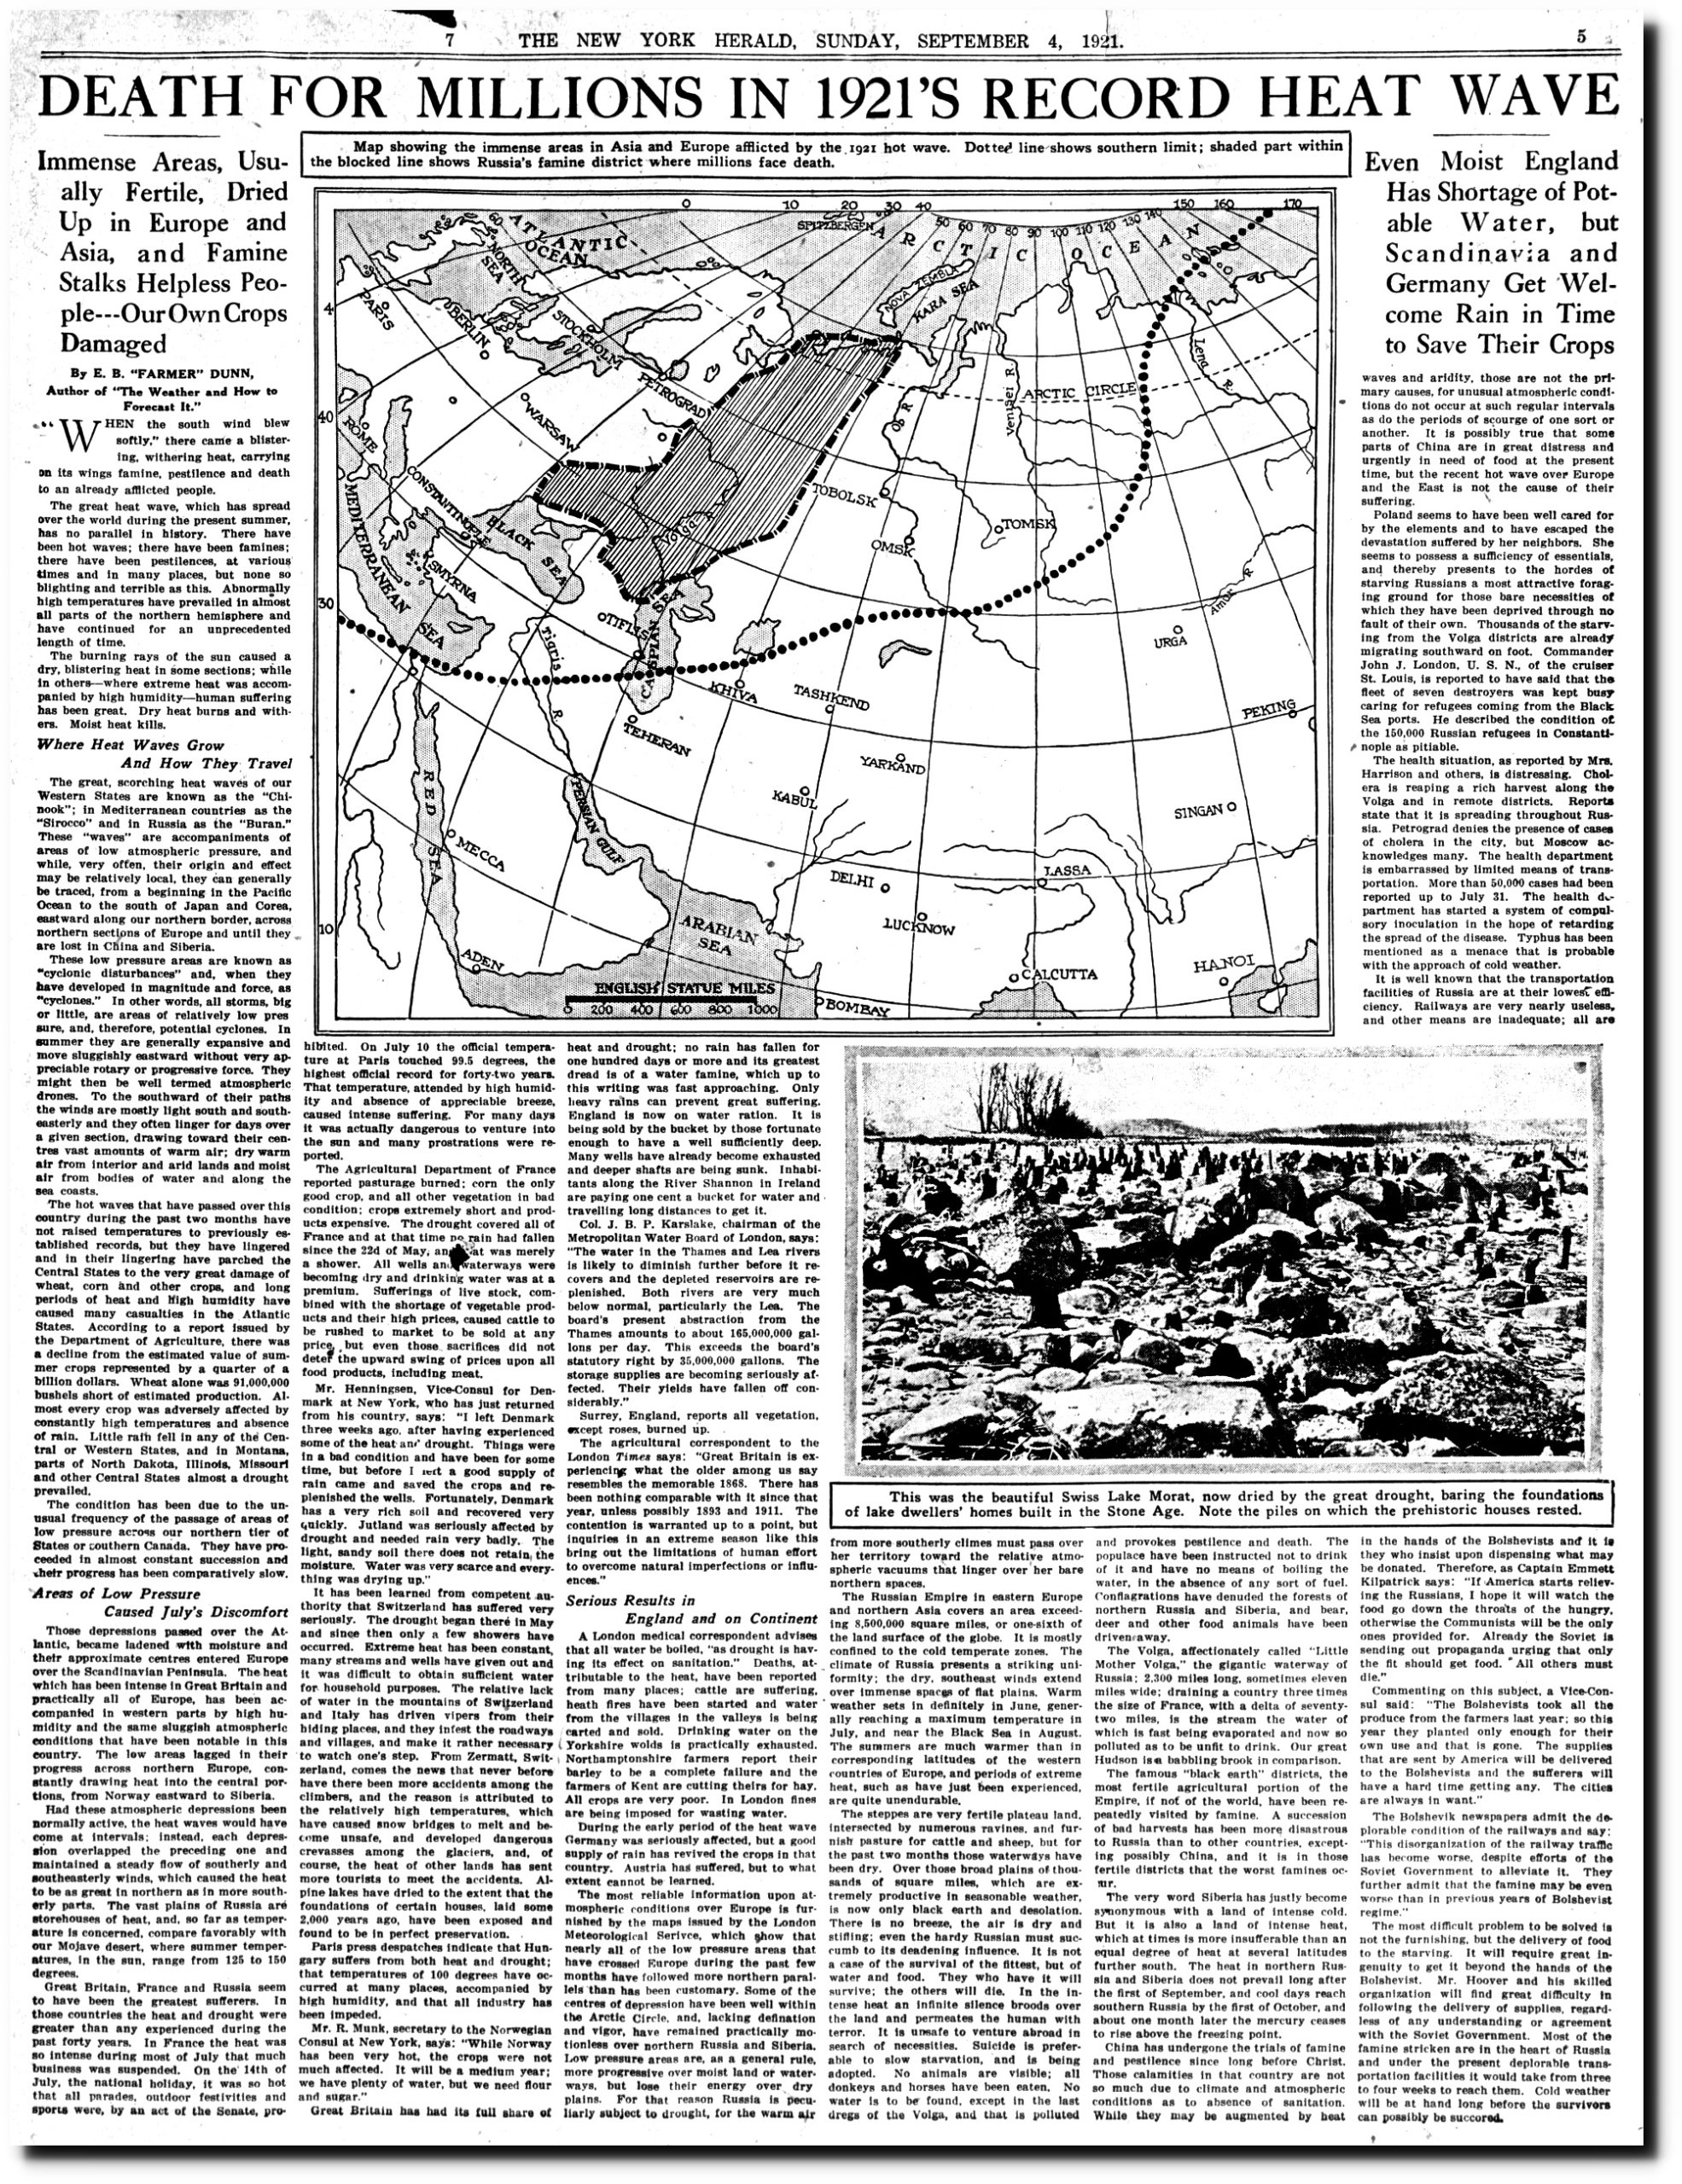
The heatwave of 1921 extended around the world.

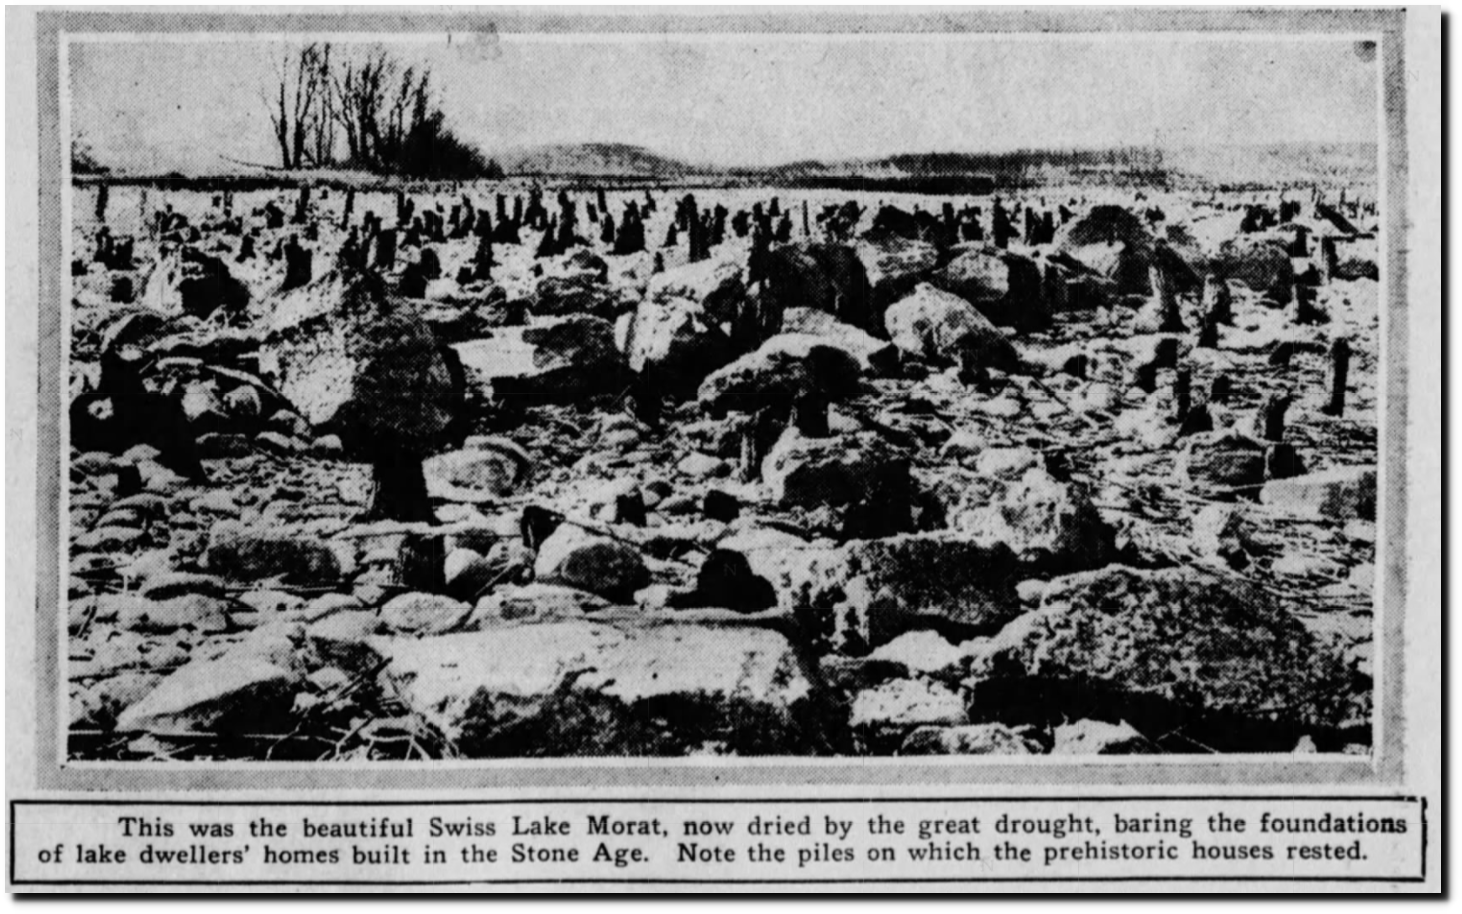
Switzerland’s Lake Morat dried up.

04 Sep 1921, 61 – New York Herald at Newspapers.com

There was a large solar storm on May 15 of that year.

The Great Storm of May 1921: An Exemplar of a Dangerous Space Weather Event – Hapgood – 2019 – Space Weather – Wiley Online Library


(PDF) The 1859 space weather event revisited: Limits of extreme activity

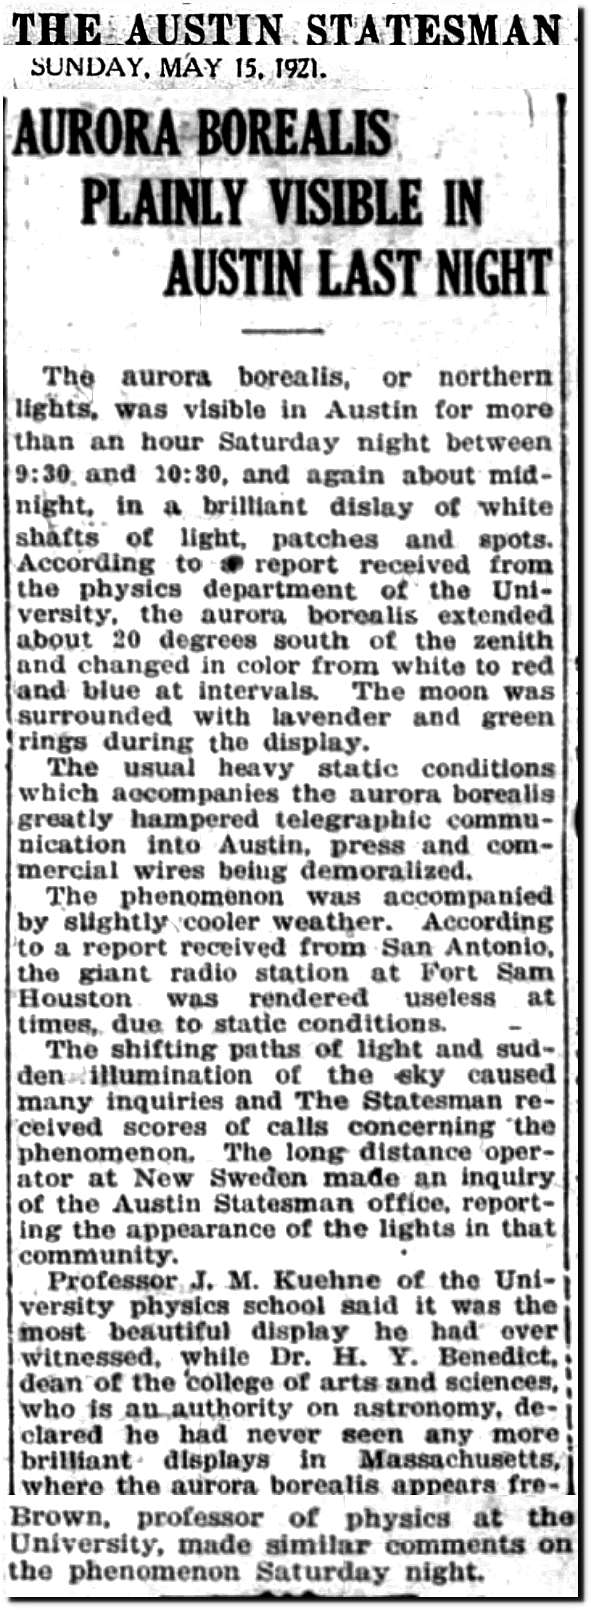
15 May 1921, 7 – Austin American-Statesman at Newspapers.com

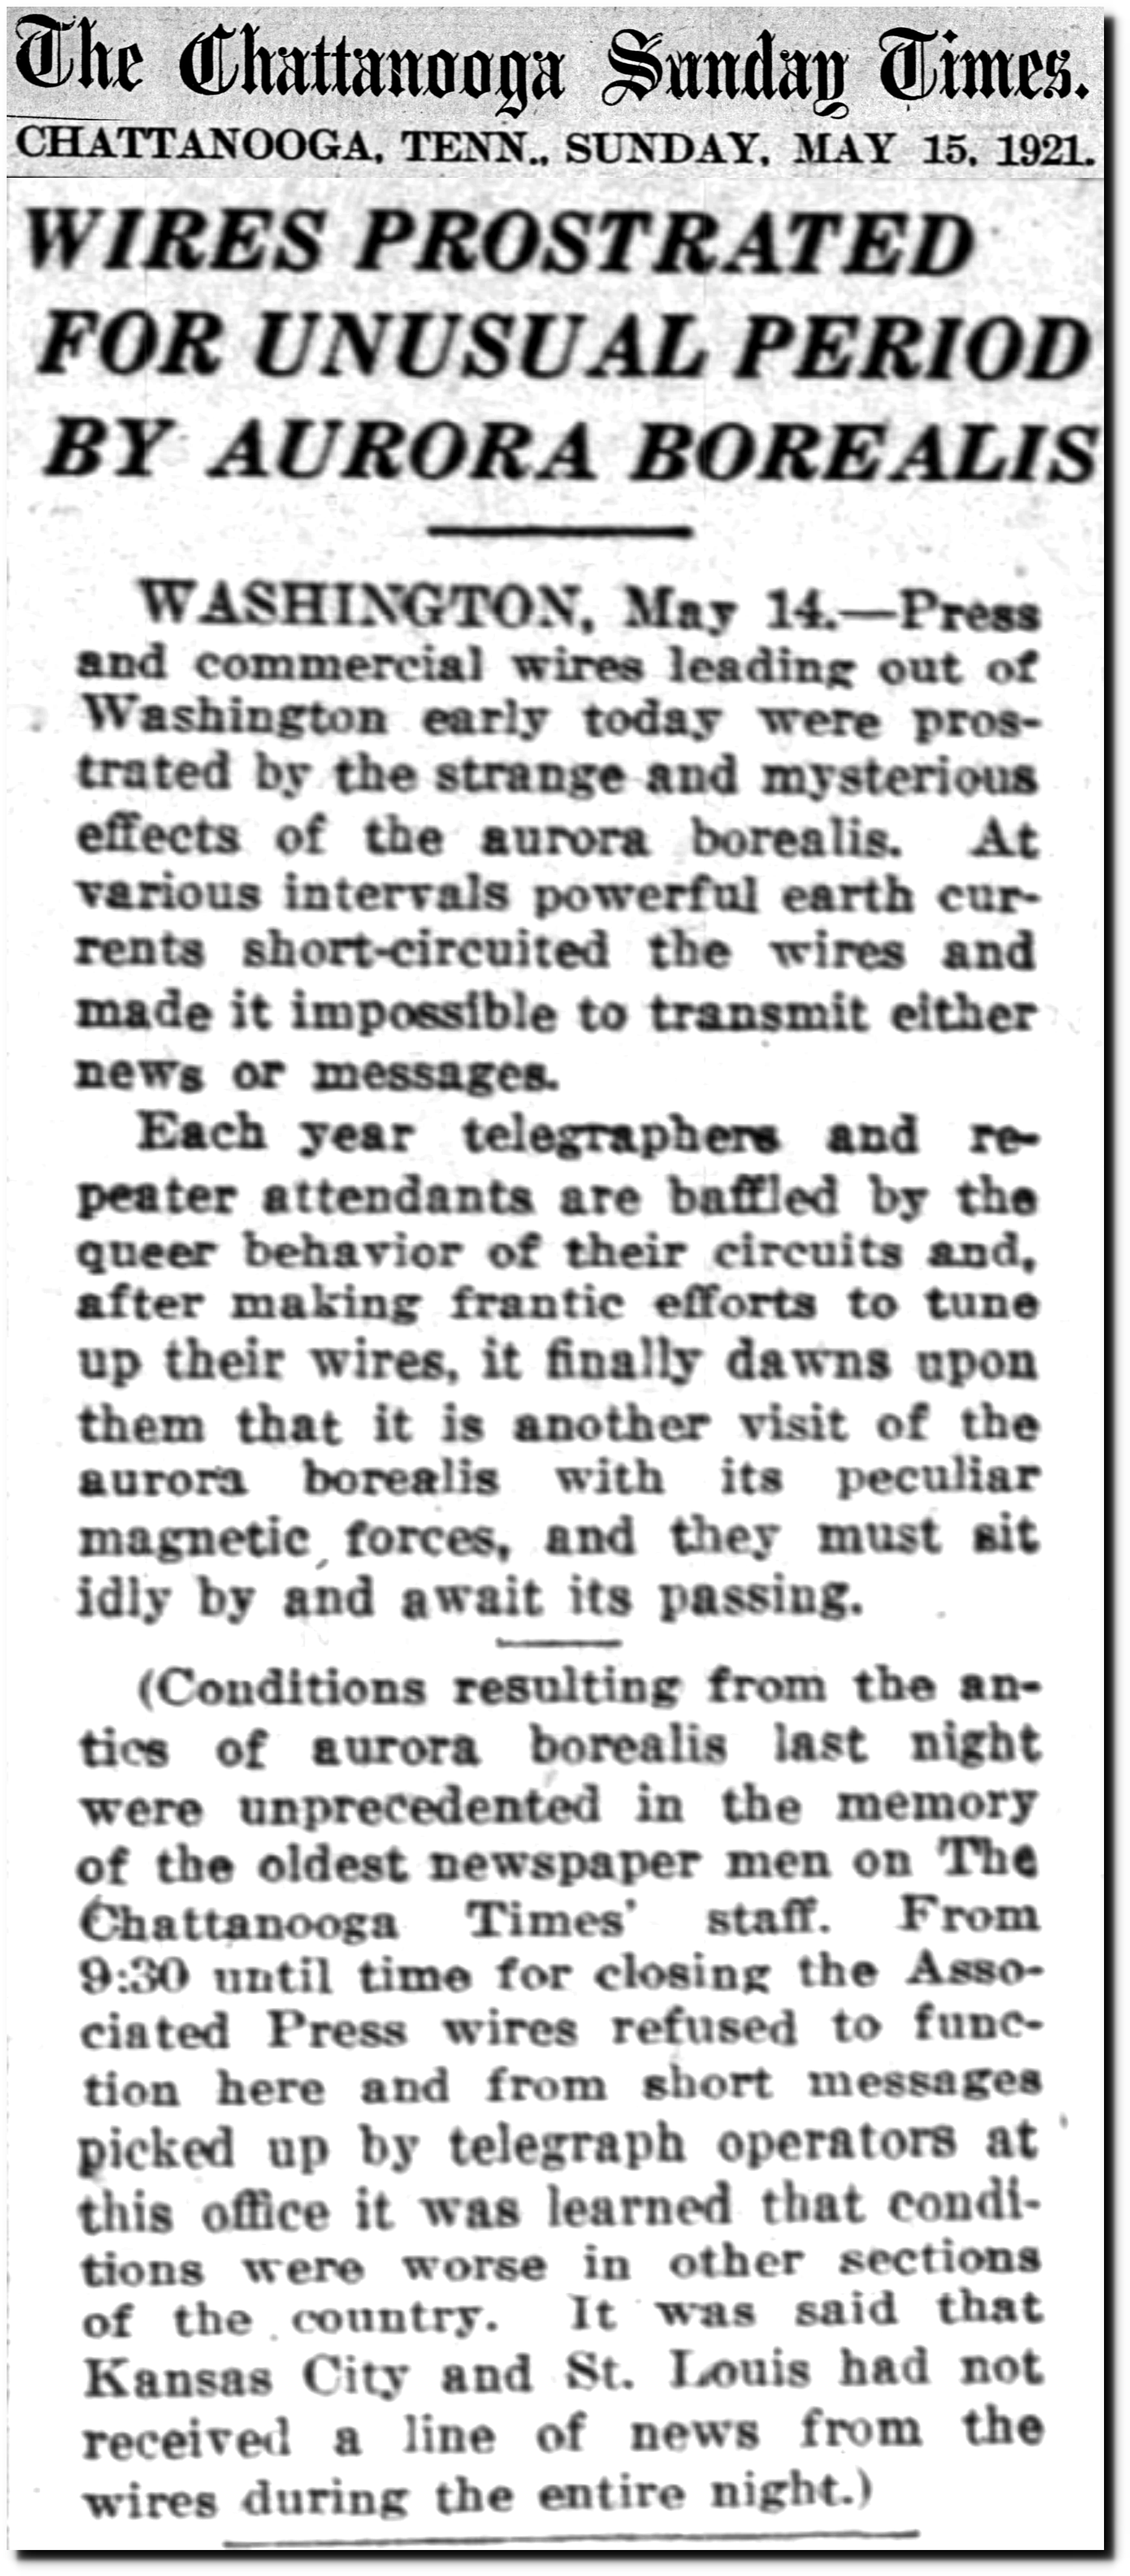
15 May 1921, 1 – Chattanooga Daily Times at Newspapers.com

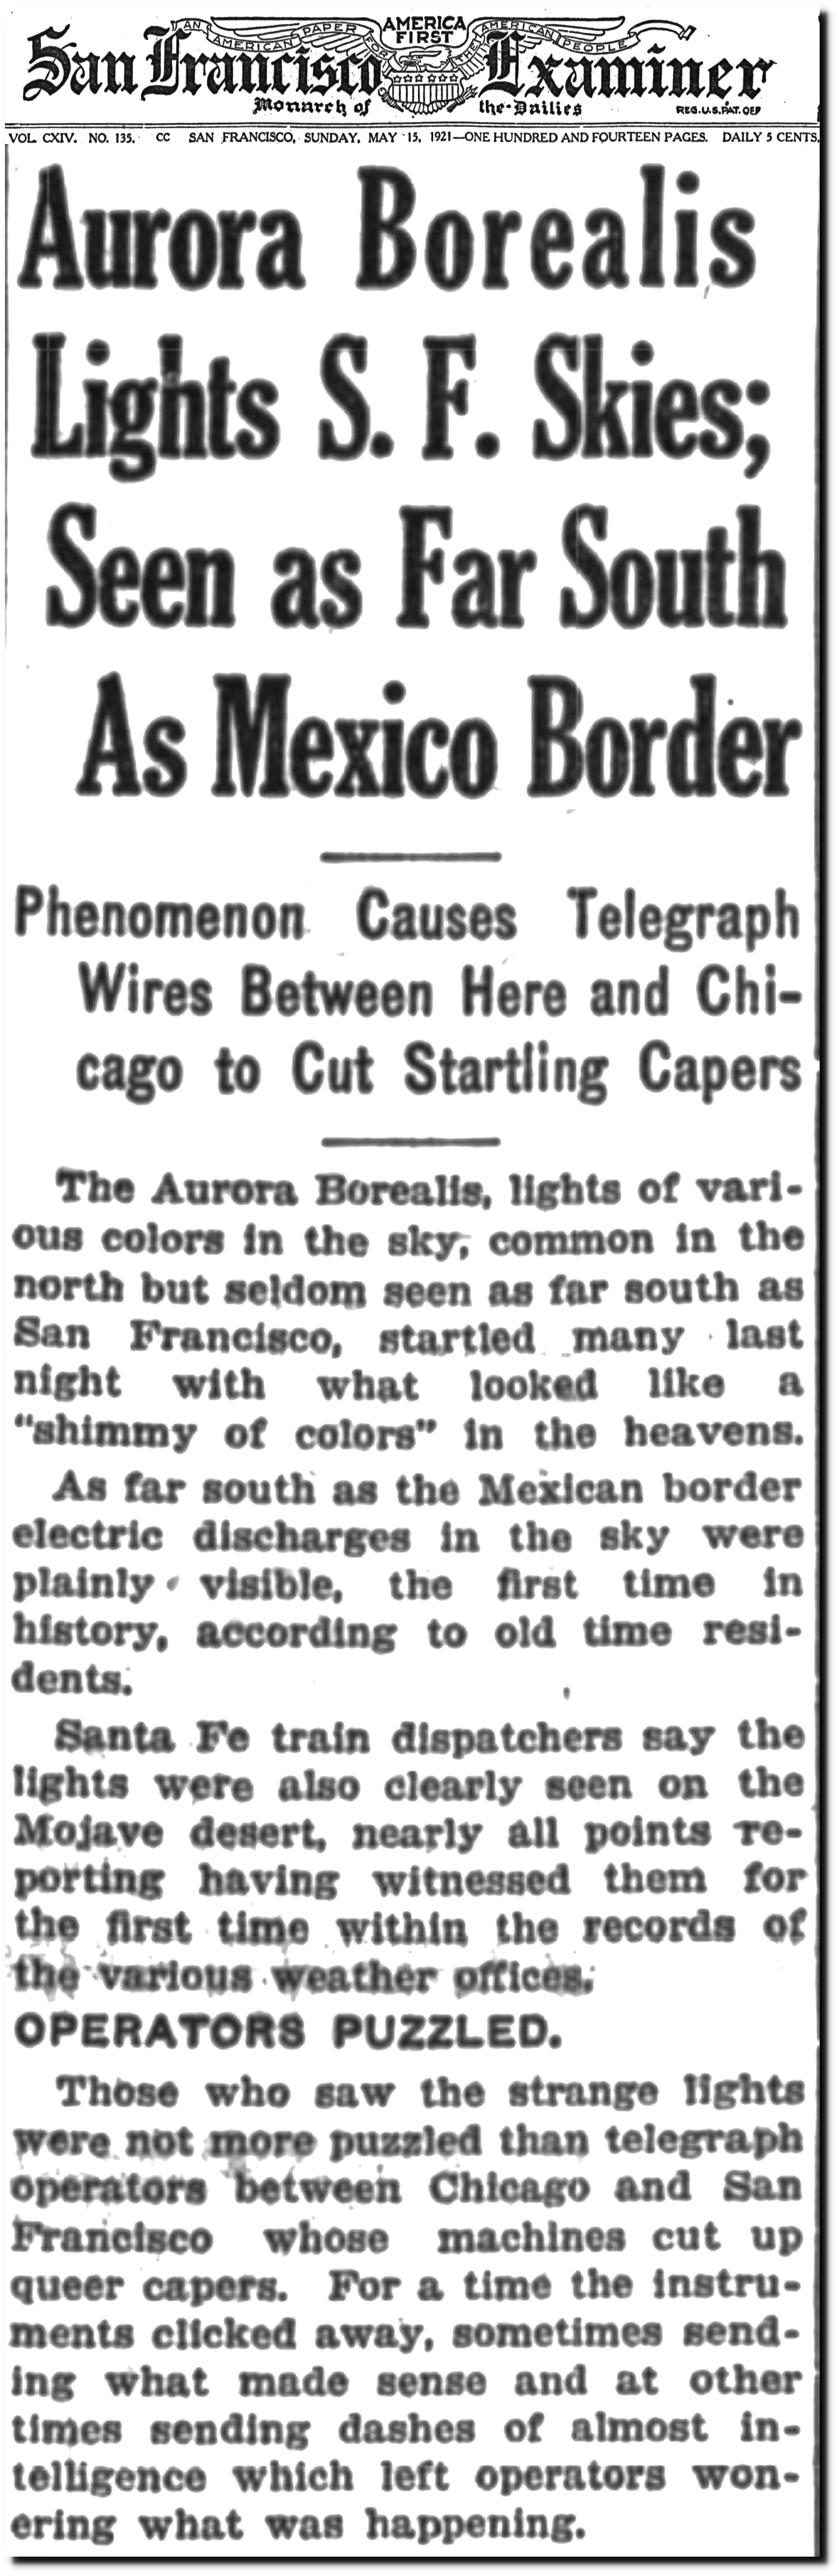
15 May 1921, 55 – The San Francisco Examiner at Newspapers.com

NASA says 1921 was one of the coldest years on record.

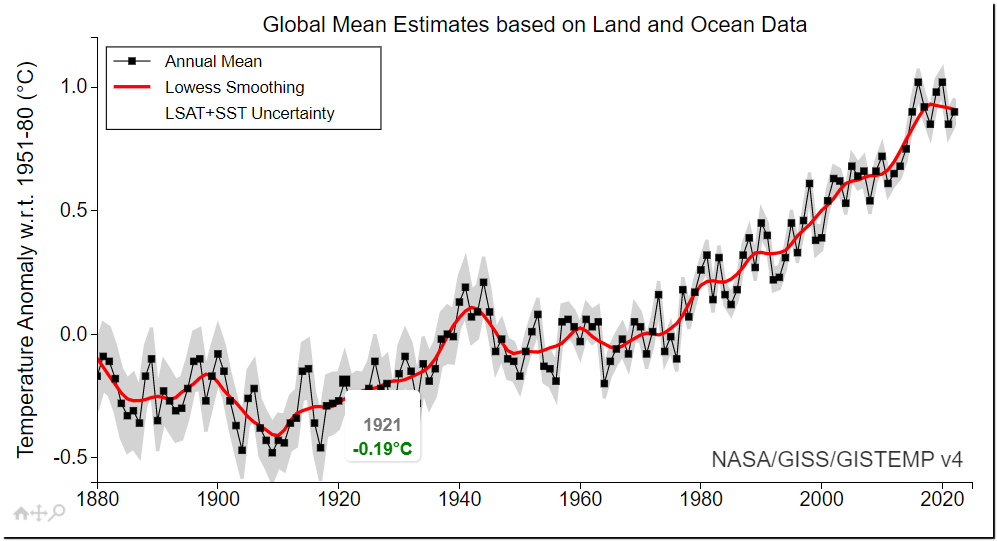
Data.GISS: GISS Surface Temperature Analysis (v4): Analysis Graphs and Plots

This entry was posted in Uncategorized. Bookmark the permalink.

4 Responses to Valentines Day Trends

  1. GWS says:

    One would think that with evidence like this that the theory that CO2 concentrations naturally drive global temperatures higher and higher would be trashed by now; but no, the left continues to lie, cheat, and steal to keep it alive in the minds of the woke and unread and everyone else they can brainwash. — “Evidence? I get all my evidence from the NYT, CNN, and the DNC! But, I repeat myself”

  2. arn says:

    i was a bit worried about Seymour Hershs age and that others may have tried to exploit this(especially as high ranked politicians are directly named,as terror attacks in the name of the white house usually do not happen with direct participation of high level politicians.and usually use proxies,but considering how openly they talked about taking out north stream they stopped worrying) ,but todays interview shows that he is in the best possible shape
    for an 85 year old.
    https://www.youtube.com/watch?v=d4BuMaGlKp0

    Here another take,from a different perpsective
    especially 31:40 is very useful for those with cheap excuses
    https://www.youtube.com/watch?v=_Fv_nKyF_5g

  3. Ulric Lyons says:

    Both grand solar minima and active solar periods occur in a series on an 863 year cycle which also major solar storms conform to.
    775 + 863 = 1638, there were strong southerly aurora seen in Asia in 1638 and 1648.
    994 + 863 = 1857, 2 years before the Carrington event.
    1052 + 863 = 1915, with major solar storms in 1906 and 1921.
    The great aurora of 1192 could see a return around the 2050’s.

    https://en.wikipedia.org/wiki/List_of_solar_storms

  4. Ken Barber says:

    I wish I could use your “hiding the decline” software that you released some years ago.

    Sadly, it will no longer compile in Python.

    Also, the link to the temperature database no longer works.

Leave a Reply

Your email address will not be published. Required fields are marked *