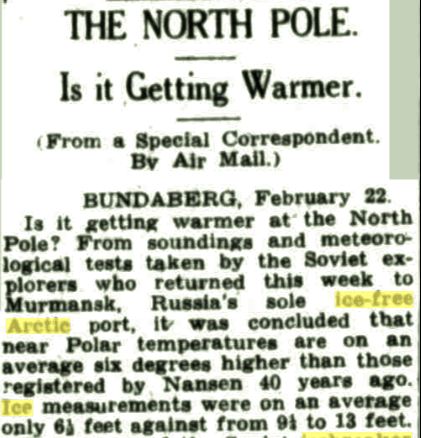
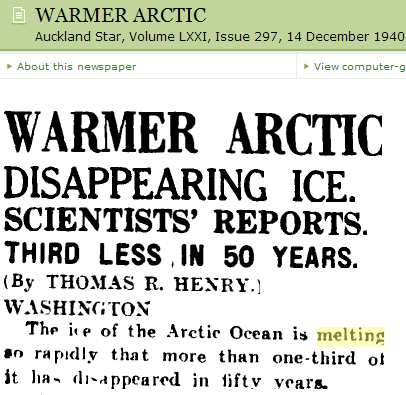
Papers Past — Auckland Star — 14 December 1940 — WARMER ARCTIC
Disrupting the Borg is expensive and time consuming!
Google Search
-
Recent Posts
- Fact Checking NASA
- Fact Checking Grok
- Fact Checking The New York Times
- New Visitech Features
- Ice-Free Arctic By 2014
- Debt-Free US Treasury Forecast
- Analyzing Big City Crime (Part 2)
- Analyzing Big City Crime
- UK Migration Caused By Global Warming
- Climate Attribution In Greece
- “Brown: ’50 days to save world'”
- The Catastrophic Influence of Bovine Methane Emissions on Extraterrestrial Climate Patterns
- Posting On X
- Seventeen Years Of Fun
- The Importance Of Good Tools
- Temperature Shifts At Blue Hill, MA
- CO2²
- Time Of Observation Bias
- Climate Scamming For Profit
- Climate Scamming For Profit
- Back To The Future
- “records going back to 1961”
- Analyzing Rainfall At Asheville
- Historical Weather Analysis With Visitech
- “American Summers Are Starting to Feel Like Winter”
Recent Comments
- arn on Fact Checking NASA
- Gordon Vigurs on Fact Checking NASA
- Bob G on Fact Checking NASA
- Bob G on Fact Checking NASA
- arn on Fact Checking NASA
- conrad ziefle on Fact Checking NASA
- conrad ziefle on Fact Checking NASA
- arn on Fact Checking NASA
- Bob G on Fact Checking NASA
- Bob G on Fact Checking NASA


Sounds like the 1940’s were the peak of the last cycle; about 60 years ago. Funny that.
Who was it who chose 30 years as a basis for measuring climate?
Whoever it was chose the worst possible basis period.
The 1930’s, and 1940’s are a dirty little secret, because if you start you charts from those years, there is no warming at all. It is far better to wait unti 1979, after 35 years of global cooling.
http://www.csiro.au/Outcomes/Climate/Understanding/State-of-the-Climate-2014.aspx
CSIRO hasn’t modified it’s carbon tax and shoddy “science” peddling one bit.
Every summary page contains errors of such magnitude the entire report is compromised.
Examples:
From Atmosphere and Cryosphere summary:
“Arctic summer minimum sea-ice extent has declined by between 9.4 and 13.6 per cent per decade since 1979, a rate that is likely unprecedented in at least the past 1,450 years.”
I was unaware that CSIRO has 1450 years of Arctic satellite sea ice data records. Excellent. Let’s see them.
Frome Oceans summary:
“Rates of sea-level rise vary around the Australian region, with higher sea-level rise observed in the north and rates similar to the global average observed in the south and east.”
Anyone with high school physics knowledge knows this is a false observation. A connected ocean cannot rise continuously on one side of Australia and less on the other side. It defies gravity – you morons.
“Ocean acidity levels have increased since the 1800s due to increased CO2 absorption from the atmosphere.”
Since the oceans have a pH of 8.3 ish, they are alkaline, not acidic. And the oceans are a buffered solution due to salt content. Any metallurgist in the Kalgoorlie Goldfields knows how difficult it is to modify the pH of a salt buffered solution.
I could go on, but these guys make me sick. Especially since the Australian taxpayer if paying their salaries, travel expenses, and trips to Antarctica. There needs to be a royal commission into who from CSIRO is being influenced by the Carbon Credit fraternity.
Australia’s Erratic Rainfall 1965 – Peter Samuel.
“Our average rainfall is 16 inches compared to the world average of 26 inches; over 90 per cent of Australia, evaporation is greater than rainfall, the runoff of our rivers is equivalent to a mere 1 1/3 inches of the rain that falls compared with 8 inches in the United States, and the Murray river system has a flow of about 10 million acre feet of
water each year compared with the Mississippi’s 480 million.”
http://trove.nla.gov.au/ndp/del/article/131830244
“In the 100 years since then (1860) rainfall fluctuations have allowed the researchers to identify seven “major and wide spread droughts”: in the mid 1860s, in the first half of the 1880s, in 1888, from 1895 onward to a climax in 1902, in the first half of the 1910s,
1918-20, and finally during the years of the second World War, especially 1944 and
1945.”
It seems to me that geographers and weathermen of the 1960’s knew so much more, than do all the current “researchers” at CSIRO and BOM. Their observations were accurate for their time. Current ‘observations’ are tortured adjustments of reality.
Peter Samuel identified “alarmists” in 1965!
Chicken Little is a persistent pest in Australia’s unique biodiversity.
“There is therefore a fairly strong possibility of total losses of £70 million and upwards, due to the drought. This is, to put it mildly, not a nice prospect.
But it hardly adds up to being a “calamity” or a “national disaster” or any of the other alarmist words which are being shouted so loudly by some. Our economy is about five-sixths non – agricultural these days and we are fairly accustomed to severe fluctuations in agricultural income. As a nation we have to live with them.”
http://trove.nla.gov.au/ndp/del/article/131830411
I note that Peter Samuel’s 1965 drought map looks almost identical to the current BOM drought map for Australia. And morons at BOM/CSIRO said that Australia is doomed!! Nothing much has changed in Australia’s climate after 230 years of european settlement.
Peter Samuel’s Third Article on Australia’s Erratic Rainfall (3 July 1965)
http://trove.nla.gov.au/ndp/del/article/105759024
“For the longer term we need much more physical and statistical research into the weather. CSIRO has a group of 14 scientists working at Aspendale in Victoria on “exchange processes” and this should eventually throw light on the nature of weather patterns and among other things, on what causes droughts. No doubt this work could be stepped up. Statistical work seems to be the most neglected. The last up-to-date work was published in 1955 and current meteorological data is not, unfortunately, processed in order to show the severity of drought conditions as they develop. Farmers would be equipped to make much better decisions if they knew more about the precise variability, and distribution of rainfall, and if they were provided with meteorological data telling them the probability of their getting rain within different time spans.”
CSIRO published their “State of Climate” today. After over 50 years of highly expensive research activity, the hundreds of CSIRO scientists are doing the same thing and coming up with statistical alarmist nonsense. We should be able to do better than that.