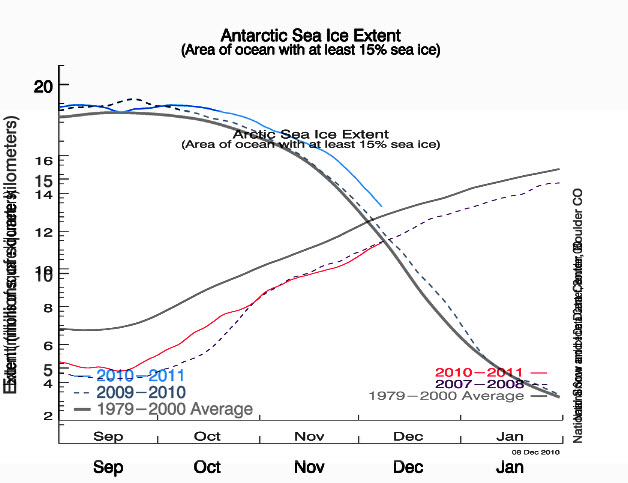
The poles are in a death spiral, but are healthier than normal as they die.
Disrupting the Borg is expensive and time consuming!
Google Search
-
Recent Posts
- Analyzing The Western Water Crisis
- Gaslighting 1924
- “Why Do You Resist?”
- Climate Attribution Model
- Fact Checking NASA
- Fact Checking Grok
- Fact Checking The New York Times
- New Visitech Features
- Ice-Free Arctic By 2014
- Debt-Free US Treasury Forecast
- Analyzing Big City Crime (Part 2)
- Analyzing Big City Crime
- UK Migration Caused By Global Warming
- Climate Attribution In Greece
- “Brown: ’50 days to save world'”
- The Catastrophic Influence of Bovine Methane Emissions on Extraterrestrial Climate Patterns
- Posting On X
- Seventeen Years Of Fun
- The Importance Of Good Tools
- Temperature Shifts At Blue Hill, MA
- CO2²
- Time Of Observation Bias
- Climate Scamming For Profit
- Climate Scamming For Profit
- Back To The Future
Recent Comments
- conrad ziefle on Analyzing The Western Water Crisis
- Bob G on Analyzing The Western Water Crisis
- Bob G on Analyzing The Western Water Crisis
- Bob G on Analyzing The Western Water Crisis
- arn on Analyzing The Western Water Crisis
- Scott Allen on Analyzing The Western Water Crisis
- conrad ziefle on Analyzing The Western Water Crisis
- conrad ziefle on Analyzing The Western Water Crisis
- Bob G on Analyzing The Western Water Crisis
- Bob G on Analyzing The Western Water Crisis


yah! And that’s a lot of rye and vermouth!!!
More than 1000 dissenting scientists have now challenged the IPCC’s claims.
Check out some of the comments below – they really are scathing.
Perhaps Tony D would like to comment as he holds so much respect for scientists.
http://wattsupwiththat.com/2010/12/08/shredding-the-climate-consensus-myth-more-than-1000-international-scientists-dissent-over-man-made-global-warming-claims-challenge-un-ipcc-gore/#more-29110
Hey Steven, even funnier, bigger lies are better!
?
This is a wonderfully instructive graph, the scales are lined up well, and I hate to be such a complainer, but somewhere in the legend or caption it should say that the red line is Arctic sea ice extent, and the blue line is Antarctic sea ice extent. It should be obvious, but it won’t be for everyone. On my screen the label “Arctic Sea Ice Extent” falls right on the blue Antarctic curve. Sorry I didn’t catch that before.
That chart boggles my undersized brain, but anything you say, Steve.