Hi, everyone.
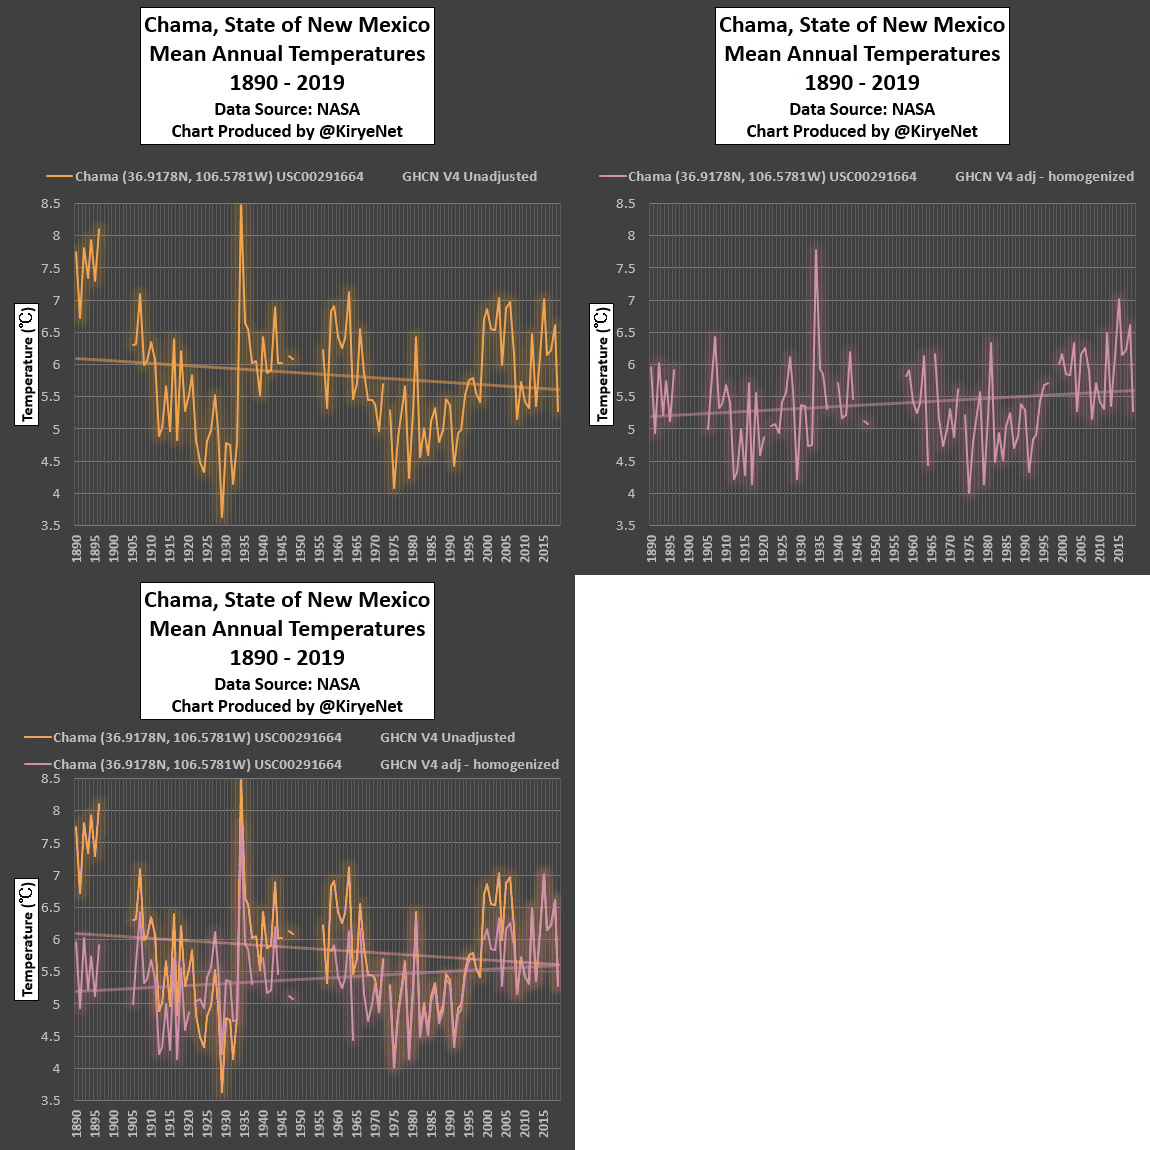
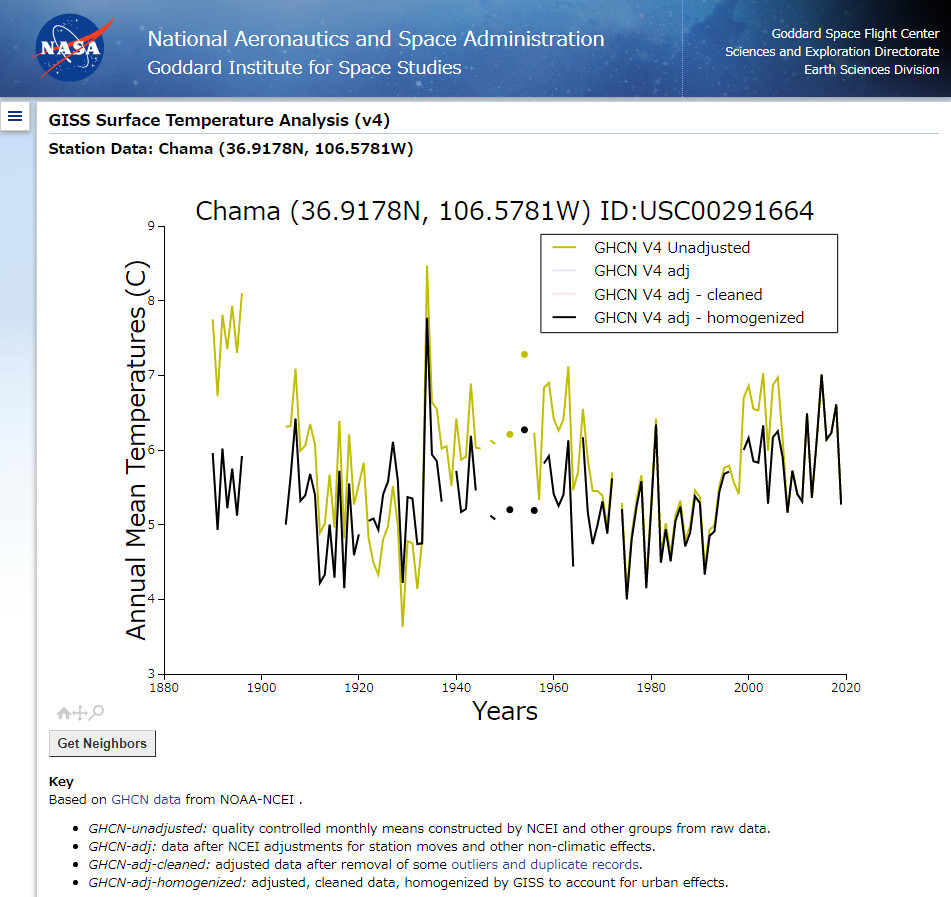
Today, I’d like to show you the animation chart below using the data from the NASA website.
As shown on the chart, the annual temperature in Chama, New Mexico has had a cooling trend of approximately 0.5? since 1890, but NASA changed the data.
You might have already seen a lot of similar cases. Examples: here and here.
Unfortunately, many people still haven’t heard any such reports from the media.


