PIPS Ice Loss In July

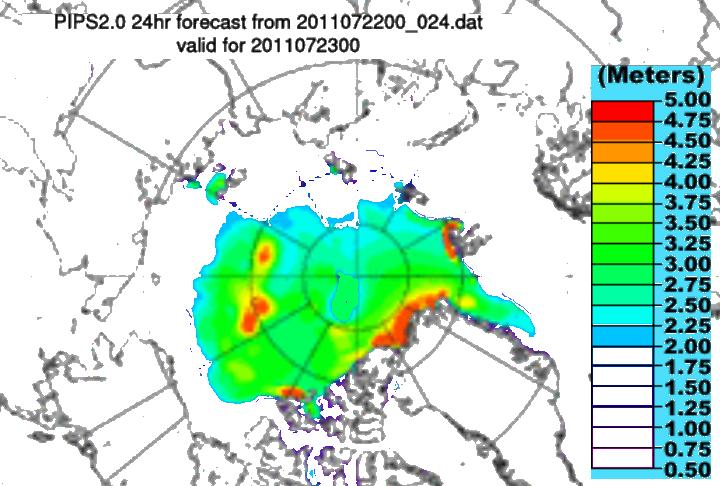
The videos below show all thicknesses and 2+ metre thickness ice. Note that ice loss has stalled over the last few days.

[youtube=http://www.youtube.com/watch?v=8yOq0oFXgBk]

[youtube=http://www.youtube.com/watch?v=2fBQE6etEH8]

If I were going to make a September forecast, I would base it on the image below, which is the edge of 2 metre thick ice. It is likely that all thinner ice will melt out before mid-September.

About Tony Heller

Just having fun
This entry was posted in Uncategorized. Bookmark the permalink.

6 Responses to PIPS Ice Loss In July

  1. Paul H says:

    Is PIPS up and running again then?

    • Apparently so. And so is Rooney.

      • Neven says:

        Paul H, as it says on the PIPS homepage:

        Since late April/early May 2011, PIPS 2.0 has developed an unrealistic opening in the North Pole region. On 22 May 2011, PIPS 2.0 stopped running because of a numerical instability. Since that time, we have been carefully trying to diagnose this problem (checking for anomalous atmospheric forcing, initial fields, boundary conditions, assimilated satellite ice fields, etc). During this process, the system’s ocean model time step was reduced and the system is currently running again. The unobserved opening near the North Pole is still present and can be seen in the ice concentration and ice thickness fields. PLEASE USE THESE FIELDS WITH CAUTION! We have subsequently filled in the period from October 2010 to present with the hindcast using the reduced ocean model time step. Because PIPS 2.0 is a legacy system and will soon be replaced with a new ice nowcast/forecast system (see below), little additional effort will be expended to keep it running.

        Steve, did you compare the PIPS 2.0 ice thickness maps with the new Arctic Cap Nowcast/Forecast System (ACNFS) ice thickness maps yet? I’d like to do it, but I don’t have that fancy pixel counting software you have.

Leave a Reply

Your email address will not be published. Required fields are marked *