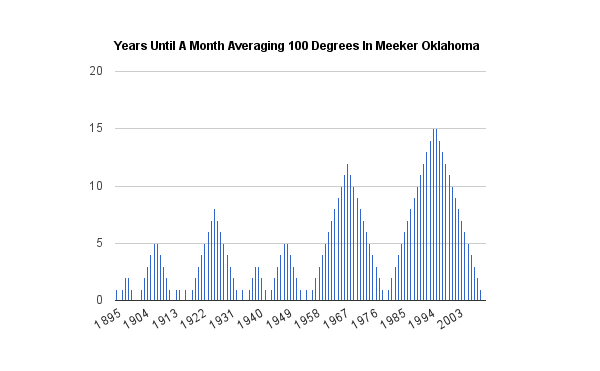
The graph above plots the number of years from the closest month where the USHCN high temperatures averaged over 100 degrees in Meeker, Oklahoma. Prior to 1960, Meeker would have an extremely hot month about once every 2-3 years. The 30 year spell from 1981 to 2010 had no months over 100 degrees.
Contrary to widely reported claims (normally made by people who have done no research) heatwave frequency has declined – dramatically.
Here are all the months which averaged over 100 degrees :
1896 - August
1901 - July
1902 - August
1913 - July, August
1916 - August
1918 - August
1934 - July, August
1936 - July, August
1943 - July, August
1954 - July
1956 - August
1980 - July, August
(2011 - July)


OT
Bill Maher recoils at the idea of PERSONALLY going the extra carbon footprint mile
http://www.youtube.com/watch?v=cal74kP7X1o
That was awesome. Keep them coming A AIM-120
That is a very interesting graph and clearly shows the signature of climate change. But not the kind the alarmists are hissing about.
Sneaky Steve.
Plotting a time series without temps or sea level 😉 but still graphs to a bottom-left to upper-right fashion just to mess with their heads.