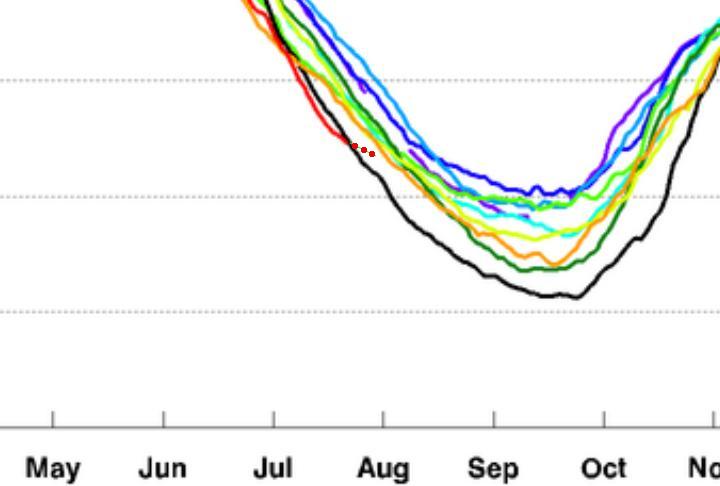
The end of July is here and sea ice extent is starting to become somewhat predictable. Here is my forecast for August 1.
This is based on the fact that in 2007 there was very rapid ice loss occurring in the East Siberian Sea and Arctic Basin. Neither of which we are seeing this year.


I think the 2007 numbers are complete and total bullshit………….
The Russians were running icebreakers in and out of there as fast as they could. 2007 was when they were trying to claim half of the Arctic as their territorial waters and claiming the shelf as theirs for oil and gas exploration…
The main job of icebreakers is to break up ice damns, and it’s the ice damns that have helped to keep ice in the Arctic in the past.
What are they waiting for? ; )
Thanks for this. Could you put a numerical figure on the line you’ve drawn above? Easier to keep track that way. It looks like you’ve projected the previous week’s average trend forward by a week. If my maths are right, that corresponds to an extent of ~6,500,000 on 30th July. Can you confirm?
Just keep this image and overlay it on the real results next week. Not so hard.
Done that now. Steve was way out: 2011 is still barely above 2007 on the JAXA graph.
ROFL.
*shrug* Overlay the graph yourself and post it if you don’t believe me.
I don’t have the August 1 JAXA graph. Can you send a me a link?
Oh that’s fine, I’ll settle for a promise that you’ll do a proper like-for-like overlay when the graph for the 1st is out. I thought that when you said “forecast for the next week”, you actually meant a week. Silly me.
Better still, why not post up today’s comparison (i.e. a week from the forecast date) and then another comparison when the data for the 1st is out, since you’re so convinced that the latter will vindicate you?
I stated quite clearly that the forecast was for August 1.
Fair enough, I look forward to seeing your overlay graph on the 2nd, when the JAXA data are available.
It will probably end up being somewhere in the middle of the pack. Of course, the alarmists have this hot July as their new poster child. DC had a min of 85 today that would be an all time record high min. Also, this July is on course to be the hottest July and hottest month in DC history, beating the record that was set just last year. The last two summers have been miserable. But as they say, records are meant to be broken.
According to the graph 2007 and 2011 Ice extents are now equal. I have been looking at this: http://home.comcast.net/~ewerme/wuwt/cryo_compare.jpg
Is it my imagination? Or is it an optical illusion? But they don’t “look” equal. 2011 “looks” more extensive already. By July 22 2007 the Chukchi, East Siberian & Beaufort seas all had less ice. The Laptev sea was sort of similar – except for the area near and around the Severnaja Zemla islands which had more ice in 2007. Do they really balance out? We’ll see in the next week or so I guess. The Cryosphere Today graphs deliberately omit ice in the 15% to 30% concentration band. Maybe that has something to do with it.
There was more ice in 2007 on the Atlantic side.
While the Arctic may be warmer currently, the Antarctic over the last 5 years is averaging 0.54C cooler than the 1980’s according to the UAH data for the SH summer – D/J/F.
This year the figure was 0.53C colder.
http://vortex.nsstc.uah.edu/data/msu/t2lt/uahncdc.lt
I’m just wondering how long it’s gonna take to get back to this!! http://igloo.atmos.uiuc.edu/cgi-bin/test/print.sh?fm=07&fd=23&fy=1992&sm=07&sd=22&sy=2011