http://www.world-science.net/othernews/101019_drought.htm
OMG – The world is coming to an end.
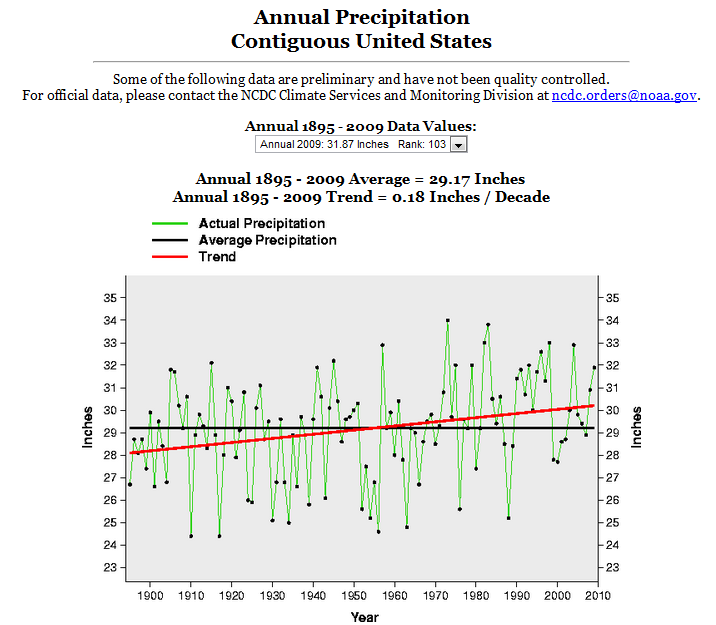
We can already see the progression of the drought in the US over the last 120 years, where precipitation has steadily increased about 7%.
http://climvis.ncdc.noaa.gov/cgi-bin/cag3/hr-display3.pl
In any other field of science, the scientists would go back and say, our models appear to be screwed. But in climate science, they just pile on the numbers.
After all, how could twenty-two incestuous closely related models all be wrong?


Pingback: More Bad News : Global Warming Will Drown Us All | Real Science
Linking to specific NCDC graphs do not work. But it’s pretty clear that this UCAR “modelling” is pure bs by looking at the 2000-2009 map from their article
http://www2.ucar.edu/news/climate-change-drought-may-threaten-much-globe-within-decades
Steven, perhaps you could add that map, and change your NCDC query to the same period 2000-2009. It produces
“Annual Precipitation Contiguous United States”
“Annual 2000 – 2000 Average = 27.73 Inches Annual 2000 – 2009 Trend = 3.02 Inches / Decade “.