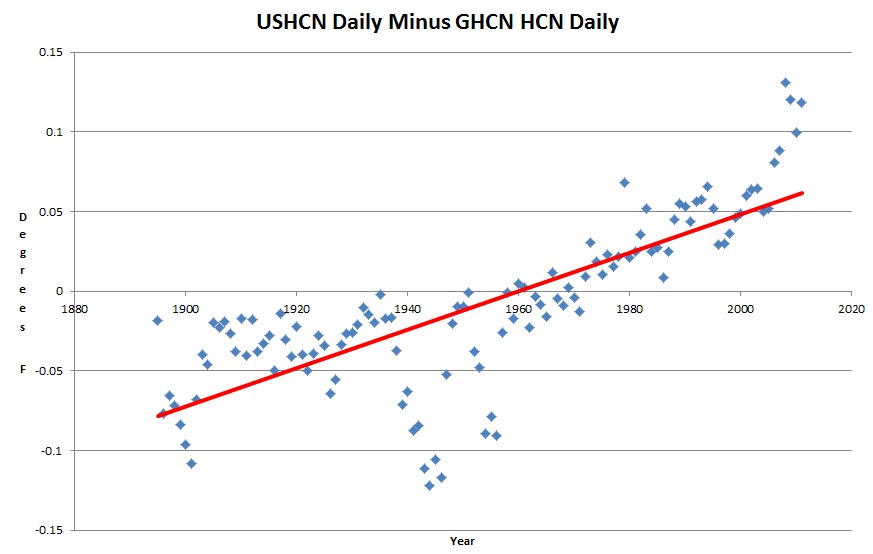
You can’t make this stuff up. There is yet another USHCN cheat going on with the raw data – which I just discovered.
The graph above plots USHCN 2.0 daily minus GHCN HCN daily data. They are supposed to be identical raw data sets, but USHCN 2.0 is doing something to cool the past and warm the present. This occurs before the USHCN 2.5 raw data cheat which I reported earlier today.
These people are corrupting the trend upwards at every step of the process.


I believe the explanation (or what passes for an explanation) is in this Menne paper…
http://www1.ncdc.noaa.gov/pub/data/ghcn/daily/papers/menne-etal2012.pdf
It appears that my memory is faulty. I remember reading something that tried to explain the discrepancies between the two data sets, but can’t find it at the moment.
Perhaps the qc in table 1 of this paper accounts for some of the difference?
ftp://ftp.ncdc.noaa.gov/pub/data/ushcn/papers/menne-etal2009.pdf
So raw data is never really raw for these people?
These 2 checks are demonstrably false…
Lag-range inconsistency Identifies maximum temperatures that are at least
40°C warmer than the minimum temperatures on the
preceding, current, and following days as well as minimum
temperatures that are at least 40°C colder than the
maximum temperatures within the 3-day window
Temporal inconsistency Determines whether a daily temperature exceeds that on
the preceding and following days by more than 25°C
http://en.wikipedia.org/wiki/United_States_temperature_extremes
Rapid temperature change is common in the great plains area.
Wow.
From page 995 of ftp://ftp.ncdc.noaa.gov/pub/data/ushcn/papers/menne-etal2009.pdf
Collectively,
the daily QA system had
an estimated false-positive
rate of 8% (i.e., the percent of flagged values that
appear to be valid) and a
miss rate of less than 5%
(the percent of true errors
that remain undetected).
Monthly means were then
derived from the qualityassured daily data, with a
requirement that no more
than nine values be flagged
or missing in any given
month.
That doesn’t produce a temperature trend.
OK, my thought was …
GHCN daily is used used as input for USHCN daily
The quality control checks ( in the above paper) are ran on the USHCN daily data and failing days from quality control so that the trend in GHCND vs USHCND is modified
I checked Great Falls for a QC fail flag (Close to the LOMA MT, the US 24 hour temp diff record on 1/15/1972) and it was not set, although I verified the huge temp drop/raise at around that time.
Strike 1 🙂
It would be nice to write some software that compares daily temps between USHCN and GHCN in detail and summary and outputs the diffs.
Wish I had more time.
That is absurd. There is no physical phenomenon which will cause a completely random error distribution to produce a trend.
The qc rules they’ve defined are arbitrary and post hoc. Also, the temperature patterns across the US are non-random. Chinook winds, canadian cold fronts, etc. It is very possible to define the qc procedures that preferentially removes data from the real raw data set.
I think I need to do more reading (wish I had the time for it).
It is simple enough with computers to systematically search for a set of “corrections” which will achieve a desired bias.
Where is a picture of the sudden downward T plunge that this sudden upward adjustment is hiding?
It is not that sudden, but Steve has some decent blink charts he can show you.
Steve, you’re doing a great job! Through your work, and others, we”ll get to the truth. Sadly, those people, who are systematically altering what people perceive as truth, don’t care.
Luckily, there are people like you who help us laugh at the people at the USHCN. Thanks Steve!! Keep it up!
Thanks!
This needs to be reported to the police
I am I simpleton in thinking you have instruments that daily record the temperatures and then you graph this data? Can anyone explain to me how this data needs to be ‘modified’?
Billions of dollars in funding require the numbers to fit the narrative. Remember, “If the
glovetrend don’t fit, you mustacquitadjust it.“I think it begins with the fact that the data are basically crummy and always have been. “controlled observations” is not really an accurate characterization of world temperature records. So they had to make adjustments, and that’s where the fun began. At one time it was questionable but not prone to political bias (see the records by Clayton et al. in the Smithsonian Miscellaneous Collections, 1927, 1934, etc – they can be downloaded). But that was long, long ago.
Good stuff. Thanks. But why are they modifying present data? Isn’t it electronically gathered? So either their data is garbage (and why would we use it?) or they are modifying the data when they shouldn’t be. Correct?