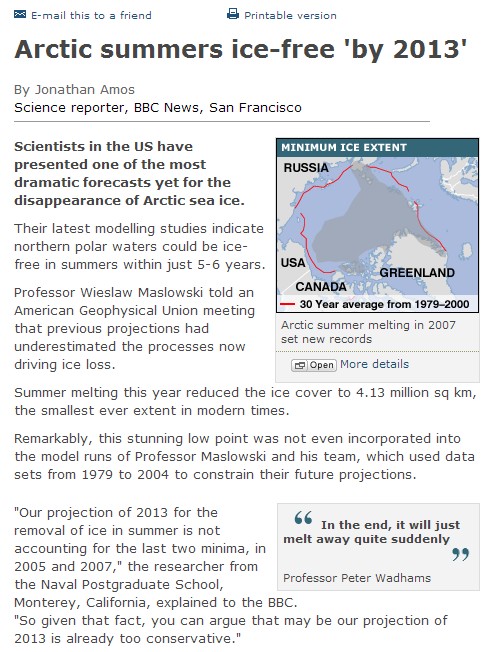
BBC NEWS | Science/Nature | Arctic summers ice-free ‘by 2013’
Disrupting the Borg is expensive and time consuming!
Google Search
-
Recent Posts
- Gaslighting 1924
- “Why Do You Resist?”
- Climate Attribution Model
- Fact Checking NASA
- Fact Checking Grok
- Fact Checking The New York Times
- New Visitech Features
- Ice-Free Arctic By 2014
- Debt-Free US Treasury Forecast
- Analyzing Big City Crime (Part 2)
- Analyzing Big City Crime
- UK Migration Caused By Global Warming
- Climate Attribution In Greece
- “Brown: ’50 days to save world'”
- The Catastrophic Influence of Bovine Methane Emissions on Extraterrestrial Climate Patterns
- Posting On X
- Seventeen Years Of Fun
- The Importance Of Good Tools
- Temperature Shifts At Blue Hill, MA
- CO2²
- Time Of Observation Bias
- Climate Scamming For Profit
- Climate Scamming For Profit
- Back To The Future
- “records going back to 1961”
Recent Comments
- Bob G on Gaslighting 1924
- Bob G on Gaslighting 1924
- conrad ziefle on Gaslighting 1924
- Bob G on Gaslighting 1924
- Bob G on Gaslighting 1924
- arn on Gaslighting 1924
- conrad ziefle on Gaslighting 1924
- Gordon Vigurs on Gaslighting 1924
- conrad ziefle on Gaslighting 1924
- Robertvd on Gaslighting 1924


THE HOLLOW MEN PREDICTION
This is the way the (Arctic) ends
Not with a bang but a whimper.
apologies to TS Eliot
With enough icebreakers, anything is possible.
A few atmospheric nukes each 4th of July would take advantage of Sagan’s nuclear winter effect. Doing so would be arrogantly blasphemous to Church of Climatology paganism which still represents the state religion of all Western countries, circa 2012.
Erm. I know you are joking, but atmospheric explosions would wipe out electronics over a significant portion of the globe… So, NO.
What happened to the ice extent graph at the website below? It used to show a 10-year history, and now it just shows a 4-year history.
http://ocean.dmi.dk/arctic/icecover.uk.php
Is this to purposely hide the low extent from 2007?
@ Mickey above:
Below the graph;
The plot above replaces an earlier sea ice extent plot, that was based on data with the coastal zones masked out. That implied that the previous sea ice extent estimates were underestimated. The new plot displays absolute sea ice extent estimates. The old plot can still be viewed here for a while.
http://ocean.dmi.dk/arctic/old_icecover.uk.php
What the new graph shows more clearly is the devistation cause by the August storm.
Hey, after this year’s melt, these guys are looking like they’re bang on the money!
(But why not update this story from 2007 with some data from this year, Steven? You could show how right they were.)
2016 +/- 3 years for a complete melt of the Arctic sea ice. Just the sort of excellent analysis you’d expect from the US Navy.
Thanks for bringing this to the attention of the world, Steven.
The US armed forces clearly owe you a vote of thanks.
Have you been drinking?
http://sunshinehours.wordpress.com/2012/10/25/arctic-sea-ice-not-as-bad-as-they-claimed-dmi/