
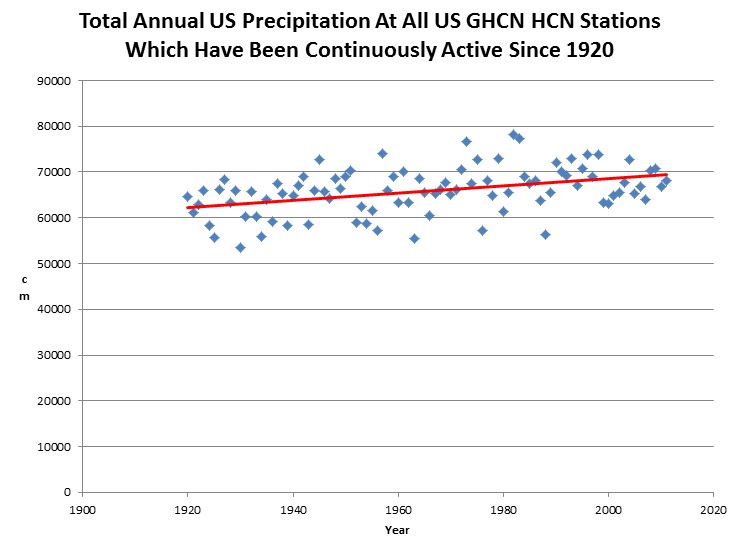
Jeff Masters says (this week) that drought is the greatest threat of global warming. US precipitation has been steadily increasing for at least 90 years.
Jeff Masters says (this week) that drought is the greatest threat of global warming. US precipitation has been steadily increasing for at least 90 years.

But alarmists say floods result from excess heat too! You can never win the way they have set up this game. Any kind of weather, including perfect weather is a result of warming.
OH MY GOD WE ARE GOING TO BE DROWNED !!!
Rainfall long-term trend for the Contiguous U.S. is up, using NOAA data: http://www.ncdc.noaa.gov/temp-and-precip/time-series/index.php?parameter=pcp&month=11&year=2012&filter=12&state=110&div=0
Why are climate skeptics on the defensive? All we ask is that the alarmists provide verifiable and nonfalsifiable documentation of their platform. Till then, I see the ball in their court.
I appreciate the graphs, tables, newspaper clippings etc. Must have at least ten dozen copied and filed by now. Will give credit when I use them. Thanks!
Only one conclusion. Weather and therefore climate is chaotic and after a rather short time, unpredictable. The hypothesis, and therefore, models with assumptions as input into models point to warmer weather, and feedback of more water vapor and therefore more precipitation.
Of course this is a dry wet. or was that a wet dry. Someday I may be able to learn the difference..
I have available photos taken from the air which shows the lake levels in southern Minnesota lakes down by from 15 to 25 ft. Photos taken by U of MInn. Attempts were made to farm many lakes from about 1933 to 1940.
You beat me to it by a few days. Next Christmas please buy yourself a few extra bottles of rum when you feel the urge to work harder.
http://lnx-bsp.net/news/2013/01/02/
For what it’s worth, I note there’s a correlation between North American rainfall (seen on a continent-wide basis) and Ryan Maue’s ACE chart. So we have:
* low-point around 1978
* bit of a hump in activity to another low in 1982
* bigger hump ending in a low in 1988
* big hump ending in a major low around 2000
* smaller series of activity ending in a low around 2010
The IPCC has been trying to claim that we are in for both more droughts, and more intense floods (implying that the water vapour “bunches up” into less evenly distributed packets), as well as overall lower precipitation.
Has anyone else noticed that all forms of precipitation (i.e. everything from light rainfall through to storms) tend to mostly correlate with each other? Hurricane Sandy was perhaps a bit of an exception (a very wet storm in a dry year) and of course you will get exceptions, but Sandy didn’t get much ACE score (only 14.2, compared to Yasi that hit Queensland at 16.1) and overall 2012 didn’t get much ACE score either (not many big storms in 2012).
It would make sense to me if evaporation was uniformly a driver of all weather events rather than selectively redistributing energy into storms in preference to regular rainfall. That should at least be the null hypothesis unless strong evidence points otherwise.