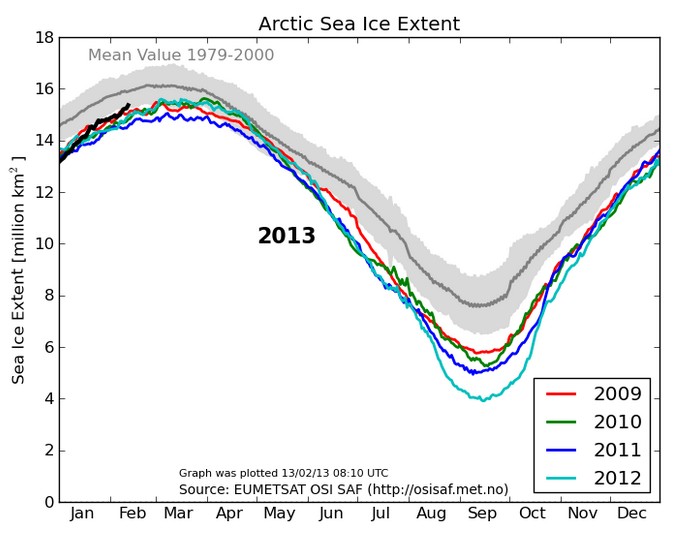
Danger Will Robinson! Only recipients of the $250 billion EU climate scam money are permitted to view this dangerous graph. It may confuse you into believing that Arctic ice extent is normal.
COI | Centre for Ocean and Ice | Danmarks Meteorologiske Institut


http://www.youtube.com/watch?v=fqFUmo8VVg0
“This coastal mask implied that the previous sea ice extent estimates were underestimated.”
The plot above replaces an earlier sea ice extent plot, that was based on data with the coastal zones masked out. This coastal mask implied that the previous sea ice extent estimates were underestimated. The new plot displays absolute sea ice extent estimates. The old plot can still be viewed here for a while.
They changed their Al-Gore-Rhythm for the Land Mask and also how they interpret the satellite photos. Resolution of the satellite information has increased with each new satellite they have launched.
There is no Apples to Apples comparison of year to year sea ice Extent. We are given Model out put based on input that has varied over the years.
The most they can say with any accuracy is that Sea Ice at Both poles varies seasonally and yearly. Most likely it follows long term weather patterns that most likely contribute to the results each season.
L-O-Freakin’_L
Al Gore dancing to the Rythym for the Land??
That is one of my recurring nightmares.
Danger, danger Dr. Smith! Summer begins in a couple of months.