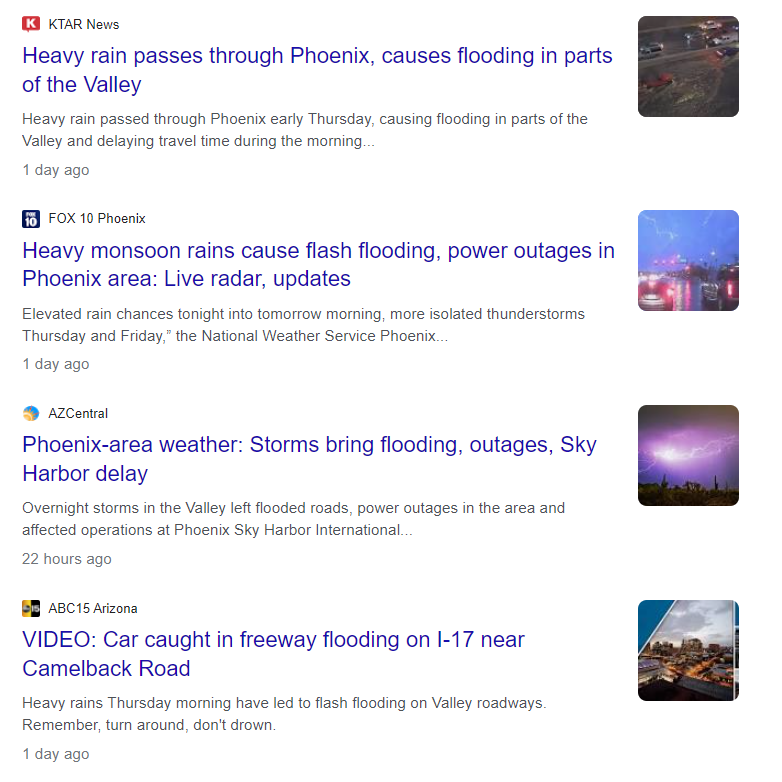
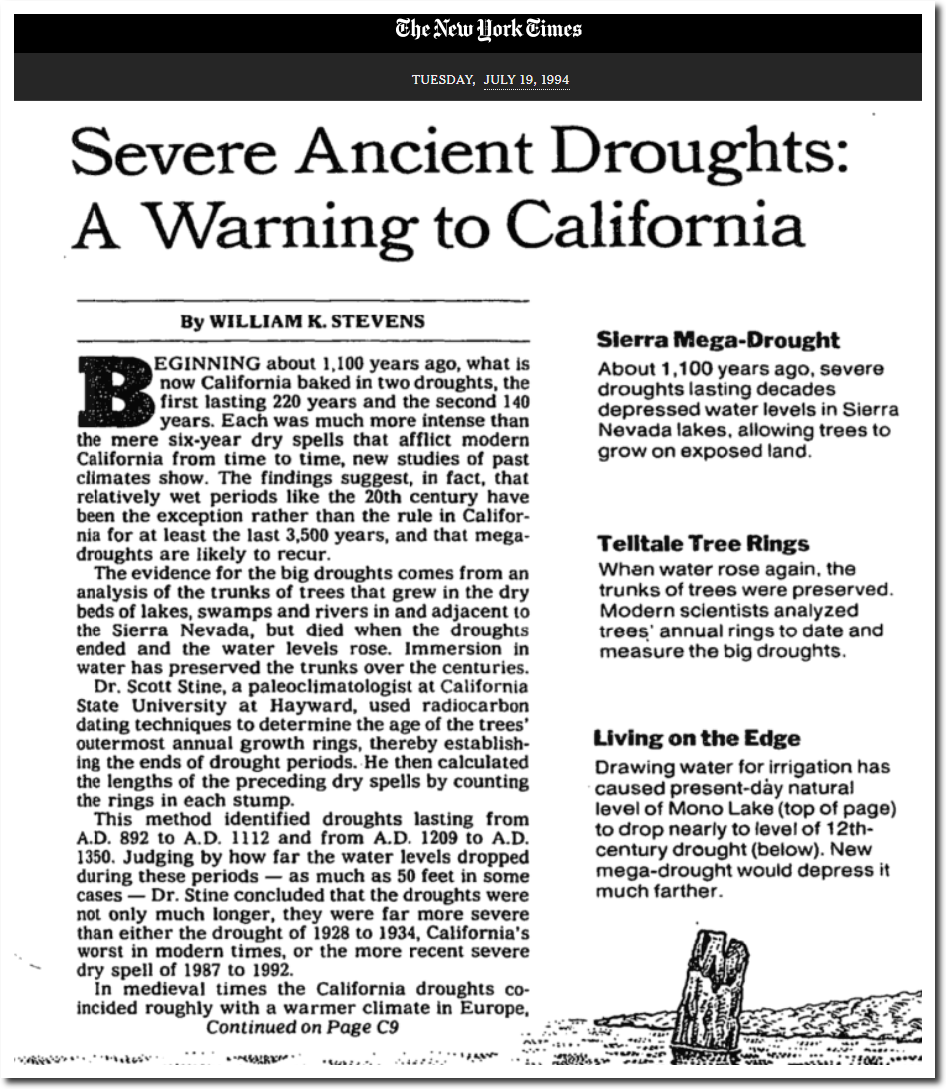
Oil is being snipped from the UK to the US, because UK taxes make it cheaper to ship and sell the oil overseas.
UK Sends Billions of Liters of Petrol to US, Where It’s Cheaper – BNN Bloomberg
Oil is being snipped from the UK to the US, because UK taxes make it cheaper to ship and sell the oil overseas.
UK Sends Billions of Liters of Petrol to US, Where It’s Cheaper – BNN Bloomberg
After two years of lockdowns, mask mandates, vaccine mandates, social distancing, country closures, forcing people out of work and general destruction of civilization, the press now says everybody is going to get COVID multiple times and they knew it all along.
You Are Going to Get COVID Again … And Again … And Again – The Atlantic
In other words, nothing government did was of any value and the Infection Fatality Rate is actually very low. I was censored from YouTube and Twitter numerous times over the past two years for saying the same thing.
Two years ago Jacinda announced she had eliminated COVID, and last month she announced that she had contracted it.
“The president of the United States is simply lying to us. The reality is that Exxon and other oil companies are drilling and investing, on a massive scale, both in the United States and worldwide. They pay many billions in local, state and federal taxes.”
ExxonMobil Responds To Biden’s Inflation Blame-Shifting Attack
On April 15, 2020 I paid $1.40 per gallon for gas in Longmont, Colorado.
Average gasoline price in Colorado is now $4.84.
Gas Station Price Charts – Local & National Historical Average Trends – GasBuddy.com
“The 1930s were warm in the United States, but they were cool globally. In fact, your readers can see that data for themselves at the NASA website”
Letter: Start global warming debate with facts, truths
Multiple agencies show close agreement in the global temperature record over the past 140 years.
Scientific Consensus | Facts – Climate Change: Vital Signs of the Planet
Annual 2021 Global Climate Report | National Centers for Environmental Information (NCEI)
However, these graphs are not consistent with prior work. In 1989, the head of NOAA’s National Climatic Data Center said earth cooled from 1921 to 1979. Now NOAA shows lots of warming during that period.
Analysis of warming since 1881 shows most of the increase in global temperature happened before 1919 — before the more re-cent sharp rise in the amount of carbon dioxide in the atmosphere. said Thomas Karl, of the National Oceanic and Atmospheric Administration’s National Climatic Data Center in Asheville, N.C. While global climate warmed overall since 1881, it actually cooled from 1921 to 1979, Karl said
07 Dec 1989, Page 14 – Santa Cruz Sentinel at Newspapers.com
NOAA has since altered their data, and now shows cooling from 1880 to 1919 and warming from 1921 to 1979.
Climate at a Glance | National Centers for Environmental Information (NCEI)
In 1974, the National Center for Atmospheric Research showed lost of cooling from 1940 to 1970, and 1970 cooler than 1870.
21 Jul 1974, 13 – The Des Moines Register at Newspapers.com
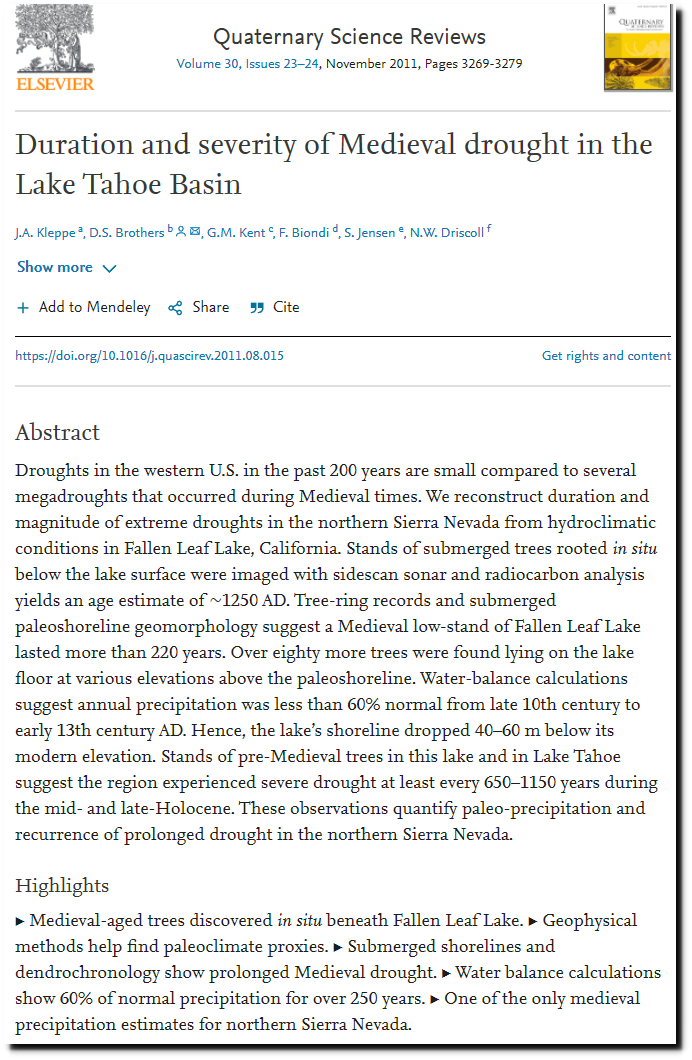
This was consistent with observations about the Artic. Arctic winter temperatures warmed 16 degrees from 1910 to 1939.
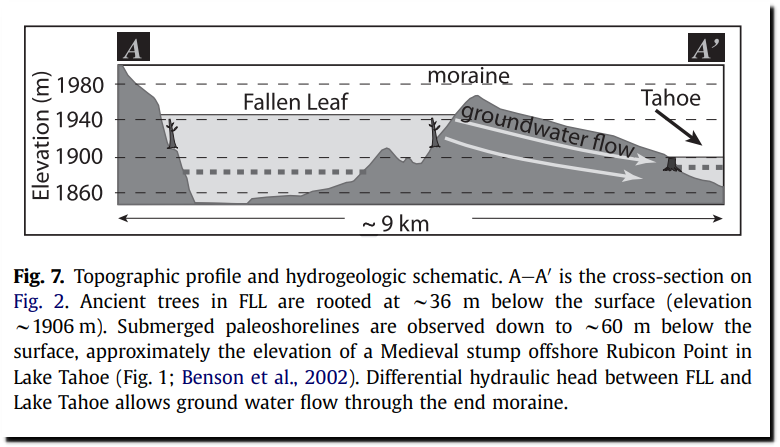
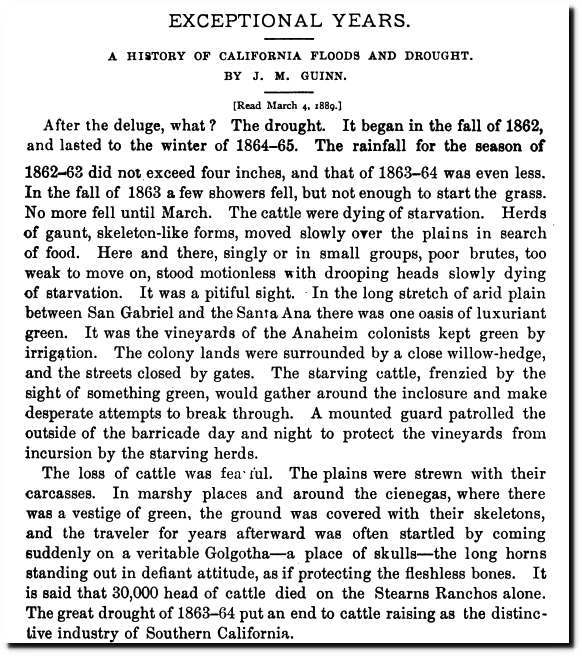
29 Sep 1939 – What is The World Coming To? – Trove
The glaciers of Greenland and Norway were facing catastrophic collapse.
17 Dec 1939, Page 15 – Harrisburg Sunday Courier
Retreat of the Abrekke glacier in Norway before 1946.
The Present Climatic Fluctuation on JSTOR
29 Dec 1923, Page 5 – at Newspapers.com
28 Jul 1950 – HUGE GLACIER DISAPPEARING – Trove
18 Feb 1952 – POLAR ICE THAW INCREASING
“SUNDAY, OCTOBER 19, 1958
The Changing Face of the Arctic Some scientists estimate that the polar ice pack is 40 per cent thinner and 12 per cent less in area than it was a half-century ago, and that even within the lifetime of our children the Arctic Ocean may open, enabling ships to sail over the North Pole, as the submarines Nautilus and Skate recent-ly sailed under it. A ship bound from New York to Tokyo would save 2,500 Although the idea that a solid ice sheet covers the central Arctic has lingered stubbornly in the popular fancy, the northern cap of ice worn by our planet is actually a thin crust—on the whole, only about seven feet thick—over an ocean two miles deep in places.”
The Changing Face of the Arctic; The Changing Face of the Arctic – The New York Times
By 1970, the story had completely changed.
“The United States and the Soviet Union are mounting large?scale investigations to de termine why the Arctic climate is becoming more frigid, why parts of the Arctic sea ice have recently become ominously thicker and whether the extent of that ice cover contributes to the onset of ice ages.”
U.S. and Soviet Press Studies of a Colder Arctic – The New York Times
The ice records were consistent with the 1974 graph, but not the rewritten graphs.
Government agencies have been continuously tampering with the global temperature data to make the past cooler and the present warmer.
2001 version : Fig.A.ps
2015 version: Fig.A.gif
NOAA shows that portions of Africa were record hot during June 2021 – in places where they have no data. And they made the record cold in Antarctica disappear.
Global Climate Report – June 2021 | National Centers for Environmental Information (NCEI)
Satellite data showed June 2021 temperatures in Africa just about average.
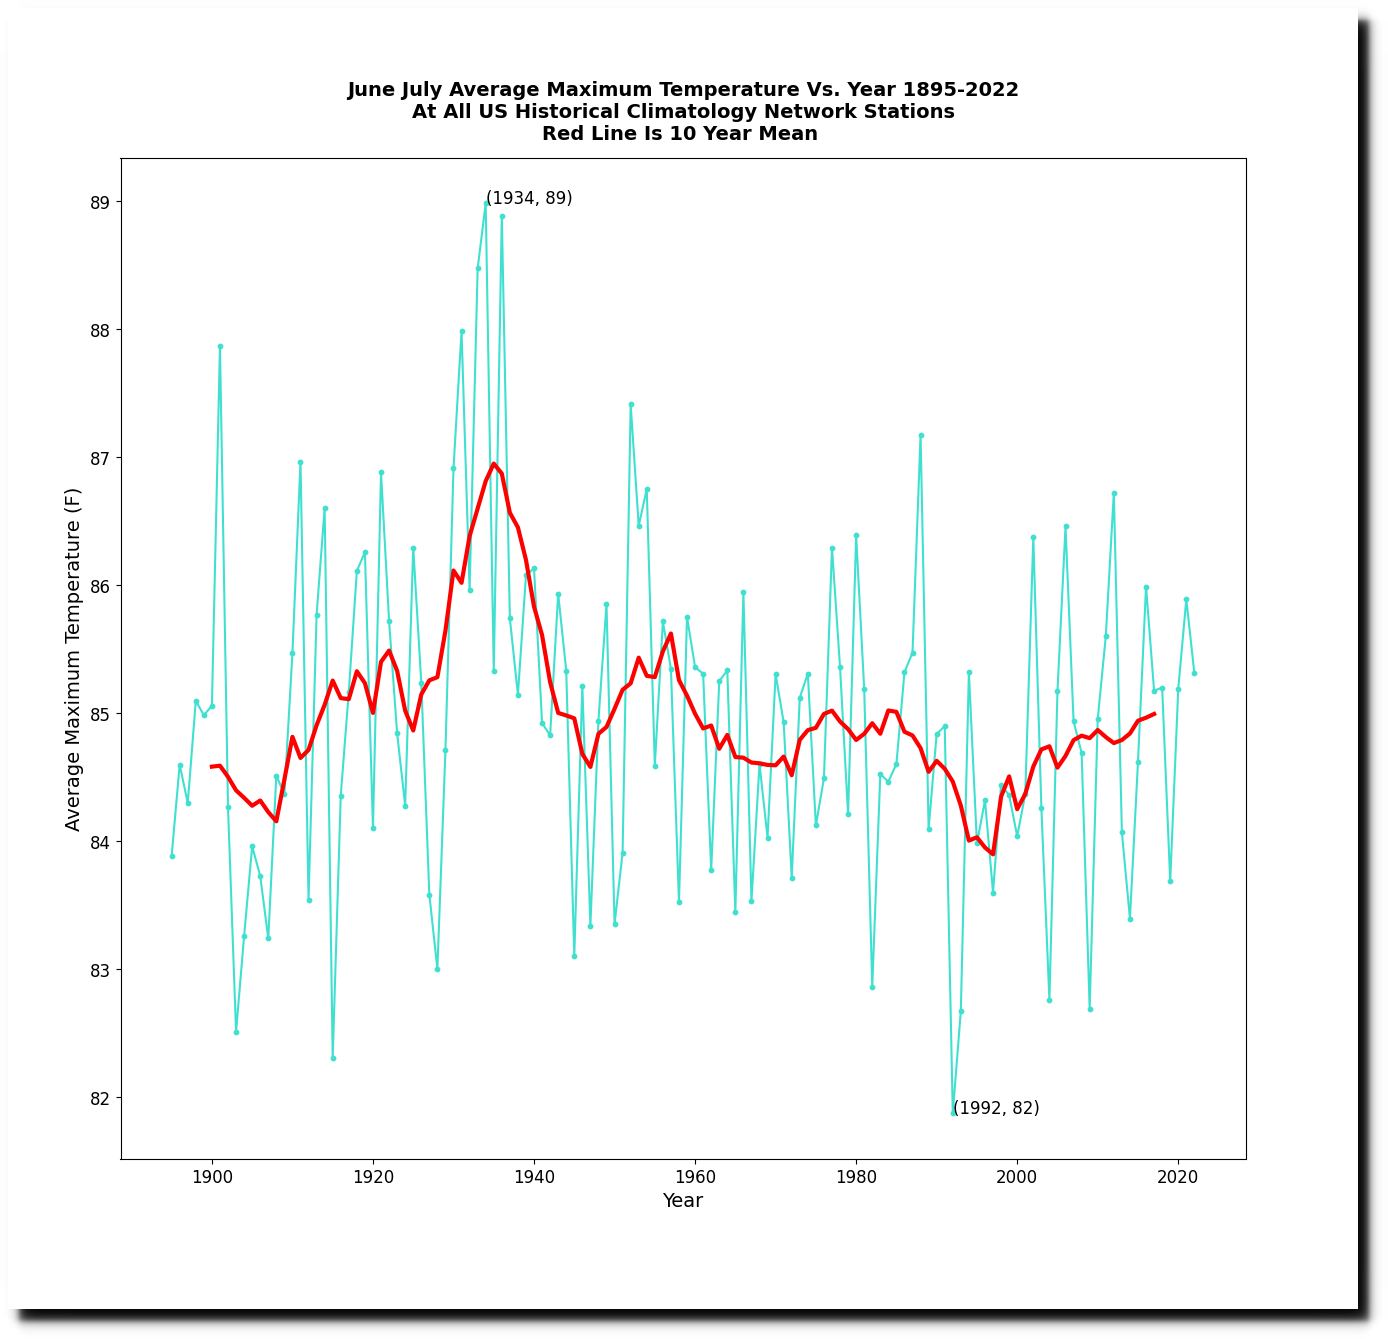
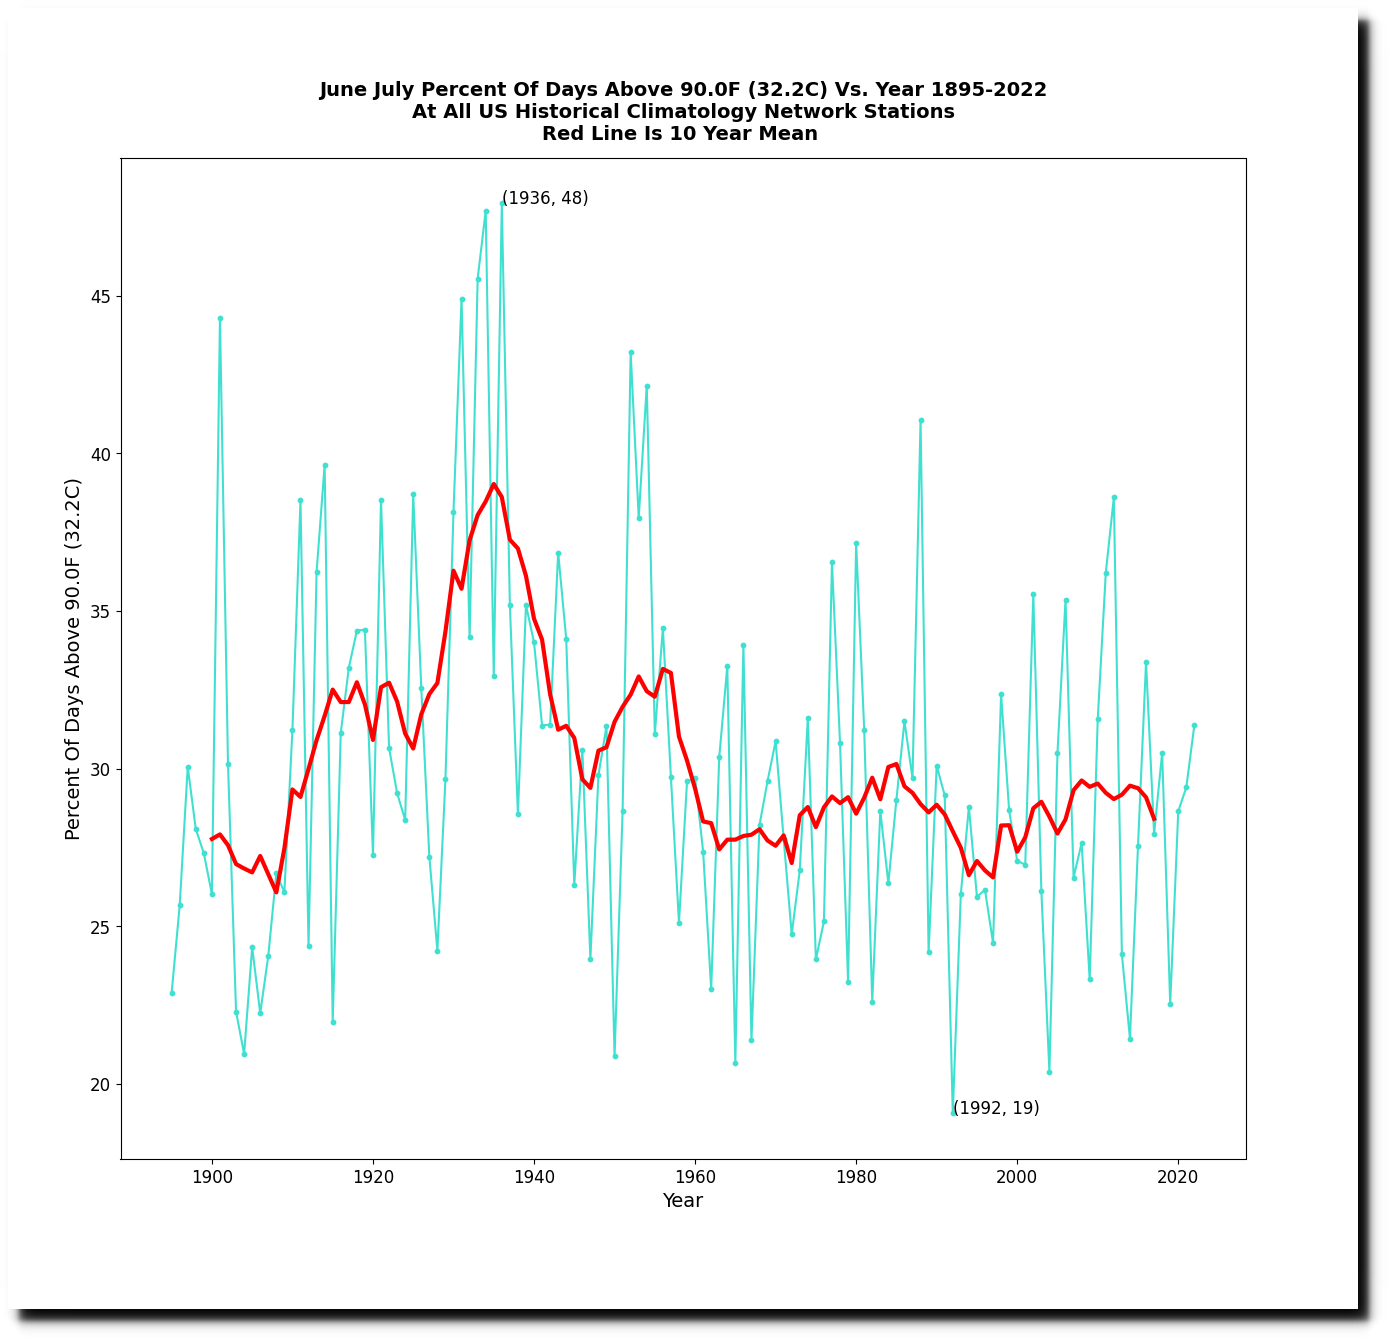
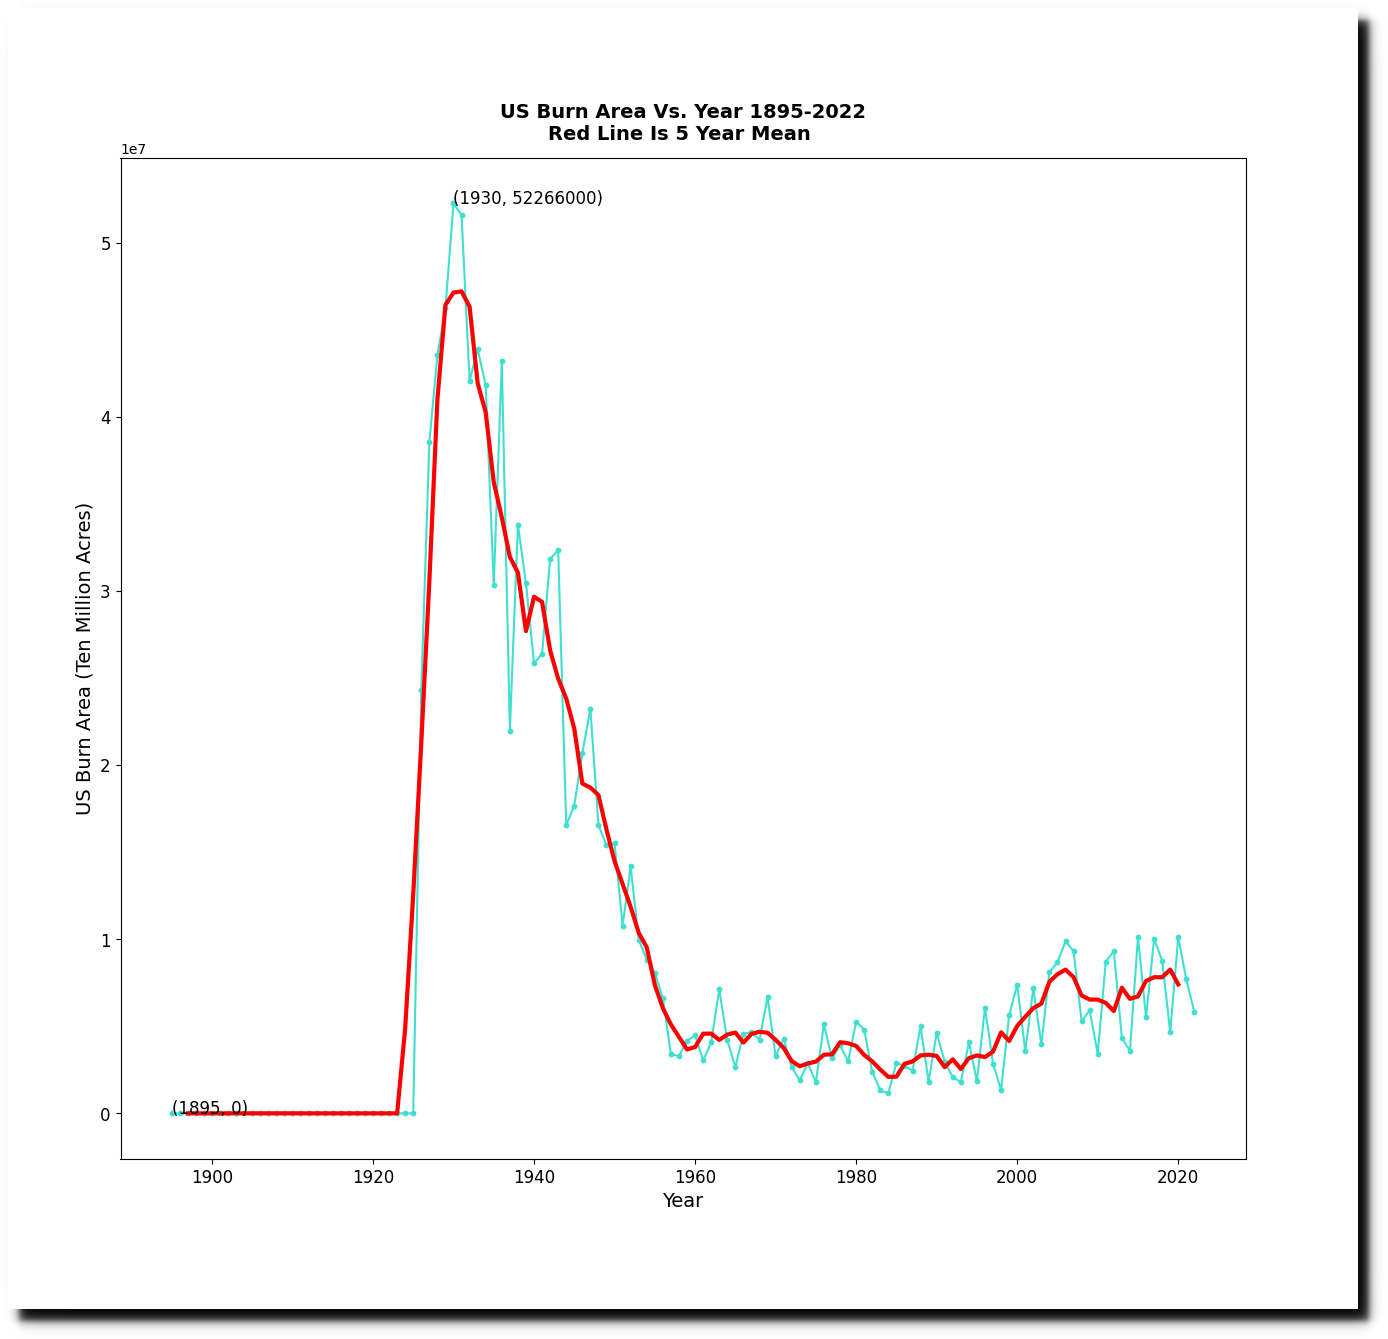
The US is one of the few locations on Earth with a good long term temperature record, and it is massively tampered with.
ftp://ftp.ncdc.noaa.gov/pub/data/ghcn/daily/figures/station-counts-1891-1920-temp.png
And this is NASA’s current graph, which now shows a strong warming trend during that period.
Here is an animation showing how the data has been altered over the past 20 years.
U.S. Data Since 1895 Fail To Show Warming Trend – NYTimes.com
Their current graph from 1895 to 1987 shows warming during that period, so we know that NOAA has altered their data over the past 30 years.
Climate at a Glance | National Centers for Environmental Information (NCEI)
Climategate emails show that the people responsible for the data tampering were being pressured to and colluded together to create unprecedented warming.
“I know there is pressure to present a nice tidy story as regards ‘apparent unprecedented warming in a thousand years or more in the proxy data”
Keith Briffa To Michael Mann and Phil Jones September 22 1999
www.climateaudit.info/data/CG1/0938031546.txt
In 1990, Tom Karl and the IPCC showed that Earth was much warmer 900 years ago, during the Medieval Warm Period (MWP.)
But by 1995, climate scientists had made the decision to get rid of the inconvenient MWP.
U.S. Senate Committee on Environment and Public Works
By 2001, Michael Mann and the IPCC followed up on their plans, and eliminated the MWP.
IPCC Third Assessment Report – Climate Change 2001
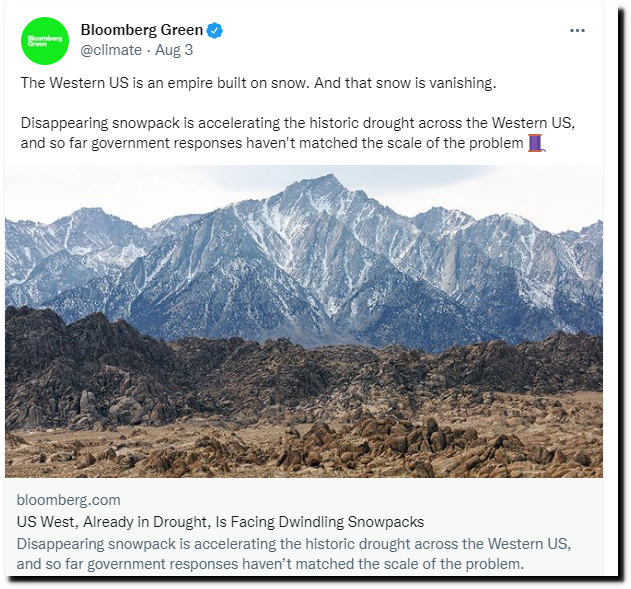
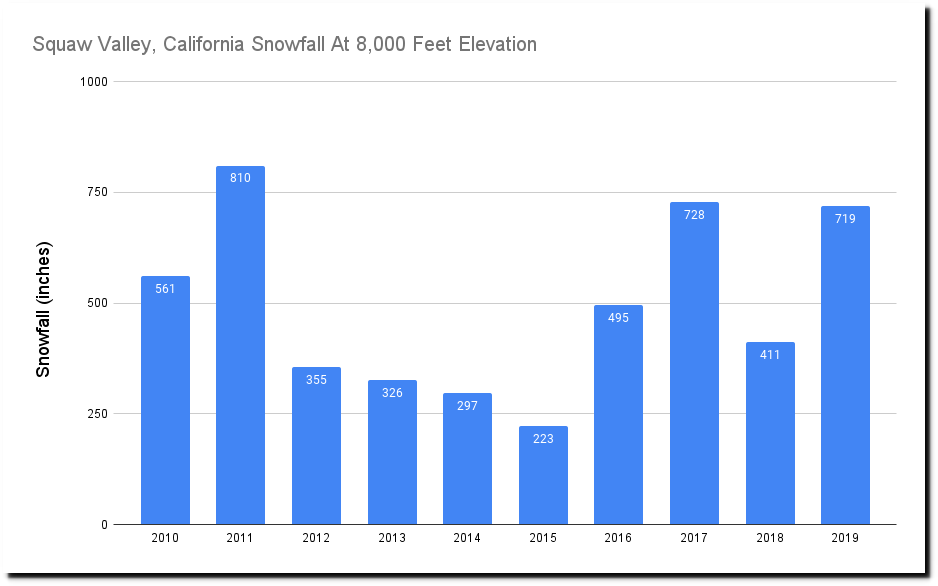
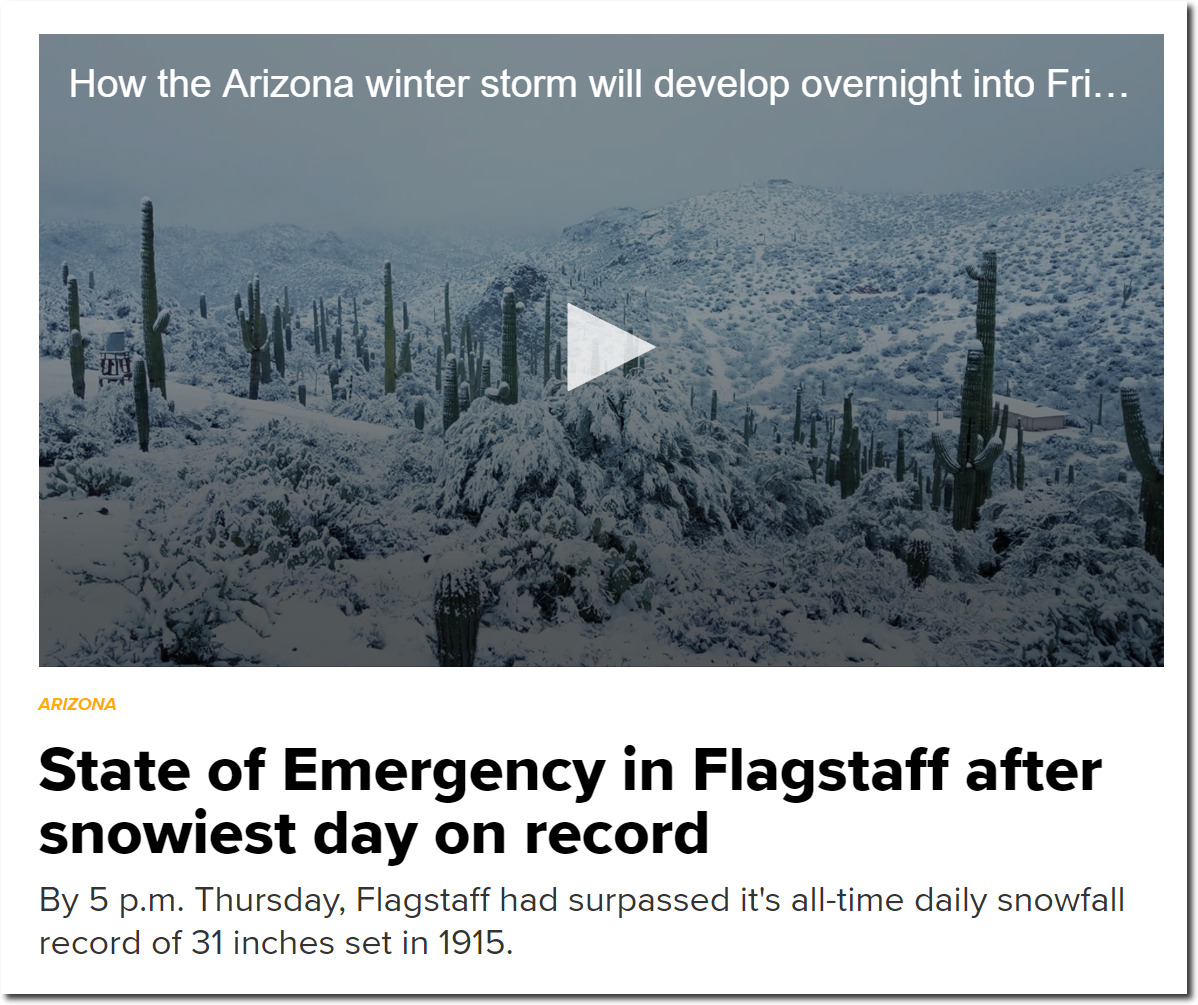
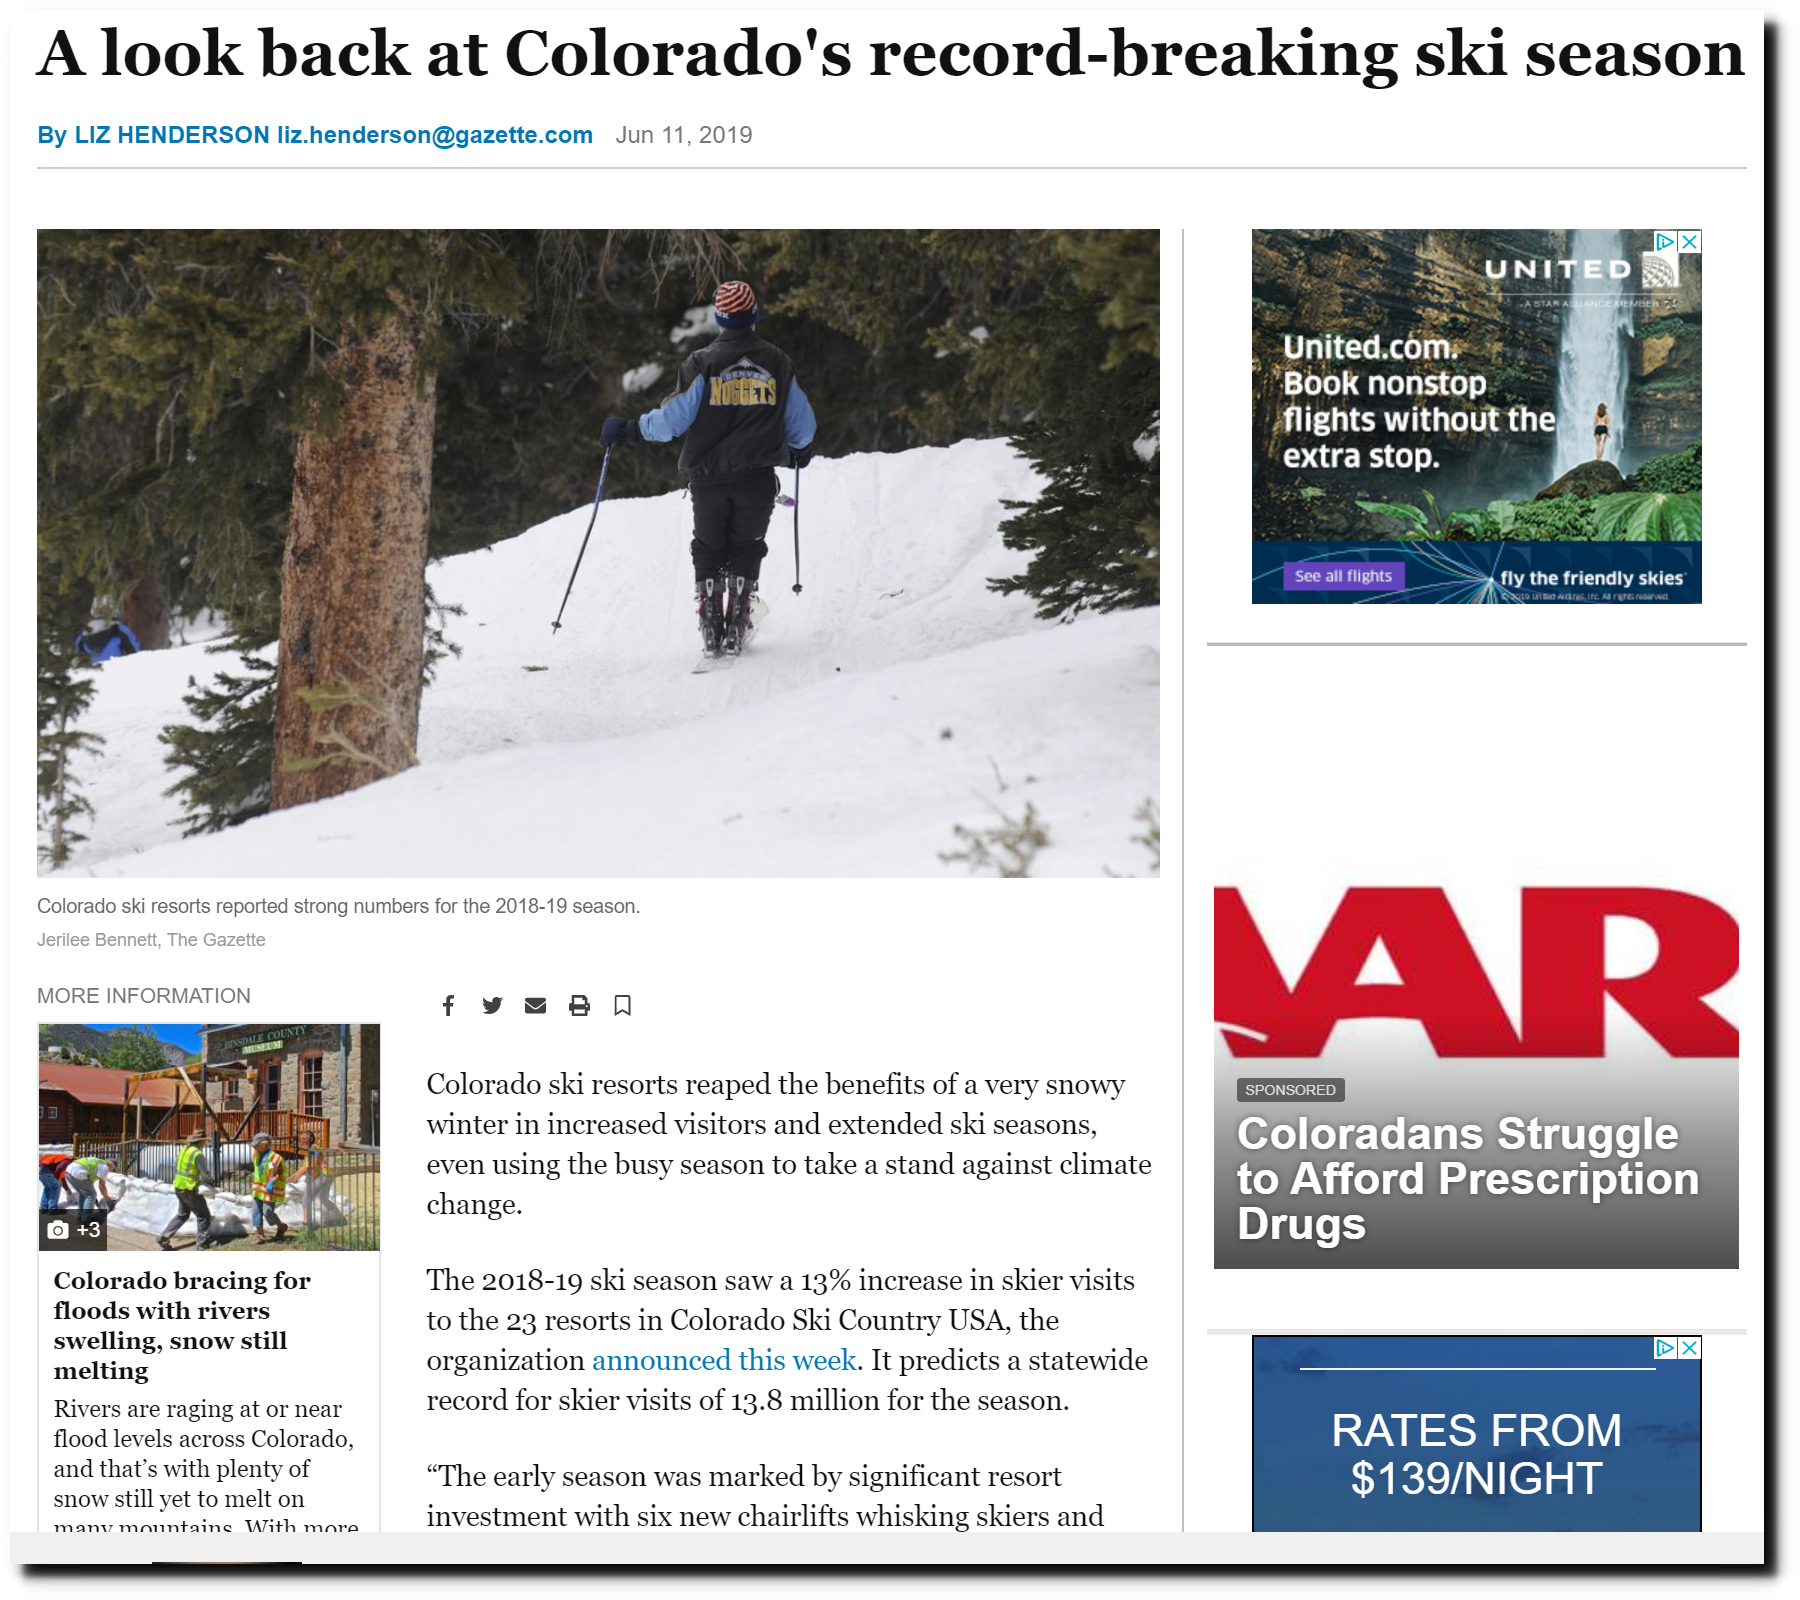
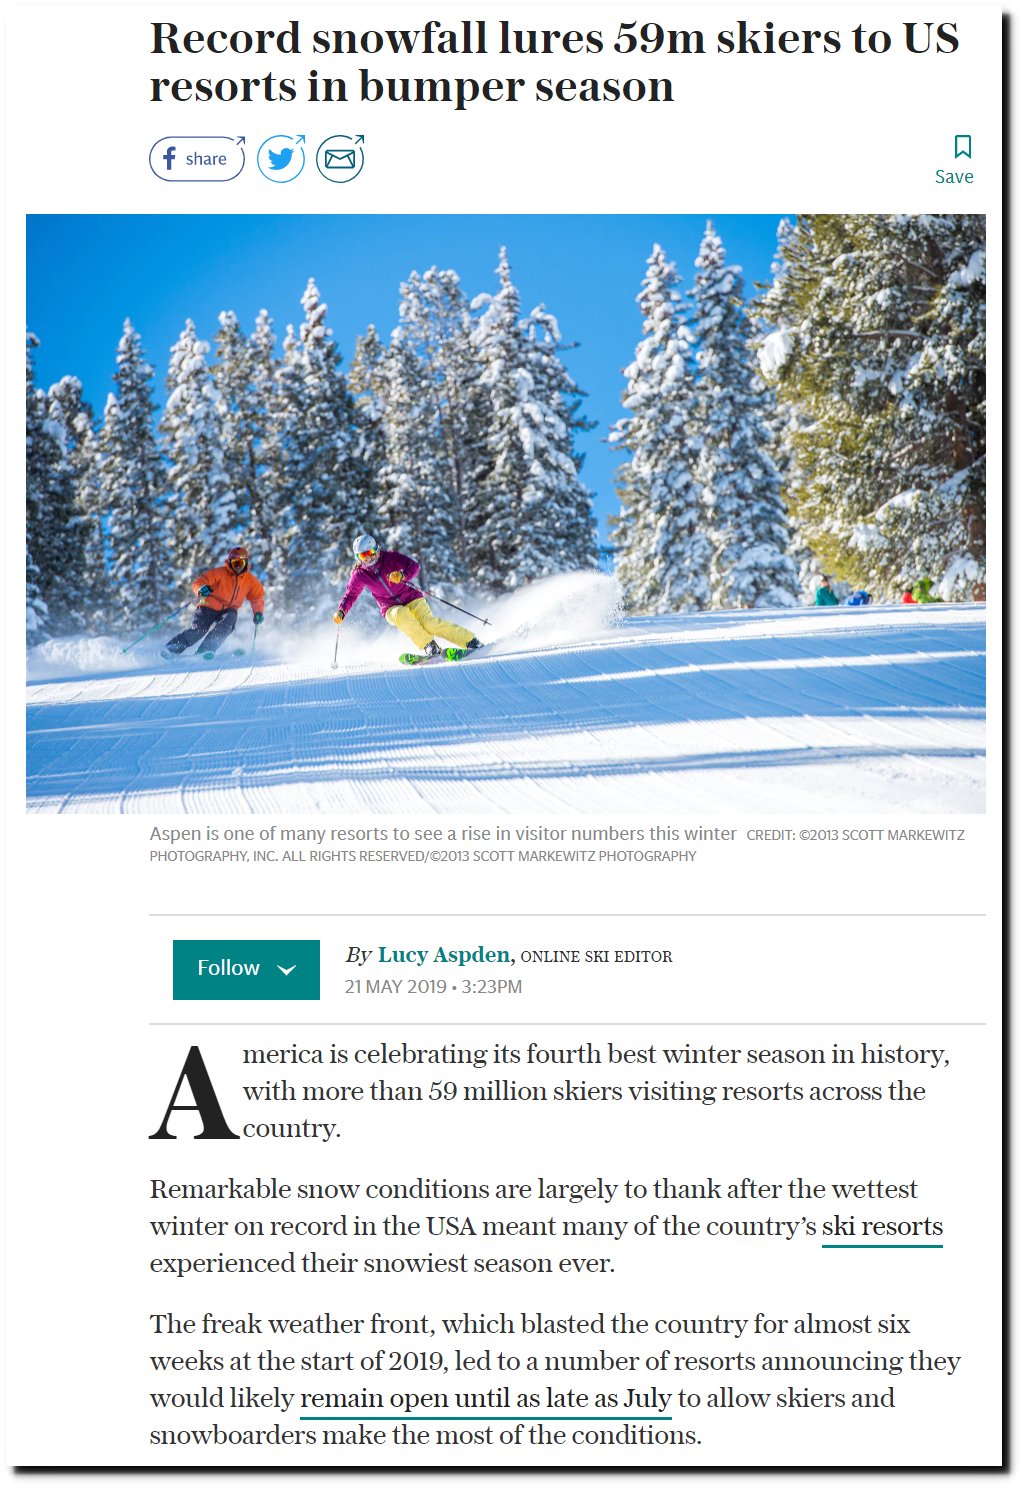
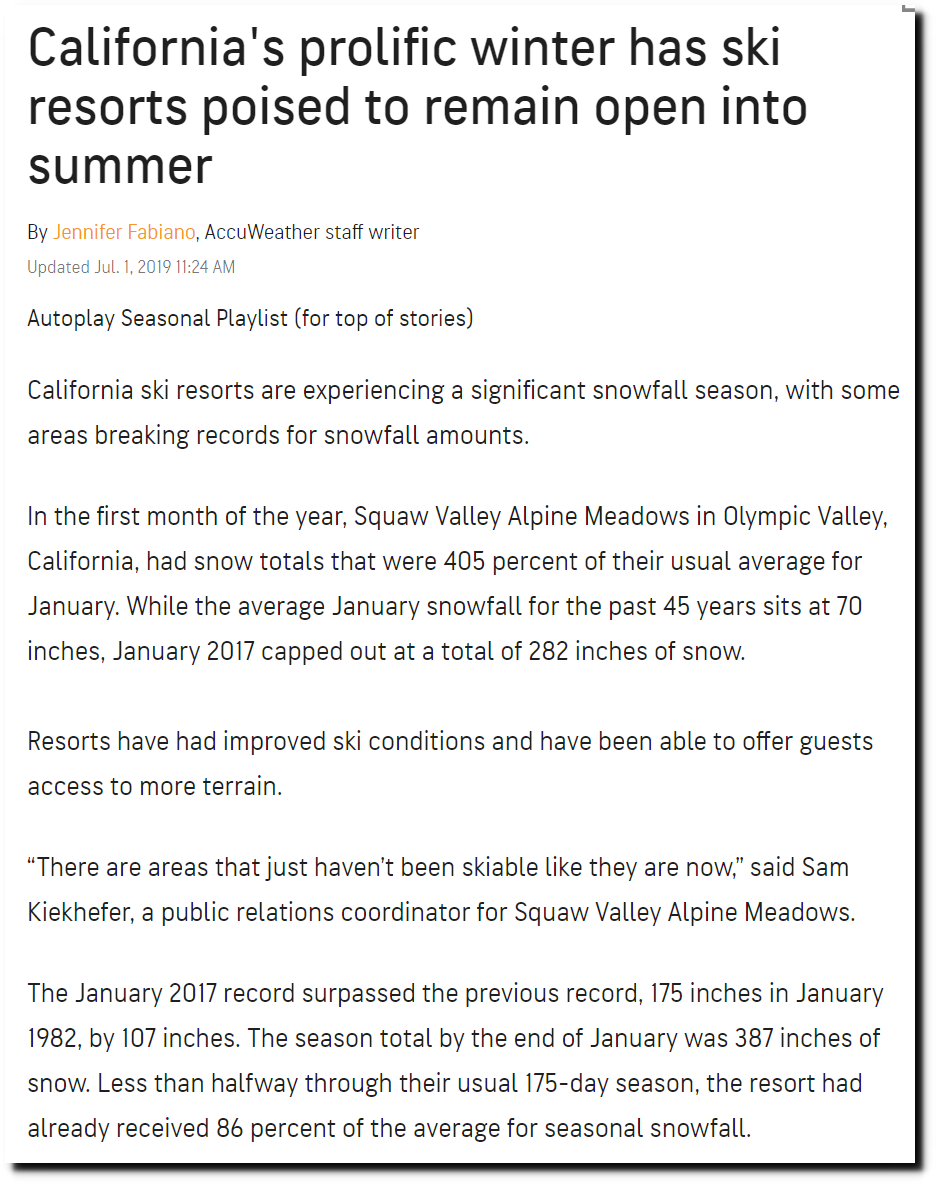
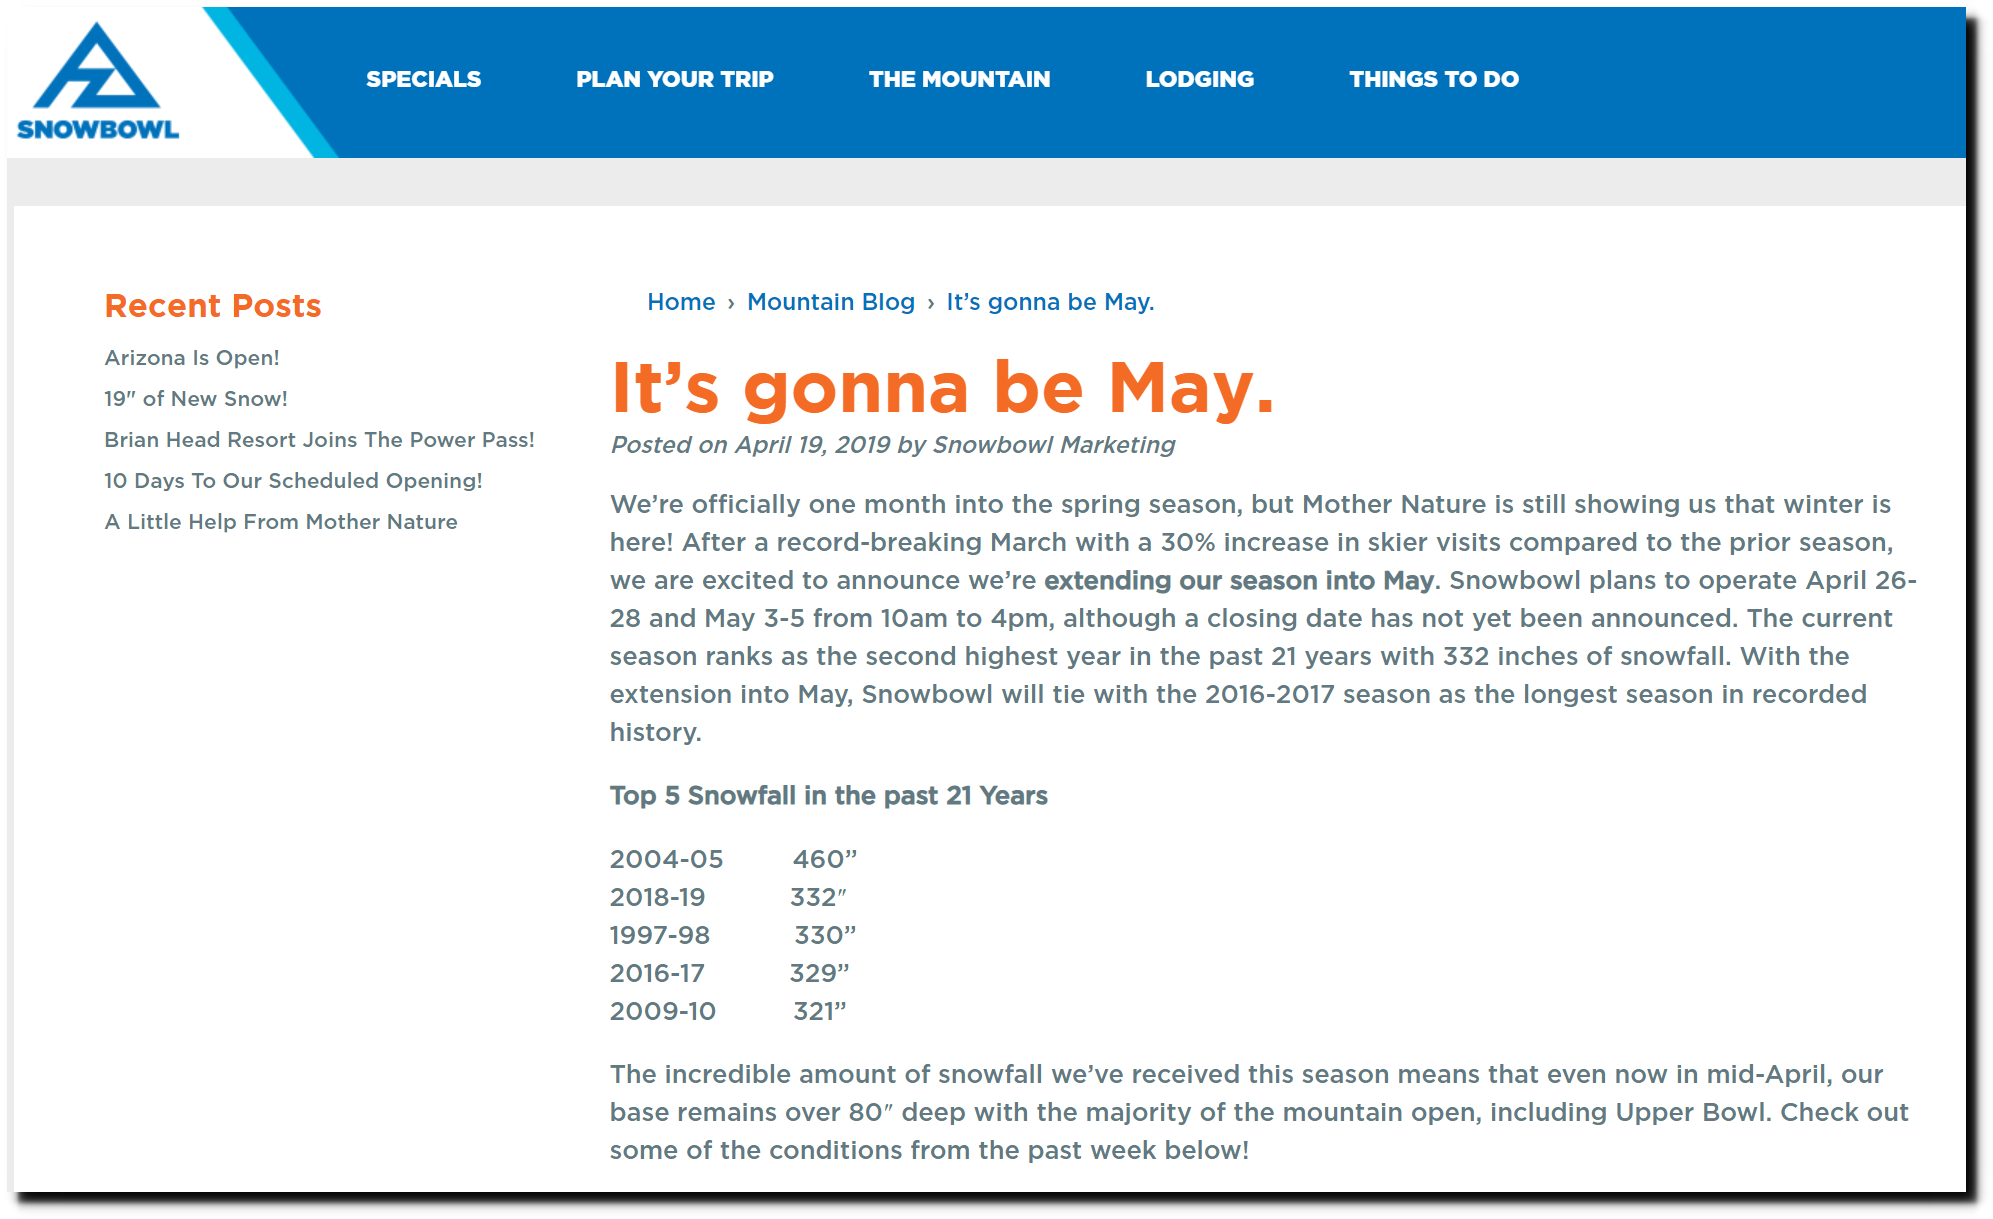
“Almost a metre of snow has been dumped on Mt Buller’s ski fields, the deepest snow level ever recorded for a Queen’s Birthday long weekend. After two years of lockdowns, the ski fields opened a week early this year thanks to a huge dumping of snow not typically seen until mid-July or August. Mt Buller’s snow depth has reached 76 centimetres, the most for a Queen’s Birthday weekend since records began 44 years ago. It was so deep on Saturday that staff were digging chair lifts out of the snow.”
‘There’s almost too much snow’: Snowfall breaks 44-year record on Queen’s Birthday long weekend
Five years ago scientists announced the demise of skiing in Australia.
Snowy retreat: Climate change puts Australia’s ski industry on a downhill slope
Britain’s 1,000 year old pub culture is at risk due to the energy and Russia sanctions policies of Boris and Brandon.
Seventy years ago, CSIRO knew that Australia was much hotter and drier prior to 1910. BOM responded by hiding all of the data prior to 1910.
“CLIMATIC CHANGE IN AUSTRALIA SINCE 1880
By E. L. DEACON*
[Manuscript received December 4, 1952]Australian climatic data show that, for the period 1911-1950, the summer rainfall over much of the southern part of the continent was considerably greater than in the previous 30 years and, for the same season, mean daily maximum temperatures in the interior were appreciably lower.”
Climate change and variability: Tracker: Australian timeseries graphs
A retired federal agent was regularly communicating with the Buffalo shooter and may have known his plans.
Ten years ago at Sandy Hook an armed off-duty SWAT team officer from another town was outside the school during the shooting and did nothing.
“A man with a gun who was spotted in the woods near the school on the day of the incident was an off-duty tactical squad police officer from another town, according to the source.”
Police Union Seeks Funding For Trauma Treatment | The Newtown Bee
I used to ride my bicycle past the school on my way to work, and there was no reason for an armed person from another town to be in the narrow strip of woods between the school and Interstate 84.